

m. Warszawa
| The statistics of election committe |
| Lists submitted | ||
| Specification | Number of | |
| lists | councils | |
| Lists submitted for councils of cities holding county rights | 0 | 0 |
| Lists submitted for districts councils of the cap. city of Warsaw | 3 | 1 |
| Totalling | 3 | 1 |
| Submitted candidates | |||||
| Specification | Number of candidates | Women | Women (%) | Men | Men (%) |
| Number of candidates submitted for councils of cities holding county rights | 0 | 0 | - | 0 | - |
| Number of candidates submitted for districts councils of the cap. city of Warsaw | 37 | 12 | 32,43% | 25 | 67.57% |
| Number of candidates submitted for reeve, mayor and presidential elections | 0 | 0 | - | 0 | - |
| Totalling | 37 | 12 | 32,43% | 25 | 67,57% |
| Average age of submitted candidates | |||
| Specification | Average age | Average age of women | Average age of men |
| Average age of candidates for councils of cities holding county rights | - | - | - |
| Average age of candidates for districts councils of the cap. city of Warsaw | 45 | 48 | 44 |
| Average age of candidates for reeve, mayor, president | - | - | - |
| Totalling | 45 | 48 | 44 |
| Submitted candidates for councils grouped by age | |||||
| Age | Number of candidates | Women | Women (%) | Men | Men (%) |
| 18-29 | 8 | 1 | 12,50% | 7 | 87,50% |
| 30-39 | 6 | 3 | 50,00% | 3 | 50,00% |
| 40-59 | 18 | 5 | 27,78% | 13 | 72,22% |
| 60+ | 5 | 3 | 60,00% | 2 | 40,00% |
| Totalling | 37 | 12 | 32,43% | 25 | 67,57% |
| Submitted candidates for reeve, mayor, president grouped by age | |||||
| Age | Number of candidates | Women | Women (%) | Men | Men (%) |
| 25-29 | 0 | 0 | - | 0 | - |
| 30-39 | 0 | 0 | - | 0 | - |
| 40-59 | 0 | 0 | - | 0 | - |
| 60+ | 0 | 0 | - | 0 | - |
| Totalling | 0 | 0 | - | 0 | - |
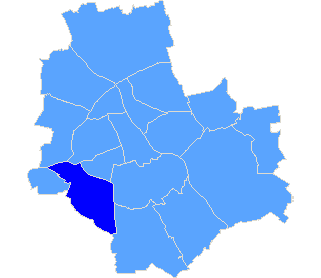
| Rada Dzielnicy Włochy m. st. Warszawy |
| Submitted candidates | ||||||
| Specification | Number of candidates | Women | Women (%) | Men | Men (%) | Status |
| Constituency no. 1 | 13 | 3 | 23,08% | 10 | 76,92% | Registered |
| Constituency no. 2 | 9 | 3 | 33,33% | 6 | 66,67% | Registered |
| Constituency no. 3 | 15 | 6 | 40,00% | 9 | 60,00% | Registered |
| Totalling | 37 | 12 | 32,43% | 25 | 67,57% | |
| Age of the candidates | |||||
| Specification | Average age | Average age of women | Average age of men | Oldest | Youngest |
| Constituency no. 1 | 43 | 50 | 41 | 77 | 21 |
| Constituency no. 2 | 44 | 39 | 47 | 68 | 22 |
| Constituency no. 3 | 47 | 52 | 44 | 75 | 20 |
| The statistics of election committe |
| Lists submitted | ||
| Specification | Number of | |
| lists | councils | |
| Lists submitted for districts councils of the cap. city of Warsaw | 3 | 1 |
| Totalling | 3 | 1 |
| Submitted candidates | |||||
| Specification | Number of candidates | Women | Women (%) | Men | Men (%) |
| Number of candidates submitted for districts councils of the cap. city of Warsaw | 37 | 12 | 32,43% | 25 | 67,57% |
| Totalling | 37 | 12 | 32,43% | 25 | 67,57% |
| Average age of submitted candidates | |||
| Specification | Average age | Average age of women | Average age of men |
| Average age of candidates for districts councils of the cap. city of Warsaw | 45 | 48 | 44 |
| Totalling | 45 | 48 | 44 |
| Submitted candidates for councils grouped by age | |||||
| Age | Number of candidates | Women | Women (%) | Men | Men (%) |
| 18-29 | 8 | 1 | 12,50% | 7 | 87,50% |
| 30-39 | 6 | 3 | 50,00% | 3 | 50,00% |
| 40-59 | 18 | 5 | 27,78% | 13 | 72,22% |
| 60+ | 5 | 3 | 60,00% | 2 | 40,00% |
| Totalling | 37 | 12 | 32,43% | 25 | 67,57% |
| The youngest and oldest submitted candidate for councils | ||
| Age | Institution | |
| Youngest | 20 | Rada Dzielnicy Włochy m. st. Warszawy |
| Oldest | 77 | Rada Dzielnicy Włochy m. st. Warszawy |
