

m. Warszawa
| The statistics of election committe |
| Lists submitted | ||
| Specification | Number of | |
| lists | councils | |
| Lists submitted for councils of cities holding county rights | 0 | 0 |
| Lists submitted for districts councils of the cap. city of Warsaw | 1 | 1 |
| Totalling | 1 | 1 |
| Submitted candidates | |||||
| Specification | Number of candidates | Women | Women (%) | Men | Men (%) |
| Number of candidates submitted for councils of cities holding county rights | 0 | 0 | - | 0 | - |
| Number of candidates submitted for districts councils of the cap. city of Warsaw | 6 | 4 | 66,67% | 2 | 33.33% |
| Number of candidates submitted for reeve, mayor and presidential elections | 0 | 0 | - | 0 | - |
| Totalling | 6 | 4 | 66,67% | 2 | 33,33% |
| Average age of submitted candidates | |||
| Specification | Average age | Average age of women | Average age of men |
| Average age of candidates for councils of cities holding county rights | - | - | - |
| Average age of candidates for districts councils of the cap. city of Warsaw | 37 | 38 | 35 |
| Average age of candidates for reeve, mayor, president | - | - | - |
| Totalling | 37 | 38 | 35 |
| Submitted candidates for councils grouped by age | |||||
| Age | Number of candidates | Women | Women (%) | Men | Men (%) |
| 18-29 | 1 | 1 | 100,00% | 0 | 0,00% |
| 30-39 | 4 | 2 | 50,00% | 2 | 50,00% |
| 40-59 | 1 | 1 | 100,00% | 0 | 0,00% |
| 60+ | 0 | 0 | - | 0 | - |
| Totalling | 6 | 4 | 66,67% | 2 | 33,33% |
| Submitted candidates for reeve, mayor, president grouped by age | |||||
| Age | Number of candidates | Women | Women (%) | Men | Men (%) |
| 25-29 | 0 | 0 | - | 0 | - |
| 30-39 | 0 | 0 | - | 0 | - |
| 40-59 | 0 | 0 | - | 0 | - |
| 60+ | 0 | 0 | - | 0 | - |
| Totalling | 0 | 0 | - | 0 | - |
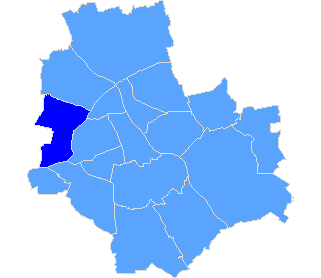
| Rada Dzielnicy Bemowo m.st. Warszawy |
| Submitted candidates | ||||||
| Specification | Number of candidates | Women | Women (%) | Men | Men (%) | Status |
| Constituency no. 3 | 6 | 4 | 66,67% | 2 | 33,33% | Registered |
| Totalling | 6 | 4 | 66,67% | 2 | 33,33% | |
| Age of the candidates | |||||
| Specification | Average age | Average age of women | Average age of men | Oldest | Youngest |
| Constituency no. 3 | 37 | 38 | 35 | 52 | 28 |
| The statistics of election committe |
| Lists submitted | ||
| Specification | Number of | |
| lists | councils | |
| Lists submitted for districts councils of the cap. city of Warsaw | 1 | 1 |
| Totalling | 1 | 1 |
| Submitted candidates | |||||
| Specification | Number of candidates | Women | Women (%) | Men | Men (%) |
| Number of candidates submitted for districts councils of the cap. city of Warsaw | 6 | 4 | 66,67% | 2 | 33,33% |
| Totalling | 6 | 4 | 66,67% | 2 | 33,33% |
| Average age of submitted candidates | |||
| Specification | Average age | Average age of women | Average age of men |
| Average age of candidates for districts councils of the cap. city of Warsaw | 37 | 38 | 35 |
| Totalling | 37 | 38 | 35 |
| Submitted candidates for councils grouped by age | |||||
| Age | Number of candidates | Women | Women (%) | Men | Men (%) |
| 18-29 | 1 | 1 | 100,00% | 0 | 0,00% |
| 30-39 | 4 | 2 | 50,00% | 2 | 50,00% |
| 40-59 | 1 | 1 | 100,00% | 0 | 0,00% |
| 60+ | 0 | 0 | - | 0 | - |
| Totalling | 6 | 4 | 66,67% | 2 | 33,33% |
| The youngest and oldest submitted candidate for councils | ||
| Age | Institution | |
| Youngest | 28 | Rada Dzielnicy Bemowo m.st. Warszawy |
| Oldest | 52 | Rada Dzielnicy Bemowo m.st. Warszawy |
