

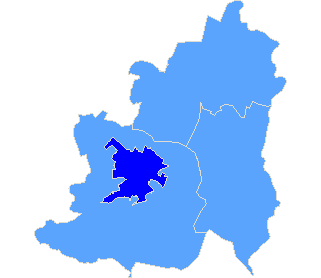
pow. lubiński
| Rada Powiatu w Lubinie |
| Submitted candidates | ||||||
| Specification | Number of candidates | Women | Women (%) | Men | Men (%) | Status |
| Constituency no. 3 | 5 | 0 | 0,00% | 5 | 100,00% | Registered |
| Totalling | 5 | 0 | 0,00% | 5 | 100,00% | |
| Age of the candidates | |||||
| Specification | Average age | Average age of women | Average age of men | Oldest | Youngest |
| Constituency no. 3 | 50 | - | 50 | 58 | 30 |
| The statistics of election committe |
| Lists submitted | ||
| Specification | Number of | |
| lists | councils | |
| Lists submitted for county councils | 1 | 1 |
| Lists registered for communal councils | 4 | 1 |
| Totalling | 5 | 2 |
| Submitted candidates | |||||
| Specification | Number of candidates | Women | Women (%) | Men | Men (%) |
| Number of candidates submitted for county councils | 5 | 0 | 0,00% | 5 | 100.00% |
| Number of candidates registered for communal councils | 40 | 11 | 27,50% | 29 | 72.50% |
| Number of candidates submitted for reeve, mayor and presidential elections | 0 | 0 | - | 0 | - |
| Totalling | 45 | 11 | 24,44% | 34 | 75,56% |
| Average age of submitted candidates | |||
| Specification | Average age | Average age of women | Average age of men |
| Average age of candidates submitted for county councils | 50 | - | 50 |
| Average age of candidates submitted for communal councils | 35 | 33 | 36 |
| Average age of candidates for reeve, mayor, president | - | - | - |
| Totalling | 36 | 33 | 38 |
| Submitted candidates for councils grouped by age | |||||
| Age | Number of candidates | Women | Women (%) | Men | Men (%) |
| 18-29 | 8 | 3 | 37,50% | 5 | 62,50% |
| 30-39 | 27 | 7 | 25,93% | 20 | 74,07% |
| 40-59 | 9 | 0 | 0,00% | 9 | 100,00% |
| 60+ | 1 | 1 | 100,00% | 0 | 0,00% |
| Totalling | 45 | 11 | 24,44% | 34 | 75,56% |
| Submitted candidates for reeve, mayor, president grouped by age | |||||
| Age | Number of candidates | Women | Women (%) | Men | Men (%) |
| 25-29 | 0 | 0 | - | 0 | - |
| 30-39 | 0 | 0 | - | 0 | - |
| 40-59 | 0 | 0 | - | 0 | - |
| 60+ | 0 | 0 | - | 0 | - |
| Totalling | 0 | 0 | - | 0 | - |
| The youngest and oldest submitted candidate for councils | ||
| Age | Institution | |
| Youngest | 23 | Rada Miejska w Lubinie |
| Oldest | 60 | Rada Miejska w Lubinie |
| Rada Miejska w Lubinie |
| Submitted candidates | ||||||
| Specification | Number of candidates | Women | Women (%) | Men | Men (%) | Status |
| Constituency no. 1 | 8 | 3 | 37,50% | 5 | 62,50% | Registered |
| Constituency no. 2 | 12 | 3 | 25,00% | 9 | 75,00% | Registered |
| Constituency no. 3 | 9 | 2 | 22,22% | 7 | 77,78% | Registered |
| Constituency no. 4 | 11 | 3 | 27,27% | 8 | 72,73% | Registered |
| Totalling | 40 | 11 | 27,50% | 29 | 72,50% | |
| Age of the candidates | |||||
| Specification | Average age | Average age of women | Average age of men | Oldest | Youngest |
| Constituency no. 1 | 38 | 32 | 41 | 59 | 28 |
| Constituency no. 2 | 34 | 40 | 32 | 60 | 28 |
| Constituency no. 3 | 33 | 25 | 35 | 43 | 24 |
| Constituency no. 4 | 36 | 34 | 37 | 55 | 23 |
| The statistics of election committe |
| Lists submitted | ||
| Specification | Number of | |
| lists | councils | |
| Lists registered for communal councils | 4 | 1 |
| Totalling | 4 | 1 |
| Submitted candidates | |||||
| Specification | Number of candidates | Women | Women (%) | Men | Men (%) |
| Number of candidates registered for communal councils | 40 | 11 | 27,50% | 29 | 72,50% |
| Number of candidates submitted for reeve, mayor and presidential elections | 0 | 0 | - | 0 | - |
| Totalling | 40 | 11 | 27,50% | 29 | 72,50% |
| Average age of submitted candidates | |||
| Specification | Average age | Average age of women | Average age of men |
| Average age of candidates submitted for communal councils | 35 | 33 | 36 |
| Average age of candidates for reeve, mayor, president | - | - | - |
| Totalling | 35 | 33 | 36 |
| Submitted candidates for councils grouped by age | |||||
| Age | Number of candidates | Women | Women (%) | Men | Men (%) |
| 18-29 | 8 | 3 | 37,50% | 5 | 62,50% |
| 30-39 | 26 | 7 | 26,92% | 19 | 73,08% |
| 40-59 | 5 | 0 | 0,00% | 5 | 100,00% |
| 60+ | 1 | 1 | 100,00% | 0 | 0,00% |
| Totalling | 40 | 11 | 27,50% | 29 | 72,50% |
| Submitted candidates for reeve, mayor, president grouped by age | |||||
| Age | Number of candidates | Women | Women (%) | Men | Men (%) |
| 25-29 | 0 | 0 | - | 0 | - |
| 30-39 | 0 | 0 | - | 0 | - |
| 40-59 | 0 | 0 | - | 0 | - |
| 60+ | 0 | 0 | - | 0 | - |
| Totalling | 0 | 0 | - | 0 | - |
| The youngest and oldest submitted candidate for councils | ||
| Age | Institution | |
| Youngest | 23 | Rada Miejska w Lubinie |
| Oldest | 60 | Rada Miejska w Lubinie |
