

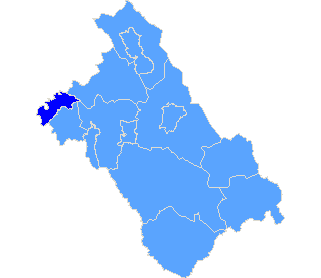
pow. kłodzki
| The statistics of election committe |
| Lists submitted | ||
| Specification | Number of | |
| lists | councils | |
| Lists submitted for county councils | 0 | 0 |
| Lists registered for communal councils | 6 | 1 |
| Totalling | 6 | 1 |
| Submitted candidates | |||||
| Specification | Number of candidates | Women | Women (%) | Men | Men (%) |
| Number of candidates submitted for county councils | 0 | 0 | - | 0 | - |
| Number of candidates registered for communal councils | 15 | 7 | 46,67% | 8 | 53.33% |
| Number of candidates submitted for reeve, mayor and presidential elections | 1 | 0 | 0,00% | 1 | 100.00% |
| Totalling | 16 | 7 | 43,75% | 9 | 56,25% |
| Average age of submitted candidates | |||
| Specification | Average age | Average age of women | Average age of men |
| Average age of candidates submitted for county councils | - | - | - |
| Average age of candidates submitted for communal councils | 54 | 56 | 53 |
| Average age of candidates for reeve, mayor, president | 64 | - | 64 |
| Totalling | 54 | 56 | 54 |
| Submitted candidates for councils grouped by age | |||||
| Age | Number of candidates | Women | Women (%) | Men | Men (%) |
| 18-29 | 0 | 0 | - | 0 | - |
| 30-39 | 2 | 0 | 0,00% | 2 | 100,00% |
| 40-59 | 6 | 4 | 66,67% | 2 | 33,33% |
| 60+ | 7 | 3 | 42,86% | 4 | 57,14% |
| Totalling | 15 | 7 | 46,67% | 8 | 53,33% |
| Submitted candidates for reeve, mayor, president grouped by age | |||||
| Age | Number of candidates | Women | Women (%) | Men | Men (%) |
| 25-29 | 0 | 0 | - | 0 | - |
| 30-39 | 0 | 0 | - | 0 | - |
| 40-59 | 0 | 0 | - | 0 | - |
| 60+ | 1 | 0 | 0,00% | 1 | 100,00% |
| Totalling | 1 | 0 | 0,00% | 1 | 100,00% |
| The youngest and oldest submitted candidate for councils | ||
| Age | Institution | |
| Youngest | 32 | Rada Miejska Kudowy-Zdroju |
| Oldest | 74 | Rada Miejska Kudowy-Zdroju |
| The youngest and oldest submitted candidate for reeve, mayor, president | ||
| Age | Institution | |
| Youngest | 64 | Burmistrz Miasta Kudowy-Zdroju |
| Oldest | 64 | Burmistrz Miasta Kudowy-Zdroju |
| Burmistrz Miasta Kudowy-Zdroju |
| Number of | Family name and given names | Age | Education | Address, party membership and endorsements |
| 3 | Kręcichwost Czesław Kazimierz | 64 | wyższe techniczne | Kudowa-Zdrój, submitted by KOMITET WYBORCZY STOWARZYSZENIA NA RZECZ ROZWOJU MIASTA KUDOWA-ZDRÓJ, endorsed by Stow. na Recz Rozwoju Miasta Kudowa, not a member of any political party |
| Rada Miejska Kudowy-Zdroju |
| Submitted candidates | ||||||
| Specification | Number of candidates | Women | Women (%) | Men | Men (%) | Status |
| Constituency no. 1 | 3 | 3 | 100,00% | 0 | 0,00% | Registered |
| Constituency no. 2 | 3 | 1 | 33,33% | 2 | 66,67% | Registered |
| Constituency no. 3 | 2 | 1 | 50,00% | 1 | 50,00% | Registered |
| Constituency no. 4 | 2 | 0 | 0,00% | 2 | 100,00% | Registered |
| Constituency no. 5 | 3 | 1 | 33,33% | 2 | 66,67% | Registered |
| Constituency no. 6 | 2 | 1 | 50,00% | 1 | 50,00% | Registered |
| Totalling | 15 | 7 | 46,67% | 8 | 53,33% | |
| Age of the candidates | |||||
| Specification | Average age | Average age of women | Average age of men | Oldest | Youngest |
| Constituency no. 1 | 47 | 47 | - | 50 | 44 |
| Constituency no. 2 | 59 | 60 | 58 | 63 | 53 |
| Constituency no. 3 | 67 | 74 | 60 | 74 | 60 |
| Constituency no. 4 | 47 | - | 47 | 62 | 32 |
| Constituency no. 5 | 56 | 52 | 59 | 62 | 52 |
| Constituency no. 6 | 48 | 63 | 33 | 63 | 33 |
| The statistics of election committe |
| Lists submitted | ||
| Specification | Number of | |
| lists | councils | |
| Lists registered for communal councils | 6 | 1 |
| Totalling | 6 | 1 |
| Submitted candidates | |||||
| Specification | Number of candidates | Women | Women (%) | Men | Men (%) |
| Number of candidates registered for communal councils | 15 | 7 | 46,67% | 8 | 53,33% |
| Number of candidates submitted for reeve, mayor and presidential elections | 1 | 0 | 0,00% | 1 | 100,00% |
| Totalling | 16 | 7 | 43,75% | 9 | 56,25% |
| Average age of submitted candidates | |||
| Specification | Average age | Average age of women | Average age of men |
| Average age of candidates submitted for communal councils | 54 | 56 | 53 |
| Average age of candidates for reeve, mayor, president | 64 | - | 64 |
| Totalling | 54 | 56 | 54 |
| Submitted candidates for councils grouped by age | |||||
| Age | Number of candidates | Women | Women (%) | Men | Men (%) |
| 18-29 | 0 | 0 | - | 0 | - |
| 30-39 | 2 | 0 | 0,00% | 2 | 100,00% |
| 40-59 | 6 | 4 | 66,67% | 2 | 33,33% |
| 60+ | 7 | 3 | 42,86% | 4 | 57,14% |
| Totalling | 15 | 7 | 46,67% | 8 | 53,33% |
| Submitted candidates for reeve, mayor, president grouped by age | |||||
| Age | Number of candidates | Women | Women (%) | Men | Men (%) |
| 25-29 | 0 | 0 | - | 0 | - |
| 30-39 | 0 | 0 | - | 0 | - |
| 40-59 | 0 | 0 | - | 0 | - |
| 60+ | 1 | 0 | 0,00% | 1 | 100,00% |
| Totalling | 1 | 0 | 0,00% | 1 | 100,00% |
| The youngest and oldest submitted candidate for councils | ||
| Age | Institution | |
| Youngest | 32 | Rada Miejska Kudowy-Zdroju |
| Oldest | 74 | Rada Miejska Kudowy-Zdroju |
| The youngest and oldest submitted candidate for reeve, mayor, president | ||
| Age | Institution | |
| Youngest | 64 | Burmistrz Miasta Kudowy-Zdroju |
| Oldest | 64 | Burmistrz Miasta Kudowy-Zdroju |
