
| KOMITET WYBORCZY WYBORCÓW TOMASZ KILIŃSKI | |
| Specification | KOMITET WYBORCZY WYBORCÓW TOMASZ KILIŃSKI |
| Short name: | KWW TOMASZ KILIŃSKI |
| Type of committee: | Election committees established by electors |
| Address: | Kłodzka 27, 57-402 Nowa Ruda |
| Electoral plenipotentiary: | Marzena Małgorzata Wolińska |
| Financial plenipotentiary: | Janusz Staniocha |

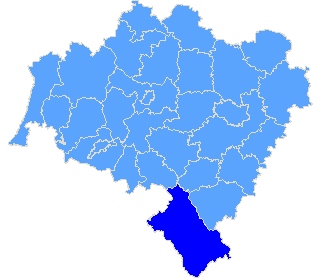
Province dolnośląskie
| County list |
| Specification |
| pow. kłodzki |
| The statistics of election committe |
| Lists submitted | ||
| Specification | Number of | |
| lists | councils | |
| Lists submitted for province council | 0 | 0 |
| Lists submitted for county councils | 0 | 0 |
| Lists submitted for councils of cities holding county rights | 0 | 0 |
| Lists registered for communal councils | 4 | 1 |
| Totalling | 4 | 1 |
| Submitted candidates | |||||
| Specification | Number of candidates | Women | Women (%) | Men | Men (%) |
| Number of candidates submitted for the province council | 0 | 0 | - | 0 | - |
| Number of candidates submitted for county councils | 0 | 0 | - | 0 | - |
| Number of candidates submitted for councils of cities holding county rights | 0 | 0 | - | 0 | - |
| Number of candidates registered for communal councils | 42 | 14 | 33,33% | 28 | 66.67 |
| Number of candidates submitted for reeve, mayor and presidential elections | 1 | 0 | 0,00% | 1 | 100,00% |
| Totalling | 43 | 14 | 32,56% | 29 | 67,44% |
| Average age of submitted candidates | |||
| Specification | Average age | Average age of women | Average age of men |
| Average age of candidates submitted for the province council | - | - | - |
| Average age of candidates submitted for county councils | - | - | - |
| Average age of candidates for councils of cities holding county rights | - | - | - |
| Average age of candidates submitted for communal councils | 45 | 48 | 44 |
| Average age of candidates for reeve, mayor, president | 39 | - | 39 |
| Totalling | 44 | 48 | 43 |
| Submitted candidates for councils grouped by age | |||||
| Age | Number of candidates | Women | Women (%) | Men | Men (%) |
| 18-29 | 1 | 0 | 0,00% | 1 | 100,00% |
| 30-39 | 14 | 3 | 21,43% | 11 | 78,57% |
| 40-59 | 21 | 7 | 33,33% | 14 | 66,67% |
| 60+ | 6 | 4 | 66,67% | 2 | 33,33% |
| Totalling | 42 | 14 | 33,33% | 28 | 66,67% |
| Submitted candidates for reeve, mayor, president grouped by age | |||||
| Age | Number of candidates | Women | Women (%) | Men | Men (%) |
| 25-29 | 0 | 0 | - | 0 | - |
| 30-39 | 1 | 0 | 0,00% | 1 | 100,00% |
| 40-59 | 0 | 0 | - | 0 | - |
| 60+ | 0 | 0 | - | 0 | - |
| Totalling | 1 | 0 | 0,00% | 1 | 100,00% |
| The youngest and oldest submitted candidate for councils | ||
| Age | Institution | |
| Youngest | 24 | Rada Miejska w Nowej Rudzie |
| Oldest | 64 | Rada Miejska w Nowej Rudzie |
| The youngest and oldest submitted candidate for reeve, mayor, president | ||
| Age | Institution | |
| Youngest | 39 | Burmistrz Miasta Nowa Ruda |
| Oldest | 39 | Burmistrz Miasta Nowa Ruda |
| Copyright © 2010 PKW | helpdesk@poczta.kbw.gov.pl | Author: Dituel Sp. z o.o. |  |
Website last modified on: 09-12-2010 18:39:23 |