
| KOMITET WYBORCZY WYBORCÓW TRZEBNICA 2000 PLUS | |
| Specification | KOMITET WYBORCZY WYBORCÓW TRZEBNICA 2000 PLUS |
| Short name: | KWW TRZEBNICA 2000 PLUS |
| Type of committee: | Election committees established by electors |
| Address: | ul. Solna 14/5, 55-100 Trzebnica |
| Electoral plenipotentiary: | Czesław Jan Czternastek |
| Financial plenipotentiary: | Mirosław Krzysztof Marzec |

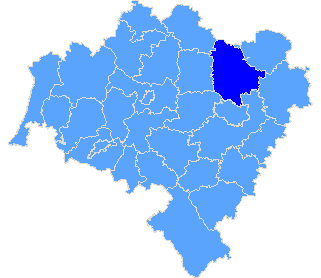
Province dolnośląskie
| County list |
| Specification |
| pow. trzebnicki |
| The statistics of election committe |
| Lists submitted | ||
| Specification | Number of | |
| lists | councils | |
| Lists submitted for province council | 0 | 0 |
| Lists submitted for county councils | 0 | 0 |
| Lists submitted for councils of cities holding county rights | 0 | 0 |
| Lists registered for communal councils | 3 | 1 |
| Totalling | 3 | 1 |
| Submitted candidates | |||||
| Specification | Number of candidates | Women | Women (%) | Men | Men (%) |
| Number of candidates submitted for the province council | 0 | 0 | - | 0 | - |
| Number of candidates submitted for county councils | 0 | 0 | - | 0 | - |
| Number of candidates submitted for councils of cities holding county rights | 0 | 0 | - | 0 | - |
| Number of candidates registered for communal councils | 40 | 18 | 45,00% | 22 | 55.00 |
| Number of candidates submitted for reeve, mayor and presidential elections | 0 | 0 | - | 0 | - |
| Totalling | 40 | 18 | 45,00% | 22 | 55,00% |
| Average age of submitted candidates | |||
| Specification | Average age | Average age of women | Average age of men |
| Average age of candidates submitted for the province council | - | - | - |
| Average age of candidates submitted for county councils | - | - | - |
| Average age of candidates for councils of cities holding county rights | - | - | - |
| Average age of candidates submitted for communal councils | 44 | 43 | 44 |
| Average age of candidates for reeve, mayor, president | - | - | - |
| Totalling | 44 | 43 | 44 |
| Submitted candidates for councils grouped by age | |||||
| Age | Number of candidates | Women | Women (%) | Men | Men (%) |
| 18-29 | 6 | 1 | 16,67% | 5 | 83,33% |
| 30-39 | 11 | 7 | 63,64% | 4 | 36,36% |
| 40-59 | 18 | 9 | 50,00% | 9 | 50,00% |
| 60+ | 5 | 1 | 20,00% | 4 | 80,00% |
| Totalling | 40 | 18 | 45,00% | 22 | 55,00% |
| Submitted candidates for reeve, mayor, president grouped by age | |||||
| Age | Number of candidates | Women | Women (%) | Men | Men (%) |
| 25-29 | 0 | 0 | - | 0 | - |
| 30-39 | 0 | 0 | - | 0 | - |
| 40-59 | 0 | 0 | - | 0 | - |
| 60+ | 0 | 0 | - | 0 | - |
| Totalling | 0 | 0 | - | 0 | - |
| The youngest and oldest submitted candidate for councils | ||
| Age | Institution | |
| Youngest | 24 | Rada Miejska w Trzebnicy |
| Oldest | 62 | Rada Miejska w Trzebnicy |
| Copyright © 2010 PKW | helpdesk@poczta.kbw.gov.pl | Author: Dituel Sp. z o.o. |  |
Website last modified on: 09-12-2010 18:39:23 |