

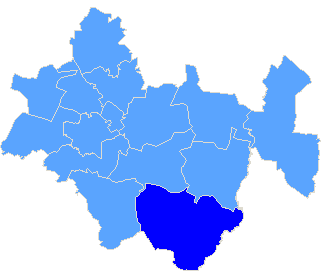
pow. radomszczański
| The statistics of election committe |
| Lists submitted | ||
| Specification | Number of | |
| lists | councils | |
| Lists submitted for county councils | 0 | 0 |
| Lists registered for communal councils | 11 | 1 |
| Totalling | 11 | 1 |
| Submitted candidates | |||||
| Specification | Number of candidates | Women | Women (%) | Men | Men (%) |
| Number of candidates submitted for county councils | 0 | 0 | - | 0 | - |
| Number of candidates registered for communal councils | 12 | 7 | 58,33% | 5 | 41.67% |
| Number of candidates submitted for reeve, mayor and presidential elections | 1 | 0 | 0,00% | 1 | 100.00% |
| Totalling | 13 | 7 | 53,85% | 6 | 46,15% |
| Average age of submitted candidates | |||
| Specification | Average age | Average age of women | Average age of men |
| Average age of candidates submitted for county councils | - | - | - |
| Average age of candidates submitted for communal councils | 42 | 48 | 34 |
| Average age of candidates for reeve, mayor, president | 51 | - | 51 |
| Totalling | 42 | 48 | 36 |
| Submitted candidates for councils grouped by age | |||||
| Age | Number of candidates | Women | Women (%) | Men | Men (%) |
| 18-29 | 3 | 0 | 0,00% | 3 | 100,00% |
| 30-39 | 2 | 2 | 100,00% | 0 | 0,00% |
| 40-59 | 5 | 3 | 60,00% | 2 | 40,00% |
| 60+ | 2 | 2 | 100,00% | 0 | 0,00% |
| Totalling | 12 | 7 | 58,33% | 5 | 41,67% |
| Submitted candidates for reeve, mayor, president grouped by age | |||||
| Age | Number of candidates | Women | Women (%) | Men | Men (%) |
| 25-29 | 0 | 0 | - | 0 | - |
| 30-39 | 0 | 0 | - | 0 | - |
| 40-59 | 1 | 0 | 0,00% | 1 | 100,00% |
| 60+ | 0 | 0 | - | 0 | - |
| Totalling | 1 | 0 | 0,00% | 1 | 100,00% |
| The youngest and oldest submitted candidate for councils | ||
| Age | Institution | |
| Youngest | 25 | Rada Gminy Żytno |
| Oldest | 63 | Rada Gminy Żytno |
| The youngest and oldest submitted candidate for reeve, mayor, president | ||
| Age | Institution | |
| Youngest | 51 | Wójt Gminy Żytno |
| Oldest | 51 | Wójt Gminy Żytno |
| Wójt Gminy Żytno |
| Number of | Family name and given names | Age | Education | Address, party membership and endorsements |
| 2 | Huć Cezary Bartłomiej | 51 | wyższe | Secemin, submitted by KOMITET WYBORCZY STOWARZYSZENIA NA RZECZ ROZWOJU GMINY ŻYTNO, endorsed by Stow. na Rzecz Rozwoju Gminy Żytno, not a member of any political party |
| Rada Gminy Żytno |
| Submitted candidates | ||||||
| Specification | Number of candidates | Women | Women (%) | Men | Men (%) | Status |
| Constituency no. 1 | 2 | 1 | 50,00% | 1 | 50,00% | Registered |
| Constituency no. 4 | 1 | 1 | 100,00% | 0 | 0,00% | Registered |
| Constituency no. 5 | 1 | 0 | 0,00% | 1 | 100,00% | Registered |
| Constituency no. 6 | 1 | 0 | 0,00% | 1 | 100,00% | Registered |
| Constituency no. 7 | 1 | 1 | 100,00% | 0 | 0,00% | Registered |
| Constituency no. 8 | 1 | 1 | 100,00% | 0 | 0,00% | Registered |
| Constituency no. 9 | 1 | 1 | 100,00% | 0 | 0,00% | Registered |
| Constituency no. 10 | 1 | 0 | 0,00% | 1 | 100,00% | Registered |
| Constituency no. 12 | 1 | 1 | 100,00% | 0 | 0,00% | Registered |
| Constituency no. 13 | 1 | 0 | 0,00% | 1 | 100,00% | Registered |
| Constituency no. 14 | 1 | 1 | 100,00% | 0 | 0,00% | Registered |
| Totalling | 12 | 7 | 58,33% | 5 | 41,67% | |
| Age of the candidates | |||||
| Specification | Average age | Average age of women | Average age of men | Oldest | Youngest |
| Constituency no. 1 | 46 | 63 | 29 | 63 | 29 |
| Constituency no. 4 | 54 | 54 | - | 54 | 54 |
| Constituency no. 5 | 25 | - | 25 | 25 | 25 |
| Constituency no. 6 | 42 | - | 42 | 42 | 42 |
| Constituency no. 7 | 43 | 43 | - | 43 | 43 |
| Constituency no. 8 | 61 | 61 | - | 61 | 61 |
| Constituency no. 9 | 45 | 45 | - | 45 | 45 |
| Constituency no. 10 | 29 | - | 29 | 29 | 29 |
| Constituency no. 12 | 31 | 31 | - | 31 | 31 |
| Constituency no. 13 | 43 | - | 43 | 43 | 43 |
| Constituency no. 14 | 36 | 36 | - | 36 | 36 |
| The statistics of election committe |
| Lists submitted | ||
| Specification | Number of | |
| lists | councils | |
| Lists registered for communal councils | 11 | 1 |
| Totalling | 11 | 1 |
| Submitted candidates | |||||
| Specification | Number of candidates | Women | Women (%) | Men | Men (%) |
| Number of candidates registered for communal councils | 12 | 7 | 58,33% | 5 | 41,67% |
| Number of candidates submitted for reeve, mayor and presidential elections | 1 | 0 | 0,00% | 1 | 100,00% |
| Totalling | 13 | 7 | 53,85% | 6 | 46,15% |
| Average age of submitted candidates | |||
| Specification | Average age | Average age of women | Average age of men |
| Average age of candidates submitted for communal councils | 42 | 48 | 34 |
| Average age of candidates for reeve, mayor, president | 51 | - | 51 |
| Totalling | 42 | 48 | 36 |
| Submitted candidates for councils grouped by age | |||||
| Age | Number of candidates | Women | Women (%) | Men | Men (%) |
| 18-29 | 3 | 0 | 0,00% | 3 | 100,00% |
| 30-39 | 2 | 2 | 100,00% | 0 | 0,00% |
| 40-59 | 5 | 3 | 60,00% | 2 | 40,00% |
| 60+ | 2 | 2 | 100,00% | 0 | 0,00% |
| Totalling | 12 | 7 | 58,33% | 5 | 41,67% |
| Submitted candidates for reeve, mayor, president grouped by age | |||||
| Age | Number of candidates | Women | Women (%) | Men | Men (%) |
| 25-29 | 0 | 0 | - | 0 | - |
| 30-39 | 0 | 0 | - | 0 | - |
| 40-59 | 1 | 0 | 0,00% | 1 | 100,00% |
| 60+ | 0 | 0 | - | 0 | - |
| Totalling | 1 | 0 | 0,00% | 1 | 100,00% |
| The youngest and oldest submitted candidate for councils | ||
| Age | Institution | |
| Youngest | 25 | Rada Gminy Żytno |
| Oldest | 63 | Rada Gminy Żytno |
| The youngest and oldest submitted candidate for reeve, mayor, president | ||
| Age | Institution | |
| Youngest | 51 | Wójt Gminy Żytno |
| Oldest | 51 | Wójt Gminy Żytno |
