
| KOMITET WYBORCZY WYBORCÓW STRAŻACKI KOMITET WYBORCZY | |
| Specification | KOMITET WYBORCZY WYBORCÓW STRAŻACKI KOMITET WYBORCZY |
| Short name: | KWW STRAŻACKI KOMITET WYBORCZY |
| Type of committee: | Election committees established by electors |
| Address: | Łubno 63b, 99-107, Daszyna |
| Electoral plenipotentiary: | Mirosława Maria Gutowska |
| Financial plenipotentiary: | Maria Małgorzata Kińska |

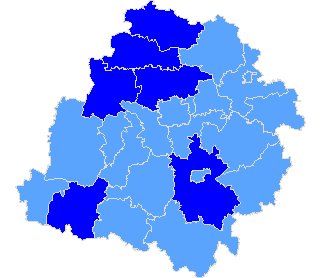
Province łódzkie
| Sejmik Województwa Łódzkiego |
| Submitted candidates | ||||||
| Specification | Number of candidates | Women | Women (%) | Men | Men (%) | Status |
| Constituency no. 1 | 9 | 4 | 44,44% | 5 | 55,56% | Registered |
| Constituency no. 2 | 10 | 5 | 50,00% | 5 | 50,00% | Registered |
| Constituency no. 3 | 11 | 2 | 18,18% | 9 | 81,82% | Registered |
| Constituency no. 4 | 9 | 5 | 55,56% | 4 | 44,44% | Registered |
| Constituency no. 5 | 12 | 8 | 66,67% | 4 | 33,33% | Registered |
| Constituency no. 6 | 8 | 3 | 37,50% | 5 | 62,50% | Registered |
| Totalling | 59 | 27 | 45,76% | 32 | 54,24% | |
| Age of the candidates | |||||
| Specification | Average age | Average age of women | Average age of men | Oldest | Youngest |
| Constituency no. 1 | 42 | 45 | 40 | 57 | 20 |
| Constituency no. 2 | 47 | 47 | 47 | 66 | 22 |
| Constituency no. 3 | 39 | 27 | 41 | 75 | 19 |
| Constituency no. 4 | 41 | 40 | 43 | 56 | 32 |
| Constituency no. 5 | 39 | 40 | 39 | 63 | 20 |
| Constituency no. 6 | 27 | 29 | 25 | 37 | 18 |
| County list |
| Specification |
| pow. kutnowski |
| pow. łęczycki |
| pow. piotrkowski |
| pow. poddębicki |
| pow. wieluński |
| pow. zgierski |
| The statistics of election committe |
| Lists submitted | ||
| Specification | Number of | |
| lists | councils | |
| Lists submitted for province council | 6 | 1 |
| Lists submitted for county councils | 0 | 0 |
| Lists submitted for councils of cities holding county rights | 0 | 0 |
| Lists registered for communal councils | 41 | 12 |
| Totalling | 47 | 13 |
| Submitted candidates | |||||
| Specification | Number of candidates | Women | Women (%) | Men | Men (%) |
| Number of candidates submitted for the province council | 59 | 27 | 45,76% | 32 | 54,24% |
| Number of candidates submitted for county councils | 0 | 0 | - | 0 | - |
| Number of candidates submitted for councils of cities holding county rights | 0 | 0 | - | 0 | - |
| Number of candidates registered for communal councils | 46 | 14 | 30,43% | 32 | 69.57 |
| Number of candidates submitted for reeve, mayor and presidential elections | 1 | 0 | 0,00% | 1 | 100,00% |
| Totalling | 106 | 41 | 38,68% | 65 | 61,32% |
| Average age of submitted candidates | |||
| Specification | Average age | Average age of women | Average age of men |
| Average age of candidates submitted for the province council | 40 | 40 | 39 |
| Average age of candidates submitted for county councils | - | - | - |
| Average age of candidates for councils of cities holding county rights | - | - | - |
| Average age of candidates submitted for communal councils | 41 | 43 | 40 |
| Average age of candidates for reeve, mayor, president | 42 | - | 42 |
| Totalling | 40 | 41 | 39 |
| Submitted candidates for councils grouped by age | |||||
| Age | Number of candidates | Women | Women (%) | Men | Men (%) |
| 18-29 | 27 | 9 | 33,33% | 18 | 66,67% |
| 30-39 | 28 | 12 | 42,86% | 16 | 57,14% |
| 40-59 | 40 | 16 | 40,00% | 24 | 60,00% |
| 60+ | 10 | 4 | 40,00% | 6 | 60,00% |
| Totalling | 105 | 41 | 39,05% | 64 | 60,95% |
| Submitted candidates for reeve, mayor, president grouped by age | |||||
| Age | Number of candidates | Women | Women (%) | Men | Men (%) |
| 25-29 | 0 | 0 | - | 0 | - |
| 30-39 | 0 | 0 | - | 0 | - |
| 40-59 | 1 | 0 | 0,00% | 1 | 100,00% |
| 60+ | 0 | 0 | - | 0 | - |
| Totalling | 1 | 0 | 0,00% | 1 | 100,00% |
| The youngest and oldest submitted candidate for councils | ||
| Age | Institution | |
| Youngest | 18 | Sejmik Województwa Łódzkiego |
| Oldest | 75 | Sejmik Województwa Łódzkiego |
| The youngest and oldest submitted candidate for reeve, mayor, president | ||
| Age | Institution | |
| Youngest | 42 | Wójt Gminy Grabów |
| Oldest | 42 | Wójt Gminy Grabów |
| Copyright © 2010 PKW | helpdesk@poczta.kbw.gov.pl | Author: Dituel Sp. z o.o. |  |
Website last modified on: 09-12-2010 18:39:23 |