
| KOMITET WYBORCZY WYBORCÓW PARTNERSTWO W SAMORZĄDZIE | |
| Specification | KOMITET WYBORCZY WYBORCÓW PARTNERSTWO W SAMORZĄDZIE |
| Short name: | KWW PARTNERSTWO W SAMORZĄDZIE |
| Type of committee: | Election committees established by electors |
| Address: | ul. Kazimierza Wielkiego 7, 32-400 Myślenice |
| Electoral plenipotentiary: | Adam Giza |
| Financial plenipotentiary: | Wojciech Andrzej Malinowski |

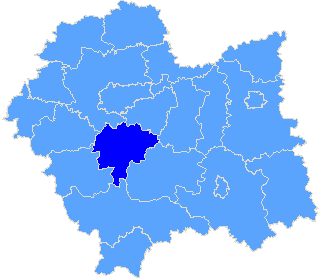
Province małopolskie
| County list |
| Specification |
| pow. myślenicki |
| The statistics of election committe |
| Lists submitted | ||
| Specification | Number of | |
| lists | councils | |
| Lists submitted for province council | 0 | 0 |
| Lists submitted for county councils | 5 | 1 |
| Lists submitted for councils of cities holding county rights | 0 | 0 |
| Lists registered for communal councils | 4 | 1 |
| Totalling | 9 | 2 |
| Submitted candidates | |||||
| Specification | Number of candidates | Women | Women (%) | Men | Men (%) |
| Number of candidates submitted for the province council | 0 | 0 | - | 0 | - |
| Number of candidates submitted for county councils | 43 | 9 | 20,93% | 34 | 79,07% |
| Number of candidates submitted for councils of cities holding county rights | 0 | 0 | - | 0 | - |
| Number of candidates registered for communal councils | 39 | 10 | 25,64% | 29 | 74.36 |
| Number of candidates submitted for reeve, mayor and presidential elections | 0 | 0 | - | 0 | - |
| Totalling | 82 | 19 | 23,17% | 63 | 76,83% |
| Average age of submitted candidates | |||
| Specification | Average age | Average age of women | Average age of men |
| Average age of candidates submitted for the province council | - | - | - |
| Average age of candidates submitted for county councils | 51 | 52 | 51 |
| Average age of candidates for councils of cities holding county rights | - | - | - |
| Average age of candidates submitted for communal councils | 43 | 42 | 43 |
| Average age of candidates for reeve, mayor, president | - | - | - |
| Totalling | 47 | 46 | 47 |
| Submitted candidates for councils grouped by age | |||||
| Age | Number of candidates | Women | Women (%) | Men | Men (%) |
| 18-29 | 9 | 2 | 22,22% | 7 | 77,78% |
| 30-39 | 16 | 4 | 25,00% | 12 | 75,00% |
| 40-59 | 43 | 10 | 23,26% | 33 | 76,74% |
| 60+ | 14 | 3 | 21,43% | 11 | 78,57% |
| Totalling | 82 | 19 | 23,17% | 63 | 76,83% |
| Submitted candidates for reeve, mayor, president grouped by age | |||||
| Age | Number of candidates | Women | Women (%) | Men | Men (%) |
| 25-29 | 0 | 0 | - | 0 | - |
| 30-39 | 0 | 0 | - | 0 | - |
| 40-59 | 0 | 0 | - | 0 | - |
| 60+ | 0 | 0 | - | 0 | - |
| Totalling | 0 | 0 | - | 0 | - |
| The youngest and oldest submitted candidate for councils | ||
| Age | Institution | |
| Youngest | 19 | Rada Miejska w Myślenicach |
| Oldest | 73 | Rada Powiatu w Myślenicach |
| Copyright © 2010 PKW | helpdesk@poczta.kbw.gov.pl | Author: Dituel Sp. z o.o. |  |
Website last modified on: 09-12-2010 18:39:23 |