
| KOMITET WYBORCZY WYBORCÓW WSPÓLNOTA SAMORZĄDOWA MIESZKAŃCÓW | |
| Specification | KOMITET WYBORCZY WYBORCÓW WSPÓLNOTA SAMORZĄDOWA MIESZKAŃCÓW |
| Short name: | KWW WSPÓLNOTA SAMORZĄDOWA MIESZKAŃCÓW |
| Type of committee: | Election committees established by electors |
| Address: | Rynek 6, 34-450 Krościenko nad Dunajcem |
| Electoral plenipotentiary: | Bronisław Bublik |
| Financial plenipotentiary: | Ewa Bydłoń |

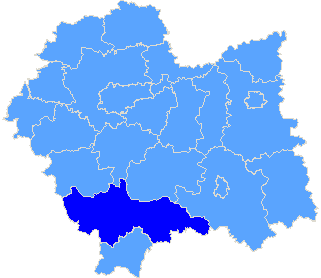
Province małopolskie
| County list |
| Specification |
| pow. nowotarski |
| The statistics of election committe |
| Lists submitted | ||
| Specification | Number of | |
| lists | councils | |
| Lists submitted for province council | 0 | 0 |
| Lists submitted for county councils | 7 | 1 |
| Lists submitted for councils of cities holding county rights | 0 | 0 |
| Lists registered for communal councils | 5 | 1 |
| Totalling | 12 | 2 |
| Submitted candidates | |||||
| Specification | Number of candidates | Women | Women (%) | Men | Men (%) |
| Number of candidates submitted for the province council | 0 | 0 | - | 0 | - |
| Number of candidates submitted for county councils | 42 | 7 | 16,67% | 35 | 83,33% |
| Number of candidates submitted for councils of cities holding county rights | 0 | 0 | - | 0 | - |
| Number of candidates registered for communal councils | 15 | 2 | 13,33% | 13 | 86.67 |
| Number of candidates submitted for reeve, mayor and presidential elections | 1 | 0 | 0,00% | 1 | 100,00% |
| Totalling | 58 | 9 | 15,52% | 49 | 84,48% |
| Average age of submitted candidates | |||
| Specification | Average age | Average age of women | Average age of men |
| Average age of candidates submitted for the province council | - | - | - |
| Average age of candidates submitted for county councils | 51 | 52 | 50 |
| Average age of candidates for councils of cities holding county rights | - | - | - |
| Average age of candidates submitted for communal councils | 44 | 51 | 43 |
| Average age of candidates for reeve, mayor, president | 40 | - | 40 |
| Totalling | 49 | 51 | 47 |
| Submitted candidates for councils grouped by age | |||||
| Age | Number of candidates | Women | Women (%) | Men | Men (%) |
| 18-29 | 8 | 0 | 0,00% | 8 | 100,00% |
| 30-39 | 6 | 1 | 16,67% | 5 | 83,33% |
| 40-59 | 29 | 6 | 20,69% | 23 | 79,31% |
| 60+ | 14 | 2 | 14,29% | 12 | 85,71% |
| Totalling | 57 | 9 | 15,79% | 48 | 84,21% |
| Submitted candidates for reeve, mayor, president grouped by age | |||||
| Age | Number of candidates | Women | Women (%) | Men | Men (%) |
| 25-29 | 0 | 0 | - | 0 | - |
| 30-39 | 0 | 0 | - | 0 | - |
| 40-59 | 1 | 0 | 0,00% | 1 | 100,00% |
| 60+ | 0 | 0 | - | 0 | - |
| Totalling | 1 | 0 | 0,00% | 1 | 100,00% |
| The youngest and oldest submitted candidate for councils | ||
| Age | Institution | |
| Youngest | 24 | Rada Powiatu Nowotarskiego |
| Oldest | 78 | Rada Gminy Lipnica Wielka |
| The youngest and oldest submitted candidate for reeve, mayor, president | ||
| Age | Institution | |
| Youngest | 40 | Wójt Gminy Lipnica Wielka |
| Oldest | 40 | Wójt Gminy Lipnica Wielka |
| Copyright © 2010 PKW | helpdesk@poczta.kbw.gov.pl | Author: Dituel Sp. z o.o. |  |
Website last modified on: 09-12-2010 18:39:23 |