
| KOMITET WYBORCZY WYBORCÓW NASZA GMINA LIBIĄŻ 2000 PLUS | |
| Specification | KOMITET WYBORCZY WYBORCÓW NASZA GMINA LIBIĄŻ 2000 PLUS |
| Short name: | KWW NASZA GMINA LIBIĄŻ 2000 PLUS |
| Type of committee: | Election committees established by electors |
| Address: | ul. Leśna 93A, 32-590 Libiąż |
| Electoral plenipotentiary: | Jarosław Piotr Łabęcki |
| Financial plenipotentiary: | Łukasz Paweł Brzózka |

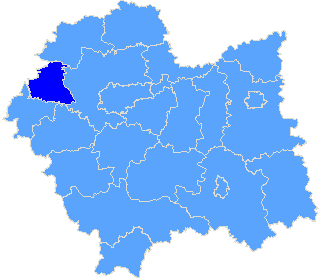
Province małopolskie
| County list |
| Specification |
| pow. chrzanowski |
| The statistics of election committe |
| Lists submitted | ||
| Specification | Number of | |
| lists | councils | |
| Lists submitted for province council | 0 | 0 |
| Lists submitted for county councils | 0 | 0 |
| Lists submitted for councils of cities holding county rights | 0 | 0 |
| Lists registered for communal councils | 3 | 1 |
| Totalling | 3 | 1 |
| Submitted candidates | |||||
| Specification | Number of candidates | Women | Women (%) | Men | Men (%) |
| Number of candidates submitted for the province council | 0 | 0 | - | 0 | - |
| Number of candidates submitted for county councils | 0 | 0 | - | 0 | - |
| Number of candidates submitted for councils of cities holding county rights | 0 | 0 | - | 0 | - |
| Number of candidates registered for communal councils | 41 | 11 | 26,83% | 30 | 73.17 |
| Number of candidates submitted for reeve, mayor and presidential elections | 1 | 0 | 0,00% | 1 | 100,00% |
| Totalling | 42 | 11 | 26,19% | 31 | 73,81% |
| Average age of submitted candidates | |||
| Specification | Average age | Average age of women | Average age of men |
| Average age of candidates submitted for the province council | - | - | - |
| Average age of candidates submitted for county councils | - | - | - |
| Average age of candidates for councils of cities holding county rights | - | - | - |
| Average age of candidates submitted for communal councils | 49 | 50 | 49 |
| Average age of candidates for reeve, mayor, president | 44 | - | 44 |
| Totalling | 48 | 50 | 48 |
| Submitted candidates for councils grouped by age | |||||
| Age | Number of candidates | Women | Women (%) | Men | Men (%) |
| 18-29 | 4 | 1 | 25,00% | 3 | 75,00% |
| 30-39 | 3 | 1 | 33,33% | 2 | 66,67% |
| 40-59 | 27 | 7 | 25,93% | 20 | 74,07% |
| 60+ | 7 | 2 | 28,57% | 5 | 71,43% |
| Totalling | 41 | 11 | 26,83% | 30 | 73,17% |
| Submitted candidates for reeve, mayor, president grouped by age | |||||
| Age | Number of candidates | Women | Women (%) | Men | Men (%) |
| 25-29 | 0 | 0 | - | 0 | - |
| 30-39 | 0 | 0 | - | 0 | - |
| 40-59 | 1 | 0 | 0,00% | 1 | 100,00% |
| 60+ | 0 | 0 | - | 0 | - |
| Totalling | 1 | 0 | 0,00% | 1 | 100,00% |
| The youngest and oldest submitted candidate for councils | ||
| Age | Institution | |
| Youngest | 21 | Rada Miejska w Libiążu |
| Oldest | 71 | Rada Miejska w Libiążu |
| The youngest and oldest submitted candidate for reeve, mayor, president | ||
| Age | Institution | |
| Youngest | 44 | Burmistrz Libiąża |
| Oldest | 44 | Burmistrz Libiąża |
| Copyright © 2010 PKW | helpdesk@poczta.kbw.gov.pl | Author: Dituel Sp. z o.o. |  |
Website last modified on: 09-12-2010 18:39:23 |