
| KOMITET WYBORCZY WYBORCÓW "NASZ POWIAT" | |
| Specification | KOMITET WYBORCZY WYBORCÓW "NASZ POWIAT" |
| Short name: | KWW "NASZ POWIAT" |
| Type of committee: | Election committees established by electors |
| Address: | ul. Wspólna 66, 08-103 Nowe Opole |
| Electoral plenipotentiary: | Michał Denisiuk |
| Financial plenipotentiary: | Monika Anna Adamczyk |

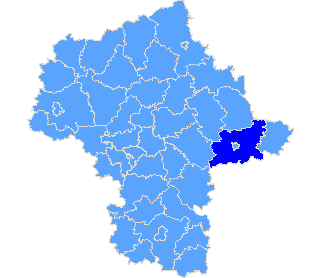
Province mazowieckie
| County list |
| Specification |
| pow. siedlecki |
| The statistics of election committe |
| Lists submitted | ||
| Specification | Number of | |
| lists | councils | |
| Lists submitted for province council | 0 | 0 |
| Lists submitted for county councils | 5 | 1 |
| Lists submitted for councils of cities holding county rights | 0 | 0 |
| Lists submitted for districts councils of the cap. city of Warsaw | 0 | 0 |
| Lists registered for communal councils | 17 | 2 |
| Totalling | 22 | 3 |
| Submitted candidates | |||||
| Specification | Number of candidates | Women | Women (%) | Men | Men (%) |
| Number of candidates submitted for the province council | 0 | 0 | - | 0 | - |
| Number of candidates submitted for county councils | 41 | 16 | 39,02% | 25 | 60,98% |
| Number of candidates submitted for councils of cities holding county rights | 0 | 0 | - | 0 | - |
| Number of candidates submitted for districts councils of the cap. city of Warsaw | 0 | 0 | - | 0 | - |
| Number of candidates registered for communal councils | 21 | 4 | 19,05% | 17 | 80.95 |
| Number of candidates submitted for reeve, mayor and presidential elections | 2 | 0 | 0,00% | 2 | 100,00% |
| Totalling | 64 | 20 | 31,25% | 44 | 68,75% |
| Average age of submitted candidates | |||
| Specification | Average age | Average age of women | Average age of men |
| Average age of candidates submitted for the province council | - | - | - |
| Average age of candidates submitted for county councils | 47 | 43 | 49 |
| Average age of candidates for councils of cities holding county rights | - | - | - |
| Average age of candidates for districts councils of the cap. city of Warsaw | - | - | - |
| Average age of candidates submitted for communal councils | 41 | 34 | 42 |
| Average age of candidates for reeve, mayor, president | 47 | - | 47 |
| Totalling | 45 | 41 | 46 |
| Submitted candidates for councils grouped by age | |||||
| Age | Number of candidates | Women | Women (%) | Men | Men (%) |
| 18-29 | 10 | 6 | 60,00% | 4 | 40,00% |
| 30-39 | 13 | 5 | 38,46% | 8 | 61,54% |
| 40-59 | 31 | 8 | 25,81% | 23 | 74,19% |
| 60+ | 8 | 1 | 12,50% | 7 | 87,50% |
| Totalling | 62 | 20 | 32,26% | 42 | 67,74% |
| Submitted candidates for reeve, mayor, president grouped by age | |||||
| Age | Number of candidates | Women | Women (%) | Men | Men (%) |
| 25-29 | 0 | 0 | - | 0 | - |
| 30-39 | 1 | 0 | 0,00% | 1 | 100,00% |
| 40-59 | 0 | 0 | - | 0 | - |
| 60+ | 1 | 0 | 0,00% | 1 | 100,00% |
| Totalling | 2 | 0 | 0,00% | 2 | 100,00% |
| The youngest and oldest submitted candidate for councils | ||
| Age | Institution | |
| Youngest | 19 | Rada Gminy w Skórcu |
| Oldest | 80 | Rada Gminy w Skórcu |
| The youngest and oldest submitted candidate for reeve, mayor, president | ||
| Age | Institution | |
| Youngest | 31 | Wójt Gminy Skórzec |
| Oldest | 64 | Wójt Gminy Wiśniew |
| Copyright © 2010 PKW | helpdesk@poczta.kbw.gov.pl | Author: Dituel Sp. z o.o. |  |
Website last modified on: 09-12-2010 18:39:23 |