
| KOMITET WYBORCZY WYBORCÓW "WSPÓLNOTA LOKALNA POWIATU LEGIONOWSKIEGO" | |
| Specification | KOMITET WYBORCZY WYBORCÓW "WSPÓLNOTA LOKALNA POWIATU LEGIONOWSKIEGO" |
| Short name: | KWW WSPÓLNOTA LOKALNA |
| Type of committee: | Election committees established by electors |
| Address: | ul. Mieszka I 25, 05-120 Legionowo |
| Electoral plenipotentiary: | Mieczysław Bronisław Romański |
| Financial plenipotentiary: | Karolina Maria Anuszkiewicz |

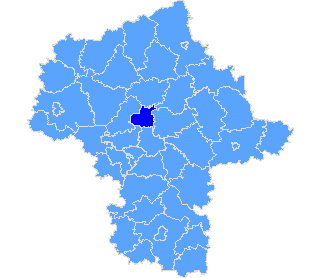
Province mazowieckie
| County list |
| Specification |
| pow. legionowski |
| The statistics of election committe |
| Lists submitted | ||
| Specification | Number of | |
| lists | councils | |
| Lists submitted for province council | 0 | 0 |
| Lists submitted for county councils | 4 | 1 |
| Lists submitted for councils of cities holding county rights | 0 | 0 |
| Lists submitted for districts councils of the cap. city of Warsaw | 0 | 0 |
| Lists registered for communal councils | 16 | 5 |
| Totalling | 20 | 6 |
| Submitted candidates | |||||
| Specification | Number of candidates | Women | Women (%) | Men | Men (%) |
| Number of candidates submitted for the province council | 0 | 0 | - | 0 | - |
| Number of candidates submitted for county councils | 23 | 6 | 26,09% | 17 | 73,91% |
| Number of candidates submitted for councils of cities holding county rights | 0 | 0 | - | 0 | - |
| Number of candidates submitted for districts councils of the cap. city of Warsaw | 0 | 0 | - | 0 | - |
| Number of candidates registered for communal councils | 29 | 6 | 20,69% | 23 | 79.31 |
| Number of candidates submitted for reeve, mayor and presidential elections | 0 | 0 | - | 0 | - |
| Totalling | 52 | 12 | 23,08% | 40 | 76,92% |
| Average age of submitted candidates | |||
| Specification | Average age | Average age of women | Average age of men |
| Average age of candidates submitted for the province council | - | - | - |
| Average age of candidates submitted for county councils | 42 | 39 | 43 |
| Average age of candidates for councils of cities holding county rights | - | - | - |
| Average age of candidates for districts councils of the cap. city of Warsaw | - | - | - |
| Average age of candidates submitted for communal councils | 39 | 39 | 39 |
| Average age of candidates for reeve, mayor, president | - | - | - |
| Totalling | 40 | 39 | 40 |
| Submitted candidates for councils grouped by age | |||||
| Age | Number of candidates | Women | Women (%) | Men | Men (%) |
| 18-29 | 15 | 2 | 13,33% | 13 | 86,67% |
| 30-39 | 17 | 6 | 35,29% | 11 | 64,71% |
| 40-59 | 11 | 3 | 27,27% | 8 | 72,73% |
| 60+ | 9 | 1 | 11,11% | 8 | 88,89% |
| Totalling | 52 | 12 | 23,08% | 40 | 76,92% |
| Submitted candidates for reeve, mayor, president grouped by age | |||||
| Age | Number of candidates | Women | Women (%) | Men | Men (%) |
| 25-29 | 0 | 0 | - | 0 | - |
| 30-39 | 0 | 0 | - | 0 | - |
| 40-59 | 0 | 0 | - | 0 | - |
| 60+ | 0 | 0 | - | 0 | - |
| Totalling | 0 | 0 | - | 0 | - |
| The youngest and oldest submitted candidate for councils | ||
| Age | Institution | |
| Youngest | 20 | Rada Powiatu w Legionowie |
| Oldest | 75 | Rada Powiatu w Legionowie |
| Copyright © 2010 PKW | helpdesk@poczta.kbw.gov.pl | Author: Dituel Sp. z o.o. |  |
Website last modified on: 09-12-2010 18:39:23 |