
| KOMITET WYBORCZY WYBORCÓW AKTYWNI DLA GMINY | |
| Specification | KOMITET WYBORCZY WYBORCÓW AKTYWNI DLA GMINY |
| Short name: | KWW AKTYWNI DLA GMINY |
| Type of committee: | Election committees established by electors |
| Address: | Częstoniew A 14, 05-600 Grójec |
| Electoral plenipotentiary: | Dariusz Leszek Piątkowski |
| Financial plenipotentiary: | Marek Sitkowski |

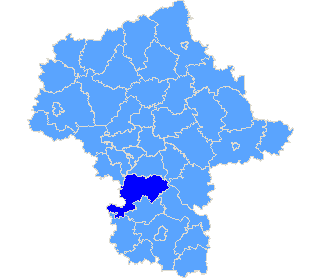
Province mazowieckie
| County list |
| Specification |
| pow. grójecki |
| The statistics of election committe |
| Lists submitted | ||
| Specification | Number of | |
| lists | councils | |
| Lists submitted for province council | 0 | 0 |
| Lists submitted for county councils | 0 | 0 |
| Lists submitted for councils of cities holding county rights | 0 | 0 |
| Lists submitted for districts councils of the cap. city of Warsaw | 0 | 0 |
| Lists registered for communal councils | 3 | 1 |
| Totalling | 3 | 1 |
| Submitted candidates | |||||
| Specification | Number of candidates | Women | Women (%) | Men | Men (%) |
| Number of candidates submitted for the province council | 0 | 0 | - | 0 | - |
| Number of candidates submitted for county councils | 0 | 0 | - | 0 | - |
| Number of candidates submitted for councils of cities holding county rights | 0 | 0 | - | 0 | - |
| Number of candidates submitted for districts councils of the cap. city of Warsaw | 0 | 0 | - | 0 | - |
| Number of candidates registered for communal councils | 41 | 6 | 14,63% | 35 | 85.37 |
| Number of candidates submitted for reeve, mayor and presidential elections | 1 | 0 | 0,00% | 1 | 100,00% |
| Totalling | 42 | 6 | 14,29% | 36 | 85,71% |
| Average age of submitted candidates | |||
| Specification | Average age | Average age of women | Average age of men |
| Average age of candidates submitted for the province council | - | - | - |
| Average age of candidates submitted for county councils | - | - | - |
| Average age of candidates for councils of cities holding county rights | - | - | - |
| Average age of candidates for districts councils of the cap. city of Warsaw | - | - | - |
| Average age of candidates submitted for communal councils | 37 | 40 | 36 |
| Average age of candidates for reeve, mayor, president | 30 | - | 30 |
| Totalling | 36 | 40 | 35 |
| Submitted candidates for councils grouped by age | |||||
| Age | Number of candidates | Women | Women (%) | Men | Men (%) |
| 18-29 | 7 | 0 | 0,00% | 7 | 100,00% |
| 30-39 | 23 | 4 | 17,39% | 19 | 82,61% |
| 40-59 | 11 | 2 | 18,18% | 9 | 81,82% |
| 60+ | 0 | 0 | - | 0 | - |
| Totalling | 41 | 6 | 14,63% | 35 | 85,37% |
| Submitted candidates for reeve, mayor, president grouped by age | |||||
| Age | Number of candidates | Women | Women (%) | Men | Men (%) |
| 25-29 | 0 | 0 | - | 0 | - |
| 30-39 | 1 | 0 | 0,00% | 1 | 100,00% |
| 40-59 | 0 | 0 | - | 0 | - |
| 60+ | 0 | 0 | - | 0 | - |
| Totalling | 1 | 0 | 0,00% | 1 | 100,00% |
| The youngest and oldest submitted candidate for councils | ||
| Age | Institution | |
| Youngest | 20 | Rada Miejska w Grójcu |
| Oldest | 58 | Rada Miejska w Grójcu |
| The youngest and oldest submitted candidate for reeve, mayor, president | ||
| Age | Institution | |
| Youngest | 30 | Burmistrz Gminy i Miasta Grójec |
| Oldest | 30 | Burmistrz Gminy i Miasta Grójec |
| Copyright © 2010 PKW | helpdesk@poczta.kbw.gov.pl | Author: Dituel Sp. z o.o. |  |
Website last modified on: 09-12-2010 18:39:23 |