

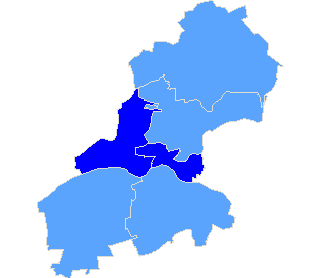
pow. nowodworski
| Rada Powiatu Nowodworskiego |
| Submitted candidates | ||||||
| Specification | Number of candidates | Women | Women (%) | Men | Men (%) | Status |
| Constituency no. 1 | 14 | 3 | 21,43% | 11 | 78,57% | Registered |
| Constituency no. 3 | 7 | 1 | 14,29% | 6 | 85,71% | Registered |
| Constituency no. 4 | 4 | 2 | 50,00% | 2 | 50,00% | Registered |
| Totalling | 25 | 6 | 24,00% | 19 | 76,00% | |
| Age of the candidates | |||||
| Specification | Average age | Average age of women | Average age of men | Oldest | Youngest |
| Constituency no. 1 | 50 | 52 | 50 | 66 | 37 |
| Constituency no. 3 | 41 | 31 | 43 | 57 | 27 |
| Constituency no. 4 | 45 | 49 | 41 | 54 | 34 |
| The statistics of election committe |
| Lists submitted | ||
| Specification | Number of | |
| lists | councils | |
| Lists submitted for county councils | 3 | 1 |
| Lists registered for communal councils | 14 | 2 |
| Totalling | 17 | 3 |
| Submitted candidates | |||||
| Specification | Number of candidates | Women | Women (%) | Men | Men (%) |
| Number of candidates submitted for county councils | 25 | 6 | 24,00% | 19 | 76.00% |
| Number of candidates registered for communal councils | 52 | 11 | 21,15% | 41 | 78.85% |
| Number of candidates submitted for reeve, mayor and presidential elections | 2 | 1 | 50,00% | 1 | 50.00% |
| Totalling | 79 | 18 | 22,78% | 61 | 77,22% |
| Average age of submitted candidates | |||
| Specification | Average age | Average age of women | Average age of men |
| Average age of candidates submitted for county councils | 47 | 47 | 47 |
| Average age of candidates submitted for communal councils | 49 | 56 | 46 |
| Average age of candidates for reeve, mayor, president | 34 | 30 | 38 |
| Totalling | 47 | 51 | 46 |
| Submitted candidates for councils grouped by age | |||||
| Age | Number of candidates | Women | Women (%) | Men | Men (%) |
| 18-29 | 8 | 1 | 12,50% | 7 | 87,50% |
| 30-39 | 11 | 1 | 9,09% | 10 | 90,91% |
| 40-59 | 45 | 9 | 20,00% | 36 | 80,00% |
| 60+ | 13 | 6 | 46,15% | 7 | 53,85% |
| Totalling | 77 | 17 | 22,08% | 60 | 77,92% |
| Submitted candidates for reeve, mayor, president grouped by age | |||||
| Age | Number of candidates | Women | Women (%) | Men | Men (%) |
| 25-29 | 0 | 0 | - | 0 | - |
| 30-39 | 2 | 1 | 50,00% | 1 | 50,00% |
| 40-59 | 0 | 0 | - | 0 | - |
| 60+ | 0 | 0 | - | 0 | - |
| Totalling | 2 | 1 | 50,00% | 1 | 50,00% |
| The youngest and oldest submitted candidate for councils | ||
| Age | Institution | |
| Youngest | 19 | Rada Miejska w Nowym Dworze Mazowieckim |
| Oldest | 74 | Rada Miejska w Nowym Dworze Mazowieckim |
| The youngest and oldest submitted candidate for reeve, mayor, president | ||
| Age | Institution | |
| Youngest | 30 | Burmistrz Gminy Zakroczym |
| Oldest | 38 | Burmistrz Miasta Nowy Dwór Mazowiecki |
| Burmistrz Miasta Nowy Dwór Mazowiecki |
| Number of | Family name and given names | Age | Education | Address, party membership and endorsements |
| 1 | Kowalski Jacek | 38 | wyższe | Nowy Dwór Mazowiecki, submitted by KOMITET WYBORCZY "WIARYGODNOŚĆ, NIEZALEŻNOŚĆ, DIALOG", not a member of any political party |
| Rada Miejska w Nowym Dworze Mazowieckim |
| Submitted candidates | ||||||
| Specification | Number of candidates | Women | Women (%) | Men | Men (%) | Status |
| Constituency no. 1 | 10 | 2 | 20,00% | 8 | 80,00% | Registered |
| Constituency no. 2 | 10 | 2 | 20,00% | 8 | 80,00% | Registered |
| Constituency no. 3 | 10 | 3 | 30,00% | 7 | 70,00% | Registered |
| Constituency no. 4 | 12 | 1 | 8,33% | 11 | 91,67% | Registered |
| Totalling | 42 | 8 | 19,05% | 34 | 80,95% | |
| Age of the candidates | |||||
| Specification | Average age | Average age of women | Average age of men | Oldest | Youngest |
| Constituency no. 1 | 52 | 59 | 50 | 65 | 20 |
| Constituency no. 2 | 45 | 47 | 45 | 64 | 19 |
| Constituency no. 3 | 51 | 57 | 48 | 74 | 27 |
| Constituency no. 4 | 48 | 65 | 46 | 65 | 19 |
| The statistics of election committe |
| Lists submitted | ||
| Specification | Number of | |
| lists | councils | |
| Lists registered for communal councils | 4 | 1 |
| Totalling | 4 | 1 |
| Submitted candidates | |||||
| Specification | Number of candidates | Women | Women (%) | Men | Men (%) |
| Number of candidates registered for communal councils | 42 | 8 | 19,05% | 34 | 80,95% |
| Number of candidates submitted for reeve, mayor and presidential elections | 1 | 0 | 0,00% | 1 | 100,00% |
| Totalling | 43 | 8 | 18,60% | 35 | 81,40% |
| Average age of submitted candidates | |||
| Specification | Average age | Average age of women | Average age of men |
| Average age of candidates submitted for communal councils | 49 | 56 | 47 |
| Average age of candidates for reeve, mayor, president | 38 | - | 38 |
| Totalling | 48 | 56 | 46 |
| Submitted candidates for councils grouped by age | |||||
| Age | Number of candidates | Women | Women (%) | Men | Men (%) |
| 18-29 | 6 | 1 | 16,67% | 5 | 83,33% |
| 30-39 | 5 | 0 | 0,00% | 5 | 100,00% |
| 40-59 | 21 | 3 | 14,29% | 18 | 85,71% |
| 60+ | 10 | 4 | 40,00% | 6 | 60,00% |
| Totalling | 42 | 8 | 19,05% | 34 | 80,95% |
| Submitted candidates for reeve, mayor, president grouped by age | |||||
| Age | Number of candidates | Women | Women (%) | Men | Men (%) |
| 25-29 | 0 | 0 | - | 0 | - |
| 30-39 | 1 | 0 | 0,00% | 1 | 100,00% |
| 40-59 | 0 | 0 | - | 0 | - |
| 60+ | 0 | 0 | - | 0 | - |
| Totalling | 1 | 0 | 0,00% | 1 | 100,00% |
| The youngest and oldest submitted candidate for councils | ||
| Age | Institution | |
| Youngest | 19 | Rada Miejska w Nowym Dworze Mazowieckim |
| Oldest | 74 | Rada Miejska w Nowym Dworze Mazowieckim |
| The youngest and oldest submitted candidate for reeve, mayor, president | ||
| Age | Institution | |
| Youngest | 38 | Burmistrz Miasta Nowy Dwór Mazowiecki |
| Oldest | 38 | Burmistrz Miasta Nowy Dwór Mazowiecki |
| Burmistrz Gminy Zakroczym |
| Number of | Family name and given names | Age | Education | Address, party membership and endorsements |
| 1 | Radzikowska Magdalena Stanisława | 30 | Wyższe | Zakroczym, submitted by KOMITET WYBORCZY "WIARYGODNOŚĆ, NIEZALEŻNOŚĆ, DIALOG", not a member of any political party |
| Rada Gminy Zakroczym |
| Submitted candidates | ||||||
| Specification | Number of candidates | Women | Women (%) | Men | Men (%) | Status |
| Constituency no. 2 | 1 | 1 | 100,00% | 0 | 0,00% | Registered |
| Constituency no. 3 | 1 | 1 | 100,00% | 0 | 0,00% | Registered |
| Constituency no. 4 | 1 | 0 | 0,00% | 1 | 100,00% | Registered |
| Constituency no. 7 | 1 | 1 | 100,00% | 0 | 0,00% | Registered |
| Constituency no. 8 | 1 | 0 | 0,00% | 1 | 100,00% | Registered |
| Constituency no. 11 | 1 | 0 | 0,00% | 1 | 100,00% | Registered |
| Constituency no. 12 | 1 | 0 | 0,00% | 1 | 100,00% | Registered |
| Constituency no. 13 | 1 | 0 | 0,00% | 1 | 100,00% | Registered |
| Constituency no. 14 | 1 | 0 | 0,00% | 1 | 100,00% | Registered |
| Constituency no. 15 | 1 | 0 | 0,00% | 1 | 100,00% | Registered |
| Totalling | 10 | 3 | 30,00% | 7 | 70,00% | |
| Age of the candidates | |||||
| Specification | Average age | Average age of women | Average age of men | Oldest | Youngest |
| Constituency no. 2 | 54 | 54 | - | 54 | 54 |
| Constituency no. 3 | 53 | 53 | - | 53 | 53 |
| Constituency no. 4 | 36 | - | 36 | 36 | 36 |
| Constituency no. 7 | 63 | 63 | - | 63 | 63 |
| Constituency no. 8 | 57 | - | 57 | 57 | 57 |
| Constituency no. 11 | 21 | - | 21 | 21 | 21 |
| Constituency no. 12 | 48 | - | 48 | 48 | 48 |
| Constituency no. 13 | 40 | - | 40 | 40 | 40 |
| Constituency no. 14 | 57 | - | 57 | 57 | 57 |
| Constituency no. 15 | 58 | - | 58 | 58 | 58 |
| The statistics of election committe |
| Lists submitted | ||
| Specification | Number of | |
| lists | councils | |
| Lists registered for communal councils | 10 | 1 |
| Totalling | 10 | 1 |
| Submitted candidates | |||||
| Specification | Number of candidates | Women | Women (%) | Men | Men (%) |
| Number of candidates registered for communal councils | 10 | 3 | 30,00% | 7 | 70,00% |
| Number of candidates submitted for reeve, mayor and presidential elections | 1 | 1 | 100,00% | 0 | 0,00% |
| Totalling | 11 | 4 | 36,36% | 7 | 63,64% |
| Average age of submitted candidates | |||
| Specification | Average age | Average age of women | Average age of men |
| Average age of candidates submitted for communal councils | 49 | 57 | 45 |
| Average age of candidates for reeve, mayor, president | 30 | 30 | - |
| Totalling | 47 | 50 | 45 |
| Submitted candidates for councils grouped by age | |||||
| Age | Number of candidates | Women | Women (%) | Men | Men (%) |
| 18-29 | 1 | 0 | 0,00% | 1 | 100,00% |
| 30-39 | 1 | 0 | 0,00% | 1 | 100,00% |
| 40-59 | 7 | 2 | 28,57% | 5 | 71,43% |
| 60+ | 1 | 1 | 100,00% | 0 | 0,00% |
| Totalling | 10 | 3 | 30,00% | 7 | 70,00% |
| Submitted candidates for reeve, mayor, president grouped by age | |||||
| Age | Number of candidates | Women | Women (%) | Men | Men (%) |
| 25-29 | 0 | 0 | - | 0 | - |
| 30-39 | 1 | 1 | 100,00% | 0 | 0,00% |
| 40-59 | 0 | 0 | - | 0 | - |
| 60+ | 0 | 0 | - | 0 | - |
| Totalling | 1 | 1 | 100,00% | 0 | 0,00% |
| The youngest and oldest submitted candidate for councils | ||
| Age | Institution | |
| Youngest | 21 | Rada Gminy Zakroczym |
| Oldest | 63 | Rada Gminy Zakroczym |
| The youngest and oldest submitted candidate for reeve, mayor, president | ||
| Age | Institution | |
| Youngest | 30 | Burmistrz Gminy Zakroczym |
| Oldest | 30 | Burmistrz Gminy Zakroczym |
