
| KOMITET WYBORCZY WYBORCÓW MŁAWA 2010 | |
| Specification | KOMITET WYBORCZY WYBORCÓW MŁAWA 2010 |
| Short name: | KWW MŁAWA 2010 |
| Type of committee: | Election committees established by electors |
| Address: | ul. Żwirki 16, 06-500 Mława |
| Electoral plenipotentiary: | Janusz Stanisław Wojnarowski |
| Financial plenipotentiary: | Kazimierz Borkowski |

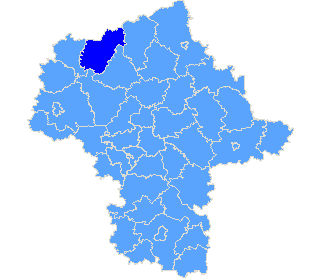
Province mazowieckie
| County list |
| Specification |
| pow. mławski |
| The statistics of election committe |
| Lists submitted | ||
| Specification | Number of | |
| lists | councils | |
| Lists submitted for province council | 0 | 0 |
| Lists submitted for county councils | 4 | 1 |
| Lists submitted for councils of cities holding county rights | 0 | 0 |
| Lists submitted for districts councils of the cap. city of Warsaw | 0 | 0 |
| Lists registered for communal councils | 3 | 1 |
| Totalling | 7 | 2 |
| Submitted candidates | |||||
| Specification | Number of candidates | Women | Women (%) | Men | Men (%) |
| Number of candidates submitted for the province council | 0 | 0 | - | 0 | - |
| Number of candidates submitted for county councils | 29 | 11 | 37,93% | 18 | 62,07% |
| Number of candidates submitted for councils of cities holding county rights | 0 | 0 | - | 0 | - |
| Number of candidates submitted for districts councils of the cap. city of Warsaw | 0 | 0 | - | 0 | - |
| Number of candidates registered for communal councils | 40 | 5 | 12,50% | 35 | 87.50 |
| Number of candidates submitted for reeve, mayor and presidential elections | 0 | 0 | - | 0 | - |
| Totalling | 69 | 16 | 23,19% | 53 | 76,81% |
| Average age of submitted candidates | |||
| Specification | Average age | Average age of women | Average age of men |
| Average age of candidates submitted for the province council | - | - | - |
| Average age of candidates submitted for county councils | 46 | 47 | 46 |
| Average age of candidates for councils of cities holding county rights | - | - | - |
| Average age of candidates for districts councils of the cap. city of Warsaw | - | - | - |
| Average age of candidates submitted for communal councils | 51 | 47 | 51 |
| Average age of candidates for reeve, mayor, president | - | - | - |
| Totalling | 48 | 47 | 49 |
| Submitted candidates for councils grouped by age | |||||
| Age | Number of candidates | Women | Women (%) | Men | Men (%) |
| 18-29 | 7 | 2 | 28,57% | 5 | 71,43% |
| 30-39 | 9 | 3 | 33,33% | 6 | 66,67% |
| 40-59 | 39 | 8 | 20,51% | 31 | 79,49% |
| 60+ | 14 | 3 | 21,43% | 11 | 78,57% |
| Totalling | 69 | 16 | 23,19% | 53 | 76,81% |
| Submitted candidates for reeve, mayor, president grouped by age | |||||
| Age | Number of candidates | Women | Women (%) | Men | Men (%) |
| 25-29 | 0 | 0 | - | 0 | - |
| 30-39 | 0 | 0 | - | 0 | - |
| 40-59 | 0 | 0 | - | 0 | - |
| 60+ | 0 | 0 | - | 0 | - |
| Totalling | 0 | 0 | - | 0 | - |
| The youngest and oldest submitted candidate for councils | ||
| Age | Institution | |
| Youngest | 22 | Rada Powiatu Mławskiego |
| Oldest | 75 | Rada Miejska w Mławie |
| Copyright © 2010 PKW | helpdesk@poczta.kbw.gov.pl | Author: Dituel Sp. z o.o. |  |
Website last modified on: 09-12-2010 18:39:23 |