
| KOMITET WYBORCZY WYBORCÓW RÓWNE SZANSE WĘGROWA | |
| Specification | KOMITET WYBORCZY WYBORCÓW RÓWNE SZANSE WĘGROWA |
| Short name: | KWW RÓWNE SZANSE WĘGROWA |
| Type of committee: | Election committees established by electors |
| Address: | ul. Jabłonowskiego 23, 07-100 Węgrów |
| Electoral plenipotentiary: | Sebastian Murawski |
| Financial plenipotentiary: | Krzysztof Stanisław Krasuski |

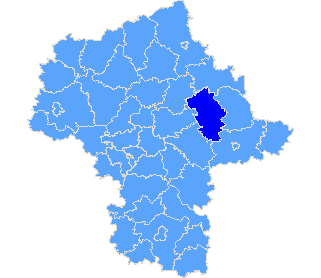
Province mazowieckie
| County list |
| Specification |
| pow. węgrowski |
| The statistics of election committe |
| Lists submitted | ||
| Specification | Number of | |
| lists | councils | |
| Lists submitted for province council | 0 | 0 |
| Lists submitted for county councils | 1 | 1 |
| Lists submitted for councils of cities holding county rights | 0 | 0 |
| Lists submitted for districts councils of the cap. city of Warsaw | 0 | 0 |
| Lists registered for communal councils | 0 | 0 |
| Totalling | 1 | 1 |
| Submitted candidates | |||||
| Specification | Number of candidates | Women | Women (%) | Men | Men (%) |
| Number of candidates submitted for the province council | 0 | 0 | - | 0 | - |
| Number of candidates submitted for county councils | 7 | 3 | 42,86% | 4 | 57,14% |
| Number of candidates submitted for councils of cities holding county rights | 0 | 0 | - | 0 | - |
| Number of candidates submitted for districts councils of the cap. city of Warsaw | 0 | 0 | - | 0 | - |
| Number of candidates registered for communal councils | 0 | 0 | - | 0 | - |
| Number of candidates submitted for reeve, mayor and presidential elections | 0 | 0 | - | 0 | - |
| Totalling | 7 | 3 | 42,86% | 4 | 57,14% |
| Average age of submitted candidates | |||
| Specification | Average age | Average age of women | Average age of men |
| Average age of candidates submitted for the province council | - | - | - |
| Average age of candidates submitted for county councils | 36 | 35 | 37 |
| Average age of candidates for councils of cities holding county rights | - | - | - |
| Average age of candidates for districts councils of the cap. city of Warsaw | - | - | - |
| Average age of candidates submitted for communal councils | - | - | - |
| Average age of candidates for reeve, mayor, president | - | - | - |
| Totalling | 36 | 35 | 37 |
| Submitted candidates for councils grouped by age | |||||
| Age | Number of candidates | Women | Women (%) | Men | Men (%) |
| 18-29 | 1 | 0 | 0,00% | 1 | 100,00% |
| 30-39 | 4 | 3 | 75,00% | 1 | 25,00% |
| 40-59 | 2 | 0 | 0,00% | 2 | 100,00% |
| 60+ | 0 | 0 | - | 0 | - |
| Totalling | 7 | 3 | 42,86% | 4 | 57,14% |
| Submitted candidates for reeve, mayor, president grouped by age | |||||
| Age | Number of candidates | Women | Women (%) | Men | Men (%) |
| 25-29 | 0 | 0 | - | 0 | - |
| 30-39 | 0 | 0 | - | 0 | - |
| 40-59 | 0 | 0 | - | 0 | - |
| 60+ | 0 | 0 | - | 0 | - |
| Totalling | 0 | 0 | - | 0 | - |
| The youngest and oldest submitted candidate for councils | ||
| Age | Institution | |
| Youngest | 21 | Rada Powiatu Węgrowskiego |
| Oldest | 50 | Rada Powiatu Węgrowskiego |
| Copyright © 2010 PKW | helpdesk@poczta.kbw.gov.pl | Author: Dituel Sp. z o.o. |  |
Website last modified on: 09-12-2010 18:39:23 |