

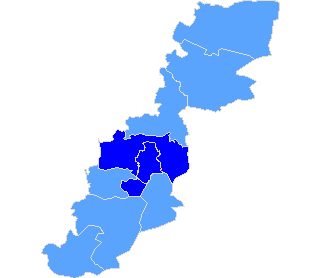
pow. przeworski
| The statistics of election committe |
| Lists submitted | ||
| Specification | Number of | |
| lists | councils | |
| Lists submitted for county councils | 0 | 0 |
| Lists registered for communal councils | 11 | 2 |
| Totalling | 11 | 2 |
| Submitted candidates | |||||
| Specification | Number of candidates | Women | Women (%) | Men | Men (%) |
| Number of candidates submitted for county councils | 0 | 0 | - | 0 | - |
| Number of candidates registered for communal councils | 14 | 2 | 14,29% | 12 | 85.71% |
| Number of candidates submitted for reeve, mayor and presidential elections | 1 | 0 | 0,00% | 1 | 100.00% |
| Totalling | 15 | 2 | 13,33% | 13 | 86,67% |
| Average age of submitted candidates | |||
| Specification | Average age | Average age of women | Average age of men |
| Average age of candidates submitted for county councils | - | - | - |
| Average age of candidates submitted for communal councils | 37 | 37 | 37 |
| Average age of candidates for reeve, mayor, president | 40 | - | 40 |
| Totalling | 37 | 37 | 37 |
| Submitted candidates for councils grouped by age | |||||
| Age | Number of candidates | Women | Women (%) | Men | Men (%) |
| 18-29 | 3 | 0 | 0,00% | 3 | 100,00% |
| 30-39 | 8 | 2 | 25,00% | 6 | 75,00% |
| 40-59 | 3 | 0 | 0,00% | 3 | 100,00% |
| 60+ | 0 | 0 | - | 0 | - |
| Totalling | 14 | 2 | 14,29% | 12 | 85,71% |
| Submitted candidates for reeve, mayor, president grouped by age | |||||
| Age | Number of candidates | Women | Women (%) | Men | Men (%) |
| 25-29 | 0 | 0 | - | 0 | - |
| 30-39 | 0 | 0 | - | 0 | - |
| 40-59 | 1 | 0 | 0,00% | 1 | 100,00% |
| 60+ | 0 | 0 | - | 0 | - |
| Totalling | 1 | 0 | 0,00% | 1 | 100,00% |
| The youngest and oldest submitted candidate for councils | ||
| Age | Institution | |
| Youngest | 23 | Rada Miasta Przeworska |
| Oldest | 57 | Rada Miasta Przeworska |
| The youngest and oldest submitted candidate for reeve, mayor, president | ||
| Age | Institution | |
| Youngest | 40 | Burmistrz Miasta Przeworska |
| Oldest | 40 | Burmistrz Miasta Przeworska |
| Burmistrz Miasta Przeworska |
| Number of | Family name and given names | Age | Education | Address, party membership and endorsements |
| 2 | Frączek Marek | 40 | wyższe | Przeworsk, submitted by KOMITET WYBORCZY WYBORCÓW MARKA FRĄCZKA, not a member of any political party |
| Rada Miasta Przeworska |
| Submitted candidates | ||||||
| Specification | Number of candidates | Women | Women (%) | Men | Men (%) | Status |
| Constituency no. 1 | 1 | 0 | 0,00% | 1 | 100,00% | Registered |
| Constituency no. 2 | 1 | 0 | 0,00% | 1 | 100,00% | Registered |
| Constituency no. 3 | 1 | 0 | 0,00% | 1 | 100,00% | Registered |
| Constituency no. 4 | 2 | 0 | 0,00% | 2 | 100,00% | Registered |
| Constituency no. 5 | 1 | 0 | 0,00% | 1 | 100,00% | Registered |
| Constituency no. 6 | 1 | 0 | 0,00% | 1 | 100,00% | Registered |
| Constituency no. 7 | 1 | 0 | 0,00% | 1 | 100,00% | Registered |
| Constituency no. 8 | 2 | 0 | 0,00% | 2 | 100,00% | Registered |
| Constituency no. 9 | 2 | 0 | 0,00% | 2 | 100,00% | Registered |
| Constituency no. 10 | 1 | 1 | 100,00% | 0 | 0,00% | Registered |
| Totalling | 13 | 1 | 7,69% | 12 | 92,31% | |
| Age of the candidates | |||||
| Specification | Average age | Average age of women | Average age of men | Oldest | Youngest |
| Constituency no. 1 | 34 | - | 34 | 34 | 34 |
| Constituency no. 2 | 23 | - | 23 | 23 | 23 |
| Constituency no. 3 | 38 | - | 38 | 38 | 38 |
| Constituency no. 4 | 34 | - | 34 | 38 | 29 |
| Constituency no. 5 | 34 | - | 34 | 34 | 34 |
| Constituency no. 6 | 40 | - | 40 | 40 | 40 |
| Constituency no. 7 | 25 | - | 25 | 25 | 25 |
| Constituency no. 8 | 44 | - | 44 | 52 | 35 |
| Constituency no. 9 | 48 | - | 48 | 57 | 38 |
| Constituency no. 10 | 35 | 35 | - | 35 | 35 |
| The statistics of election committe |
| Lists submitted | ||
| Specification | Number of | |
| lists | councils | |
| Lists registered for communal councils | 10 | 1 |
| Totalling | 10 | 1 |
| Submitted candidates | |||||
| Specification | Number of candidates | Women | Women (%) | Men | Men (%) |
| Number of candidates registered for communal councils | 13 | 1 | 7,69% | 12 | 92,31% |
| Number of candidates submitted for reeve, mayor and presidential elections | 1 | 0 | 0,00% | 1 | 100,00% |
| Totalling | 14 | 1 | 7,14% | 13 | 92,86% |
| Average age of submitted candidates | |||
| Specification | Average age | Average age of women | Average age of men |
| Average age of candidates submitted for communal councils | 37 | 35 | 37 |
| Average age of candidates for reeve, mayor, president | 40 | - | 40 |
| Totalling | 37 | 35 | 37 |
| Submitted candidates for councils grouped by age | |||||
| Age | Number of candidates | Women | Women (%) | Men | Men (%) |
| 18-29 | 3 | 0 | 0,00% | 3 | 100,00% |
| 30-39 | 7 | 1 | 14,29% | 6 | 85,71% |
| 40-59 | 3 | 0 | 0,00% | 3 | 100,00% |
| 60+ | 0 | 0 | - | 0 | - |
| Totalling | 13 | 1 | 7,69% | 12 | 92,31% |
| Submitted candidates for reeve, mayor, president grouped by age | |||||
| Age | Number of candidates | Women | Women (%) | Men | Men (%) |
| 25-29 | 0 | 0 | - | 0 | - |
| 30-39 | 0 | 0 | - | 0 | - |
| 40-59 | 1 | 0 | 0,00% | 1 | 100,00% |
| 60+ | 0 | 0 | - | 0 | - |
| Totalling | 1 | 0 | 0,00% | 1 | 100,00% |
| The youngest and oldest submitted candidate for councils | ||
| Age | Institution | |
| Youngest | 23 | Rada Miasta Przeworska |
| Oldest | 57 | Rada Miasta Przeworska |
| The youngest and oldest submitted candidate for reeve, mayor, president | ||
| Age | Institution | |
| Youngest | 40 | Burmistrz Miasta Przeworska |
| Oldest | 40 | Burmistrz Miasta Przeworska |
| Rada Gminy Przeworsk |
| Submitted candidates | ||||||
| Specification | Number of candidates | Women | Women (%) | Men | Men (%) | Status |
| Constituency no. 4 | 1 | 1 | 100,00% | 0 | 0,00% | Registered |
| Totalling | 1 | 1 | 100,00% | 0 | 0,00% | |
| Age of the candidates | |||||
| Specification | Average age | Average age of women | Average age of men | Oldest | Youngest |
| Constituency no. 4 | 39 | 39 | - | 39 | 39 |
| The statistics of election committe |
| Lists submitted | ||
| Specification | Number of | |
| lists | councils | |
| Lists registered for communal councils | 1 | 1 |
| Totalling | 1 | 1 |
| Submitted candidates | |||||
| Specification | Number of candidates | Women | Women (%) | Men | Men (%) |
| Number of candidates registered for communal councils | 1 | 1 | 100,00% | 0 | 0,00% |
| Number of candidates submitted for reeve, mayor and presidential elections | 0 | 0 | - | 0 | - |
| Totalling | 1 | 1 | 100,00% | 0 | 0,00% |
| Average age of submitted candidates | |||
| Specification | Average age | Average age of women | Average age of men |
| Average age of candidates submitted for communal councils | 39 | 39 | - |
| Average age of candidates for reeve, mayor, president | - | - | - |
| Totalling | 39 | 39 | - |
| Submitted candidates for councils grouped by age | |||||
| Age | Number of candidates | Women | Women (%) | Men | Men (%) |
| 18-29 | 0 | 0 | - | 0 | - |
| 30-39 | 1 | 1 | 100,00% | 0 | 0,00% |
| 40-59 | 0 | 0 | - | 0 | - |
| 60+ | 0 | 0 | - | 0 | - |
| Totalling | 1 | 1 | 100,00% | 0 | 0,00% |
| Submitted candidates for reeve, mayor, president grouped by age | |||||
| Age | Number of candidates | Women | Women (%) | Men | Men (%) |
| 25-29 | 0 | 0 | - | 0 | - |
| 30-39 | 0 | 0 | - | 0 | - |
| 40-59 | 0 | 0 | - | 0 | - |
| 60+ | 0 | 0 | - | 0 | - |
| Totalling | 0 | 0 | - | 0 | - |
| The youngest and oldest submitted candidate for councils | ||
| Age | Institution | |
| Youngest | 39 | Rada Gminy Przeworsk |
| Oldest | 39 | Rada Gminy Przeworsk |
