

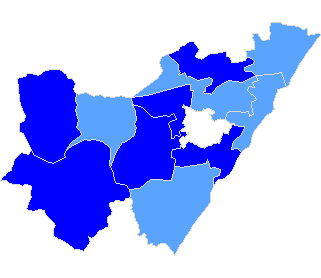
pow. przemyski
| Rada Powiatu Przemyskiego |
| Submitted candidates | ||||||
| Specification | Number of candidates | Women | Women (%) | Men | Men (%) | Status |
| Constituency no. 1 | 6 | 1 | 16,67% | 5 | 83,33% | Registered |
| Constituency no. 2 | 6 | 0 | 0,00% | 6 | 100,00% | Registered |
| Constituency no. 3 | 9 | 3 | 33,33% | 6 | 66,67% | Registered |
| Constituency no. 4 | 10 | 0 | 0,00% | 10 | 100,00% | Registered |
| Totalling | 31 | 4 | 12,90% | 27 | 87,10% | |
| Age of the candidates | |||||
| Specification | Average age | Average age of women | Average age of men | Oldest | Youngest |
| Constituency no. 1 | 47 | 47 | 46 | 53 | 31 |
| Constituency no. 2 | 50 | - | 50 | 60 | 33 |
| Constituency no. 3 | 45 | 42 | 46 | 53 | 34 |
| Constituency no. 4 | 42 | - | 42 | 60 | 27 |
| The statistics of election committe |
| Lists submitted | ||
| Specification | Number of | |
| lists | councils | |
| Lists submitted for county councils | 4 | 1 |
| Lists registered for communal councils | 24 | 5 |
| Totalling | 28 | 6 |
| Submitted candidates | |||||
| Specification | Number of candidates | Women | Women (%) | Men | Men (%) |
| Number of candidates submitted for county councils | 31 | 4 | 12,90% | 27 | 87.10% |
| Number of candidates registered for communal councils | 30 | 10 | 33,33% | 20 | 66.67% |
| Number of candidates submitted for reeve, mayor and presidential elections | 1 | 0 | 0,00% | 1 | 100.00% |
| Totalling | 62 | 14 | 22,58% | 48 | 77,42% |
| Average age of submitted candidates | |||
| Specification | Average age | Average age of women | Average age of men |
| Average age of candidates submitted for county councils | 45 | 44 | 45 |
| Average age of candidates submitted for communal councils | 48 | 45 | 50 |
| Average age of candidates for reeve, mayor, president | 53 | - | 53 |
| Totalling | 46 | 44 | 47 |
| Submitted candidates for councils grouped by age | |||||
| Age | Number of candidates | Women | Women (%) | Men | Men (%) |
| 18-29 | 3 | 1 | 33,33% | 2 | 66,67% |
| 30-39 | 13 | 3 | 23,08% | 10 | 76,92% |
| 40-59 | 40 | 9 | 22,50% | 31 | 77,50% |
| 60+ | 5 | 1 | 20,00% | 4 | 80,00% |
| Totalling | 61 | 14 | 22,95% | 47 | 77,05% |
| Submitted candidates for reeve, mayor, president grouped by age | |||||
| Age | Number of candidates | Women | Women (%) | Men | Men (%) |
| 25-29 | 0 | 0 | - | 0 | - |
| 30-39 | 0 | 0 | - | 0 | - |
| 40-59 | 1 | 0 | 0,00% | 1 | 100,00% |
| 60+ | 0 | 0 | - | 0 | - |
| Totalling | 1 | 0 | 0,00% | 1 | 100,00% |
| The youngest and oldest submitted candidate for councils | ||
| Age | Institution | |
| Youngest | 27 | Rada Powiatu Przemyskiego |
| Oldest | 63 | Rada Gminy Przemyśl |
| The youngest and oldest submitted candidate for reeve, mayor, president | ||
| Age | Institution | |
| Youngest | 53 | Wójt Gminy Bircza |
| Oldest | 53 | Wójt Gminy Bircza |
| Wójt Gminy Bircza |
| Number of | Family name and given names | Age | Education | Address, party membership and endorsements |
| 1 | Góralewicz Jerzy Zenon | 53 | wyższe | Bircza, submitted by KOMITET WYBORCZY WYBORCÓW POWIATOWE FORUM SAMORZĄDOWE PRAWICY, not a member of any political party |
| Rada Gminy Bircza |
| Submitted candidates | ||||||
| Specification | Number of candidates | Women | Women (%) | Men | Men (%) | Status |
| Constituency no. 1 | 2 | 0 | 0,00% | 2 | 100,00% | Registered |
| Constituency no. 2 | 1 | 1 | 100,00% | 0 | 0,00% | Registered |
| Constituency no. 3 | 1 | 0 | 0,00% | 1 | 100,00% | Registered |
| Constituency no. 4 | 1 | 0 | 0,00% | 1 | 100,00% | Registered |
| Constituency no. 5 | 1 | 0 | 0,00% | 1 | 100,00% | Registered |
| Constituency no. 6 | 2 | 1 | 50,00% | 1 | 50,00% | Registered |
| Constituency no. 7 | 1 | 0 | 0,00% | 1 | 100,00% | Registered |
| Constituency no. 8 | 1 | 0 | 0,00% | 1 | 100,00% | Registered |
| Constituency no. 10 | 1 | 0 | 0,00% | 1 | 100,00% | Registered |
| Constituency no. 11 | 2 | 1 | 50,00% | 1 | 50,00% | Registered |
| Constituency no. 12 | 1 | 0 | 0,00% | 1 | 100,00% | Registered |
| Totalling | 14 | 3 | 21,43% | 11 | 78,57% | |
| Age of the candidates | |||||
| Specification | Average age | Average age of women | Average age of men | Oldest | Youngest |
| Constituency no. 1 | 53 | - | 53 | 53 | 53 |
| Constituency no. 2 | 60 | 60 | - | 60 | 60 |
| Constituency no. 3 | 56 | - | 56 | 56 | 56 |
| Constituency no. 4 | 51 | - | 51 | 51 | 51 |
| Constituency no. 5 | 50 | - | 50 | 50 | 50 |
| Constituency no. 6 | 40 | 39 | 40 | 40 | 39 |
| Constituency no. 7 | 54 | - | 54 | 54 | 54 |
| Constituency no. 8 | 48 | - | 48 | 48 | 48 |
| Constituency no. 10 | 40 | - | 40 | 40 | 40 |
| Constituency no. 11 | 49 | 53 | 45 | 53 | 45 |
| Constituency no. 12 | 47 | - | 47 | 47 | 47 |
| The statistics of election committe |
| Lists submitted | ||
| Specification | Number of | |
| lists | councils | |
| Lists registered for communal councils | 11 | 1 |
| Totalling | 11 | 1 |
| Submitted candidates | |||||
| Specification | Number of candidates | Women | Women (%) | Men | Men (%) |
| Number of candidates registered for communal councils | 14 | 3 | 21,43% | 11 | 78,57% |
| Number of candidates submitted for reeve, mayor and presidential elections | 1 | 0 | 0,00% | 1 | 100,00% |
| Totalling | 15 | 3 | 20,00% | 12 | 80,00% |
| Average age of submitted candidates | |||
| Specification | Average age | Average age of women | Average age of men |
| Average age of candidates submitted for communal councils | 49 | 51 | 49 |
| Average age of candidates for reeve, mayor, president | 53 | - | 53 |
| Totalling | 49 | 51 | 49 |
| Submitted candidates for councils grouped by age | |||||
| Age | Number of candidates | Women | Women (%) | Men | Men (%) |
| 18-29 | 0 | 0 | - | 0 | - |
| 30-39 | 1 | 1 | 100,00% | 0 | 0,00% |
| 40-59 | 12 | 1 | 8,33% | 11 | 91,67% |
| 60+ | 1 | 1 | 100,00% | 0 | 0,00% |
| Totalling | 14 | 3 | 21,43% | 11 | 78,57% |
| Submitted candidates for reeve, mayor, president grouped by age | |||||
| Age | Number of candidates | Women | Women (%) | Men | Men (%) |
| 25-29 | 0 | 0 | - | 0 | - |
| 30-39 | 0 | 0 | - | 0 | - |
| 40-59 | 1 | 0 | 0,00% | 1 | 100,00% |
| 60+ | 0 | 0 | - | 0 | - |
| Totalling | 1 | 0 | 0,00% | 1 | 100,00% |
| The youngest and oldest submitted candidate for councils | ||
| Age | Institution | |
| Youngest | 39 | Rada Gminy Bircza |
| Oldest | 60 | Rada Gminy Bircza |
| The youngest and oldest submitted candidate for reeve, mayor, president | ||
| Age | Institution | |
| Youngest | 53 | Wójt Gminy Bircza |
| Oldest | 53 | Wójt Gminy Bircza |
| Rada Gminy Dubiecko |
| Submitted candidates | ||||||
| Specification | Number of candidates | Women | Women (%) | Men | Men (%) | Status |
| Constituency no. 1 | 1 | 0 | 0,00% | 1 | 100,00% | Registered |
| Constituency no. 2 | 1 | 1 | 100,00% | 0 | 0,00% | Registered |
| Constituency no. 3 | 1 | 0 | 0,00% | 1 | 100,00% | Registered |
| Constituency no. 5 | 1 | 0 | 0,00% | 1 | 100,00% | Registered |
| Constituency no. 7 | 2 | 0 | 0,00% | 2 | 100,00% | Registered |
| Constituency no. 8 | 1 | 0 | 0,00% | 1 | 100,00% | Registered |
| Constituency no. 11 | 1 | 0 | 0,00% | 1 | 100,00% | Registered |
| Totalling | 8 | 1 | 12,50% | 7 | 87,50% | |
| Age of the candidates | |||||
| Specification | Average age | Average age of women | Average age of men | Oldest | Youngest |
| Constituency no. 1 | 51 | - | 51 | 51 | 51 |
| Constituency no. 2 | 40 | 40 | - | 40 | 40 |
| Constituency no. 3 | 52 | - | 52 | 52 | 52 |
| Constituency no. 5 | 60 | - | 60 | 60 | 60 |
| Constituency no. 7 | 47 | - | 47 | 59 | 35 |
| Constituency no. 8 | 58 | - | 58 | 58 | 58 |
| Constituency no. 11 | 35 | - | 35 | 35 | 35 |
| The statistics of election committe |
| Lists submitted | ||
| Specification | Number of | |
| lists | councils | |
| Lists registered for communal councils | 7 | 1 |
| Totalling | 7 | 1 |
| Submitted candidates | |||||
| Specification | Number of candidates | Women | Women (%) | Men | Men (%) |
| Number of candidates registered for communal councils | 8 | 1 | 12,50% | 7 | 87,50% |
| Number of candidates submitted for reeve, mayor and presidential elections | 0 | 0 | - | 0 | - |
| Totalling | 8 | 1 | 12,50% | 7 | 87,50% |
| Average age of submitted candidates | |||
| Specification | Average age | Average age of women | Average age of men |
| Average age of candidates submitted for communal councils | 49 | 40 | 50 |
| Average age of candidates for reeve, mayor, president | - | - | - |
| Totalling | 49 | 40 | 50 |
| Submitted candidates for councils grouped by age | |||||
| Age | Number of candidates | Women | Women (%) | Men | Men (%) |
| 18-29 | 0 | 0 | - | 0 | - |
| 30-39 | 2 | 0 | 0,00% | 2 | 100,00% |
| 40-59 | 5 | 1 | 20,00% | 4 | 80,00% |
| 60+ | 1 | 0 | 0,00% | 1 | 100,00% |
| Totalling | 8 | 1 | 12,50% | 7 | 87,50% |
| Submitted candidates for reeve, mayor, president grouped by age | |||||
| Age | Number of candidates | Women | Women (%) | Men | Men (%) |
| 25-29 | 0 | 0 | - | 0 | - |
| 30-39 | 0 | 0 | - | 0 | - |
| 40-59 | 0 | 0 | - | 0 | - |
| 60+ | 0 | 0 | - | 0 | - |
| Totalling | 0 | 0 | - | 0 | - |
| The youngest and oldest submitted candidate for councils | ||
| Age | Institution | |
| Youngest | 35 | Rada Gminy Dubiecko |
| Oldest | 60 | Rada Gminy Dubiecko |
| Rada Gminy Krasiczyn |
| Submitted candidates | ||||||
| Specification | Number of candidates | Women | Women (%) | Men | Men (%) | Status |
| Constituency no. 1 | 1 | 0 | 0,00% | 1 | 100,00% | Registered |
| Constituency no. 5 | 1 | 1 | 100,00% | 0 | 0,00% | Registered |
| Constituency no. 6 | 1 | 1 | 100,00% | 0 | 0,00% | Registered |
| Totalling | 3 | 2 | 66,67% | 1 | 33,33% | |
| Age of the candidates | |||||
| Specification | Average age | Average age of women | Average age of men | Oldest | Youngest |
| Constituency no. 1 | 54 | - | 54 | 54 | 54 |
| Constituency no. 5 | 29 | 29 | - | 29 | 29 |
| Constituency no. 6 | 56 | 56 | - | 56 | 56 |
| The statistics of election committe |
| Lists submitted | ||
| Specification | Number of | |
| lists | councils | |
| Lists registered for communal councils | 3 | 1 |
| Totalling | 3 | 1 |
| Submitted candidates | |||||
| Specification | Number of candidates | Women | Women (%) | Men | Men (%) |
| Number of candidates registered for communal councils | 3 | 2 | 66,67% | 1 | 33,33% |
| Number of candidates submitted for reeve, mayor and presidential elections | 0 | 0 | - | 0 | - |
| Totalling | 3 | 2 | 66,67% | 1 | 33,33% |
| Average age of submitted candidates | |||
| Specification | Average age | Average age of women | Average age of men |
| Average age of candidates submitted for communal councils | 46 | 43 | 54 |
| Average age of candidates for reeve, mayor, president | - | - | - |
| Totalling | 46 | 43 | 54 |
| Submitted candidates for councils grouped by age | |||||
| Age | Number of candidates | Women | Women (%) | Men | Men (%) |
| 18-29 | 1 | 1 | 100,00% | 0 | 0,00% |
| 30-39 | 0 | 0 | - | 0 | - |
| 40-59 | 2 | 1 | 50,00% | 1 | 50,00% |
| 60+ | 0 | 0 | - | 0 | - |
| Totalling | 3 | 2 | 66,67% | 1 | 33,33% |
| Submitted candidates for reeve, mayor, president grouped by age | |||||
| Age | Number of candidates | Women | Women (%) | Men | Men (%) |
| 25-29 | 0 | 0 | - | 0 | - |
| 30-39 | 0 | 0 | - | 0 | - |
| 40-59 | 0 | 0 | - | 0 | - |
| 60+ | 0 | 0 | - | 0 | - |
| Totalling | 0 | 0 | - | 0 | - |
| The youngest and oldest submitted candidate for councils | ||
| Age | Institution | |
| Youngest | 29 | Rada Gminy Krasiczyn |
| Oldest | 56 | Rada Gminy Krasiczyn |
| Rada Gminy Orły |
| Submitted candidates | ||||||
| Specification | Number of candidates | Women | Women (%) | Men | Men (%) | Status |
| Constituency no. 5 | 1 | 1 | 100,00% | 0 | 0,00% | Registered |
| Totalling | 1 | 1 | 100,00% | 0 | 0,00% | |
| Age of the candidates | |||||
| Specification | Average age | Average age of women | Average age of men | Oldest | Youngest |
| Constituency no. 5 | 33 | 33 | - | 33 | 33 |
| The statistics of election committe |
| Lists submitted | ||
| Specification | Number of | |
| lists | councils | |
| Lists registered for communal councils | 1 | 1 |
| Totalling | 1 | 1 |
| Submitted candidates | |||||
| Specification | Number of candidates | Women | Women (%) | Men | Men (%) |
| Number of candidates registered for communal councils | 1 | 1 | 100,00% | 0 | 0,00% |
| Number of candidates submitted for reeve, mayor and presidential elections | 0 | 0 | - | 0 | - |
| Totalling | 1 | 1 | 100,00% | 0 | 0,00% |
| Average age of submitted candidates | |||
| Specification | Average age | Average age of women | Average age of men |
| Average age of candidates submitted for communal councils | 33 | 33 | - |
| Average age of candidates for reeve, mayor, president | - | - | - |
| Totalling | 33 | 33 | - |
| Submitted candidates for councils grouped by age | |||||
| Age | Number of candidates | Women | Women (%) | Men | Men (%) |
| 18-29 | 0 | 0 | - | 0 | - |
| 30-39 | 1 | 1 | 100,00% | 0 | 0,00% |
| 40-59 | 0 | 0 | - | 0 | - |
| 60+ | 0 | 0 | - | 0 | - |
| Totalling | 1 | 1 | 100,00% | 0 | 0,00% |
| Submitted candidates for reeve, mayor, president grouped by age | |||||
| Age | Number of candidates | Women | Women (%) | Men | Men (%) |
| 25-29 | 0 | 0 | - | 0 | - |
| 30-39 | 0 | 0 | - | 0 | - |
| 40-59 | 0 | 0 | - | 0 | - |
| 60+ | 0 | 0 | - | 0 | - |
| Totalling | 0 | 0 | - | 0 | - |
| The youngest and oldest submitted candidate for councils | ||
| Age | Institution | |
| Youngest | 33 | Rada Gminy Orły |
| Oldest | 33 | Rada Gminy Orły |
| Rada Gminy Przemyśl |
| Submitted candidates | ||||||
| Specification | Number of candidates | Women | Women (%) | Men | Men (%) | Status |
| Constituency no. 6 | 1 | 0 | 0,00% | 1 | 100,00% | Registered |
| Constituency no. 8 | 3 | 3 | 100,00% | 0 | 0,00% | Registered |
| Totalling | 4 | 3 | 75,00% | 1 | 25,00% | |
| Age of the candidates | |||||
| Specification | Average age | Average age of women | Average age of men | Oldest | Youngest |
| Constituency no. 6 | 63 | - | 63 | 63 | 63 |
| Constituency no. 8 | 49 | 49 | - | 59 | 40 |
| The statistics of election committe |
| Lists submitted | ||
| Specification | Number of | |
| lists | councils | |
| Lists registered for communal councils | 2 | 1 |
| Totalling | 2 | 1 |
| Submitted candidates | |||||
| Specification | Number of candidates | Women | Women (%) | Men | Men (%) |
| Number of candidates registered for communal councils | 4 | 3 | 75,00% | 1 | 25,00% |
| Number of candidates submitted for reeve, mayor and presidential elections | 0 | 0 | - | 0 | - |
| Totalling | 4 | 3 | 75,00% | 1 | 25,00% |
| Average age of submitted candidates | |||
| Specification | Average age | Average age of women | Average age of men |
| Average age of candidates submitted for communal councils | 52 | 49 | 63 |
| Average age of candidates for reeve, mayor, president | - | - | - |
| Totalling | 52 | 49 | 63 |
| Submitted candidates for councils grouped by age | |||||
| Age | Number of candidates | Women | Women (%) | Men | Men (%) |
| 18-29 | 0 | 0 | - | 0 | - |
| 30-39 | 0 | 0 | - | 0 | - |
| 40-59 | 3 | 3 | 100,00% | 0 | 0,00% |
| 60+ | 1 | 0 | 0,00% | 1 | 100,00% |
| Totalling | 4 | 3 | 75,00% | 1 | 25,00% |
| Submitted candidates for reeve, mayor, president grouped by age | |||||
| Age | Number of candidates | Women | Women (%) | Men | Men (%) |
| 25-29 | 0 | 0 | - | 0 | - |
| 30-39 | 0 | 0 | - | 0 | - |
| 40-59 | 0 | 0 | - | 0 | - |
| 60+ | 0 | 0 | - | 0 | - |
| Totalling | 0 | 0 | - | 0 | - |
| The youngest and oldest submitted candidate for councils | ||
| Age | Institution | |
| Youngest | 40 | Rada Gminy Przemyśl |
| Oldest | 63 | Rada Gminy Przemyśl |
