

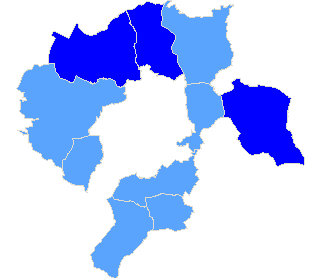
pow. bielski
| Rada Powiatu Bielskiego z siedzibą władz w Bielsku - Białej |
| Submitted candidates | ||||||
| Specification | Number of candidates | Women | Women (%) | Men | Men (%) | Status |
| Constituency no. 1 | 8 | 3 | 37,50% | 5 | 62,50% | Registered |
| Constituency no. 2 | 8 | 2 | 25,00% | 6 | 75,00% | Registered |
| Constituency no. 3 | 15 | 4 | 26,67% | 11 | 73,33% | Registered |
| Constituency no. 4 | 9 | 2 | 22,22% | 7 | 77,78% | Registered |
| Constituency no. 5 | 7 | 0 | 0,00% | 7 | 100,00% | Registered |
| Totalling | 47 | 11 | 23,40% | 36 | 76,60% | |
| Age of the candidates | |||||
| Specification | Average age | Average age of women | Average age of men | Oldest | Youngest |
| Constituency no. 1 | 50 | 48 | 50 | 56 | 40 |
| Constituency no. 2 | 51 | 53 | 51 | 61 | 36 |
| Constituency no. 3 | 48 | 51 | 47 | 65 | 19 |
| Constituency no. 4 | 46 | 53 | 44 | 56 | 30 |
| Constituency no. 5 | 51 | - | 51 | 58 | 38 |
| The statistics of election committe |
| Lists submitted | ||
| Specification | Number of | |
| lists | councils | |
| Lists submitted for county councils | 5 | 1 |
| Lists registered for communal councils | 13 | 3 |
| Totalling | 18 | 4 |
| Submitted candidates | |||||
| Specification | Number of candidates | Women | Women (%) | Men | Men (%) |
| Number of candidates submitted for county councils | 47 | 11 | 23,40% | 36 | 76.60% |
| Number of candidates registered for communal councils | 60 | 11 | 18,33% | 49 | 81.67% |
| Number of candidates submitted for reeve, mayor and presidential elections | 2 | 0 | 0,00% | 2 | 100.00% |
| Totalling | 109 | 22 | 20,18% | 87 | 79,82% |
| Average age of submitted candidates | |||
| Specification | Average age | Average age of women | Average age of men |
| Average age of candidates submitted for county councils | 49 | 51 | 48 |
| Average age of candidates submitted for communal councils | 47 | 51 | 46 |
| Average age of candidates for reeve, mayor, president | 52 | - | 52 |
| Totalling | 47 | 51 | 46 |
| Submitted candidates for councils grouped by age | |||||
| Age | Number of candidates | Women | Women (%) | Men | Men (%) |
| 18-29 | 5 | 0 | 0,00% | 5 | 100,00% |
| 30-39 | 15 | 1 | 6,67% | 14 | 93,33% |
| 40-59 | 75 | 18 | 24,00% | 57 | 76,00% |
| 60+ | 12 | 3 | 25,00% | 9 | 75,00% |
| Totalling | 107 | 22 | 20,56% | 85 | 79,44% |
| Submitted candidates for reeve, mayor, president grouped by age | |||||
| Age | Number of candidates | Women | Women (%) | Men | Men (%) |
| 25-29 | 0 | 0 | - | 0 | - |
| 30-39 | 0 | 0 | - | 0 | - |
| 40-59 | 2 | 0 | 0,00% | 2 | 100,00% |
| 60+ | 0 | 0 | - | 0 | - |
| Totalling | 2 | 0 | 0,00% | 2 | 100,00% |
| The youngest and oldest submitted candidate for councils | ||
| Age | Institution | |
| Youngest | 19 | Rada Powiatu Bielskiego z siedzibą władz w Bielsku - Białej |
| Oldest | 70 | Rada Miejska w Czechowicach-Dziedzicach |
| The youngest and oldest submitted candidate for reeve, mayor, president | ||
| Age | Institution | |
| Youngest | 51 | Burmistrz Miasta Czechowic-Dziedzic |
| Oldest | 54 | Wójt Gminy Porąbka |
| Rada Gminy Bestwina |
| Submitted candidates | ||||||
| Specification | Number of candidates | Women | Women (%) | Men | Men (%) | Status |
| Constituency no. 1 | 1 | 0 | 0,00% | 1 | 100,00% | Registered |
| Constituency no. 2 | 1 | 0 | 0,00% | 1 | 100,00% | Registered |
| Constituency no. 3 | 1 | 0 | 0,00% | 1 | 100,00% | Registered |
| Constituency no. 4 | 1 | 1 | 100,00% | 0 | 0,00% | Registered |
| Constituency no. 5 | 1 | 0 | 0,00% | 1 | 100,00% | Registered |
| Totalling | 5 | 1 | 20,00% | 4 | 80,00% | |
| Age of the candidates | |||||
| Specification | Average age | Average age of women | Average age of men | Oldest | Youngest |
| Constituency no. 1 | 52 | - | 52 | 52 | 52 |
| Constituency no. 2 | 63 | - | 63 | 63 | 63 |
| Constituency no. 3 | 42 | - | 42 | 42 | 42 |
| Constituency no. 4 | 56 | 56 | - | 56 | 56 |
| Constituency no. 5 | 62 | - | 62 | 62 | 62 |
| The statistics of election committe |
| Lists submitted | ||
| Specification | Number of | |
| lists | councils | |
| Lists registered for communal councils | 5 | 1 |
| Totalling | 5 | 1 |
| Submitted candidates | |||||
| Specification | Number of candidates | Women | Women (%) | Men | Men (%) |
| Number of candidates registered for communal councils | 5 | 1 | 20,00% | 4 | 80,00% |
| Number of candidates submitted for reeve, mayor and presidential elections | 0 | 0 | - | 0 | - |
| Totalling | 5 | 1 | 20,00% | 4 | 80,00% |
| Average age of submitted candidates | |||
| Specification | Average age | Average age of women | Average age of men |
| Average age of candidates submitted for communal councils | 55 | 56 | 55 |
| Average age of candidates for reeve, mayor, president | - | - | - |
| Totalling | 55 | 56 | 55 |
| Submitted candidates for councils grouped by age | |||||
| Age | Number of candidates | Women | Women (%) | Men | Men (%) |
| 18-29 | 0 | 0 | - | 0 | - |
| 30-39 | 0 | 0 | - | 0 | - |
| 40-59 | 3 | 1 | 33,33% | 2 | 66,67% |
| 60+ | 2 | 0 | 0,00% | 2 | 100,00% |
| Totalling | 5 | 1 | 20,00% | 4 | 80,00% |
| Submitted candidates for reeve, mayor, president grouped by age | |||||
| Age | Number of candidates | Women | Women (%) | Men | Men (%) |
| 25-29 | 0 | 0 | - | 0 | - |
| 30-39 | 0 | 0 | - | 0 | - |
| 40-59 | 0 | 0 | - | 0 | - |
| 60+ | 0 | 0 | - | 0 | - |
| Totalling | 0 | 0 | - | 0 | - |
| The youngest and oldest submitted candidate for councils | ||
| Age | Institution | |
| Youngest | 42 | Rada Gminy Bestwina |
| Oldest | 63 | Rada Gminy Bestwina |
| Wójt Gminy Porąbka |
| Number of | Family name and given names | Age | Education | Address, party membership and endorsements |
| 1 | Bułka Czesław | 54 | wyższe | Porąbka, submitted by KOMITET WYBORCZY WYBORCÓW RODZINA PRAWO WSPÓLNOTA, not a member of any political party |
| Rada Gminy Porąbka |
| Submitted candidates | ||||||
| Specification | Number of candidates | Women | Women (%) | Men | Men (%) | Status |
| Constituency no. 1 | 2 | 0 | 0,00% | 2 | 100,00% | Registered |
| Constituency no. 2 | 3 | 0 | 0,00% | 3 | 100,00% | Registered |
| Constituency no. 3 | 3 | 1 | 33,33% | 2 | 66,67% | Registered |
| Constituency no. 4 | 3 | 1 | 33,33% | 2 | 66,67% | Registered |
| Constituency no. 5 | 4 | 0 | 0,00% | 4 | 100,00% | Registered |
| Totalling | 15 | 2 | 13,33% | 13 | 86,67% | |
| Age of the candidates | |||||
| Specification | Average age | Average age of women | Average age of men | Oldest | Youngest |
| Constituency no. 1 | 54 | - | 54 | 55 | 53 |
| Constituency no. 2 | 45 | - | 45 | 54 | 35 |
| Constituency no. 3 | 45 | 56 | 40 | 56 | 32 |
| Constituency no. 4 | 59 | 61 | 58 | 65 | 51 |
| Constituency no. 5 | 50 | - | 50 | 58 | 37 |
| The statistics of election committe |
| Lists submitted | ||
| Specification | Number of | |
| lists | councils | |
| Lists registered for communal councils | 5 | 1 |
| Totalling | 5 | 1 |
| Submitted candidates | |||||
| Specification | Number of candidates | Women | Women (%) | Men | Men (%) |
| Number of candidates registered for communal councils | 15 | 2 | 13,33% | 13 | 86,67% |
| Number of candidates submitted for reeve, mayor and presidential elections | 1 | 0 | 0,00% | 1 | 100,00% |
| Totalling | 16 | 2 | 12,50% | 14 | 87,50% |
| Average age of submitted candidates | |||
| Specification | Average age | Average age of women | Average age of men |
| Average age of candidates submitted for communal councils | 50 | 59 | 49 |
| Average age of candidates for reeve, mayor, president | 54 | - | 54 |
| Totalling | 50 | 59 | 49 |
| Submitted candidates for councils grouped by age | |||||
| Age | Number of candidates | Women | Women (%) | Men | Men (%) |
| 18-29 | 0 | 0 | - | 0 | - |
| 30-39 | 3 | 0 | 0,00% | 3 | 100,00% |
| 40-59 | 10 | 1 | 10,00% | 9 | 90,00% |
| 60+ | 2 | 1 | 50,00% | 1 | 50,00% |
| Totalling | 15 | 2 | 13,33% | 13 | 86,67% |
| Submitted candidates for reeve, mayor, president grouped by age | |||||
| Age | Number of candidates | Women | Women (%) | Men | Men (%) |
| 25-29 | 0 | 0 | - | 0 | - |
| 30-39 | 0 | 0 | - | 0 | - |
| 40-59 | 1 | 0 | 0,00% | 1 | 100,00% |
| 60+ | 0 | 0 | - | 0 | - |
| Totalling | 1 | 0 | 0,00% | 1 | 100,00% |
| The youngest and oldest submitted candidate for councils | ||
| Age | Institution | |
| Youngest | 32 | Rada Gminy Porąbka |
| Oldest | 65 | Rada Gminy Porąbka |
| The youngest and oldest submitted candidate for reeve, mayor, president | ||
| Age | Institution | |
| Youngest | 54 | Wójt Gminy Porąbka |
| Oldest | 54 | Wójt Gminy Porąbka |
| Burmistrz Miasta Czechowic-Dziedzic |
| Number of | Family name and given names | Age | Education | Address, party membership and endorsements |
| 2 | Kwaśny Marek Jerzy | 51 | wyższe | Czechowice-Dziedzice, submitted by KOMITET WYBORCZY WYBORCÓW RODZINA PRAWO WSPÓLNOTA, not a member of any political party |
| Rada Miejska w Czechowicach-Dziedzicach |
| Submitted candidates | ||||||
| Specification | Number of candidates | Women | Women (%) | Men | Men (%) | Status |
| Constituency no. 1 | 14 | 5 | 35,71% | 9 | 64,29% | Registered |
| Constituency no. 2 | 16 | 2 | 12,50% | 14 | 87,50% | Registered |
| Constituency no. 3 | 10 | 1 | 10,00% | 9 | 90,00% | Registered |
| Totalling | 40 | 8 | 20,00% | 32 | 80,00% | |
| Age of the candidates | |||||
| Specification | Average age | Average age of women | Average age of men | Oldest | Youngest |
| Constituency no. 1 | 44 | 50 | 40 | 64 | 23 |
| Constituency no. 2 | 49 | 43 | 50 | 70 | 29 |
| Constituency no. 3 | 44 | 57 | 42 | 57 | 28 |
| The statistics of election committe |
| Lists submitted | ||
| Specification | Number of | |
| lists | councils | |
| Lists registered for communal councils | 3 | 1 |
| Totalling | 3 | 1 |
| Submitted candidates | |||||
| Specification | Number of candidates | Women | Women (%) | Men | Men (%) |
| Number of candidates registered for communal councils | 40 | 8 | 20,00% | 32 | 80,00% |
| Number of candidates submitted for reeve, mayor and presidential elections | 1 | 0 | 0,00% | 1 | 100,00% |
| Totalling | 41 | 8 | 19,51% | 33 | 80,49% |
| Average age of submitted candidates | |||
| Specification | Average age | Average age of women | Average age of men |
| Average age of candidates submitted for communal councils | 46 | 49 | 45 |
| Average age of candidates for reeve, mayor, president | 51 | - | 51 |
| Totalling | 46 | 49 | 45 |
| Submitted candidates for councils grouped by age | |||||
| Age | Number of candidates | Women | Women (%) | Men | Men (%) |
| 18-29 | 4 | 0 | 0,00% | 4 | 100,00% |
| 30-39 | 6 | 1 | 16,67% | 5 | 83,33% |
| 40-59 | 26 | 6 | 23,08% | 20 | 76,92% |
| 60+ | 4 | 1 | 25,00% | 3 | 75,00% |
| Totalling | 40 | 8 | 20,00% | 32 | 80,00% |
| Submitted candidates for reeve, mayor, president grouped by age | |||||
| Age | Number of candidates | Women | Women (%) | Men | Men (%) |
| 25-29 | 0 | 0 | - | 0 | - |
| 30-39 | 0 | 0 | - | 0 | - |
| 40-59 | 1 | 0 | 0,00% | 1 | 100,00% |
| 60+ | 0 | 0 | - | 0 | - |
| Totalling | 1 | 0 | 0,00% | 1 | 100,00% |
| The youngest and oldest submitted candidate for councils | ||
| Age | Institution | |
| Youngest | 23 | Rada Miejska w Czechowicach-Dziedzicach |
| Oldest | 70 | Rada Miejska w Czechowicach-Dziedzicach |
| The youngest and oldest submitted candidate for reeve, mayor, president | ||
| Age | Institution | |
| Youngest | 51 | Burmistrz Miasta Czechowic-Dziedzic |
| Oldest | 51 | Burmistrz Miasta Czechowic-Dziedzic |
