
| KOMITET WYBORCZY WYBORCÓW PRACA I SAMORZĄDNOŚĆ | |
| Specification | KOMITET WYBORCZY WYBORCÓW PRACA I SAMORZĄDNOŚĆ |
| Short name: | KWW PRACA I SAMORZĄDNOŚĆ |
| Type of committee: | Election committees established by electors |
| Address: | ul. Sienkiewicza 60a m. 13, 42-400 Zawiercie |
| Electoral plenipotentiary: | Krzysztof Ireneusz Koclęga |
| Financial plenipotentiary: | Elżbieta Furgacz |

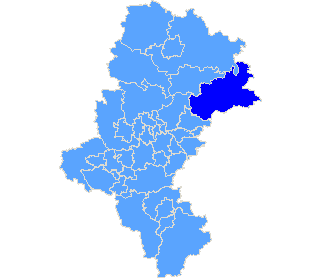
Province śląskie
| County list |
| Specification |
| pow. zawierciański |
| The statistics of election committe |
| Lists submitted | ||
| Specification | Number of | |
| lists | councils | |
| Lists submitted for province council | 0 | 0 |
| Lists submitted for county councils | 7 | 1 |
| Lists submitted for councils of cities holding county rights | 0 | 0 |
| Lists registered for communal councils | 8 | 5 |
| Totalling | 15 | 6 |
| Submitted candidates | |||||
| Specification | Number of candidates | Women | Women (%) | Men | Men (%) |
| Number of candidates submitted for the province council | 0 | 0 | - | 0 | - |
| Number of candidates submitted for county councils | 47 | 21 | 44,68% | 26 | 55,32% |
| Number of candidates submitted for councils of cities holding county rights | 0 | 0 | - | 0 | - |
| Number of candidates registered for communal councils | 48 | 22 | 45,83% | 26 | 54.17 |
| Number of candidates submitted for reeve, mayor and presidential elections | 1 | 1 | 100,00% | 0 | 0,00% |
| Totalling | 96 | 44 | 45,83% | 52 | 54,17% |
| Average age of submitted candidates | |||
| Specification | Average age | Average age of women | Average age of men |
| Average age of candidates submitted for the province council | - | - | - |
| Average age of candidates submitted for county councils | 43 | 48 | 39 |
| Average age of candidates for councils of cities holding county rights | - | - | - |
| Average age of candidates submitted for communal councils | 45 | 48 | 43 |
| Average age of candidates for reeve, mayor, president | 52 | 52 | - |
| Totalling | 44 | 48 | 41 |
| Submitted candidates for councils grouped by age | |||||
| Age | Number of candidates | Women | Women (%) | Men | Men (%) |
| 18-29 | 16 | 2 | 12,50% | 14 | 87,50% |
| 30-39 | 8 | 1 | 12,50% | 7 | 87,50% |
| 40-59 | 69 | 39 | 56,52% | 30 | 43,48% |
| 60+ | 2 | 1 | 50,00% | 1 | 50,00% |
| Totalling | 95 | 43 | 45,26% | 52 | 54,74% |
| Submitted candidates for reeve, mayor, president grouped by age | |||||
| Age | Number of candidates | Women | Women (%) | Men | Men (%) |
| 25-29 | 0 | 0 | - | 0 | - |
| 30-39 | 0 | 0 | - | 0 | - |
| 40-59 | 1 | 1 | 100,00% | 0 | 0,00% |
| 60+ | 0 | 0 | - | 0 | - |
| Totalling | 1 | 1 | 100,00% | 0 | 0,00% |
| The youngest and oldest submitted candidate for councils | ||
| Age | Institution | |
| Youngest | 20 | Rada Miejska w Zawierciu |
| Oldest | 65 | Rada Miejska w Zawierciu |
| The youngest and oldest submitted candidate for reeve, mayor, president | ||
| Age | Institution | |
| Youngest | 52 | Prezydent Miasta Zawiercie |
| Oldest | 52 | Prezydent Miasta Zawiercie |
| Copyright © 2010 PKW | helpdesk@poczta.kbw.gov.pl | Author: Dituel Sp. z o.o. |  |
Website last modified on: 09-12-2010 18:39:23 |