
| KOMITET WYBORCZY WYBORCÓW PIŃCZOWSKIE POROZUMIENIE SPOŁECZNE | |
| Specification | KOMITET WYBORCZY WYBORCÓW PIŃCZOWSKIE POROZUMIENIE SPOŁECZNE |
| Short name: | KWW PIŃCZOWSKIE POROZUMIENIE SPOŁECZNE |
| Type of committee: | Election committees established by electors |
| Address: | ul. Zakościele 1, Bogucice I, 28-400 Pińczów |
| Electoral plenipotentiary: | Grzegorz Stanisław Urban |
| Financial plenipotentiary: | Anita Maria Pawłowska |

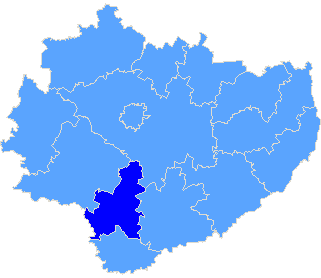
Province świętokrzyskie
| County list |
| Specification |
| pow. pińczowski |
| The statistics of election committe |
| Lists submitted | ||
| Specification | Number of | |
| lists | councils | |
| Lists submitted for province council | 0 | 0 |
| Lists submitted for county councils | 2 | 1 |
| Lists submitted for councils of cities holding county rights | 0 | 0 |
| Lists registered for communal councils | 4 | 1 |
| Totalling | 6 | 2 |
| Submitted candidates | |||||
| Specification | Number of candidates | Women | Women (%) | Men | Men (%) |
| Number of candidates submitted for the province council | 0 | 0 | - | 0 | - |
| Number of candidates submitted for county councils | 21 | 9 | 42,86% | 12 | 57,14% |
| Number of candidates submitted for councils of cities holding county rights | 0 | 0 | - | 0 | - |
| Number of candidates registered for communal councils | 30 | 9 | 30,00% | 21 | 70.00 |
| Number of candidates submitted for reeve, mayor and presidential elections | 1 | 0 | 0,00% | 1 | 100,00% |
| Totalling | 52 | 18 | 34,62% | 34 | 65,38% |
| Average age of submitted candidates | |||
| Specification | Average age | Average age of women | Average age of men |
| Average age of candidates submitted for the province council | - | - | - |
| Average age of candidates submitted for county councils | 43 | 40 | 45 |
| Average age of candidates for councils of cities holding county rights | - | - | - |
| Average age of candidates submitted for communal councils | 43 | 40 | 45 |
| Average age of candidates for reeve, mayor, president | 47 | - | 47 |
| Totalling | 43 | 40 | 45 |
| Submitted candidates for councils grouped by age | |||||
| Age | Number of candidates | Women | Women (%) | Men | Men (%) |
| 18-29 | 7 | 3 | 42,86% | 4 | 57,14% |
| 30-39 | 9 | 6 | 66,67% | 3 | 33,33% |
| 40-59 | 34 | 9 | 26,47% | 25 | 73,53% |
| 60+ | 1 | 0 | 0,00% | 1 | 100,00% |
| Totalling | 51 | 18 | 35,29% | 33 | 64,71% |
| Submitted candidates for reeve, mayor, president grouped by age | |||||
| Age | Number of candidates | Women | Women (%) | Men | Men (%) |
| 25-29 | 0 | 0 | - | 0 | - |
| 30-39 | 0 | 0 | - | 0 | - |
| 40-59 | 1 | 0 | 0,00% | 1 | 100,00% |
| 60+ | 0 | 0 | - | 0 | - |
| Totalling | 1 | 0 | 0,00% | 1 | 100,00% |
| The youngest and oldest submitted candidate for councils | ||
| Age | Institution | |
| Youngest | 22 | Rada Miasta Pińczów |
| Oldest | 63 | Rada Miasta Pińczów |
| The youngest and oldest submitted candidate for reeve, mayor, president | ||
| Age | Institution | |
| Youngest | 47 | Burmistrz Miasta i Gminy Pińczów |
| Oldest | 47 | Burmistrz Miasta i Gminy Pińczów |
| Copyright © 2010 PKW | helpdesk@poczta.kbw.gov.pl | Author: Dituel Sp. z o.o. |  |
Website last modified on: 09-12-2010 18:39:23 |