| KOMITET WYBORCZY WYBORCÓW PRZYMIERZE SAMORZĄDOWE 2010 |
| Specification | KOMITET WYBORCZY WYBORCÓW PRZYMIERZE SAMORZĄDOWE 2010 |
| Short name: | KWW PRZYMIERZE SAMORZĄDOWE 2010 |
| Type of committee: | Election committees established by electors |
| Address: | ul. Żwirowa 29, 13-100, Nidzica |
| Electoral plenipotentiary: | Mirosław Dumiński |
| Financial plenipotentiary: | Małgorzata Szypulska |

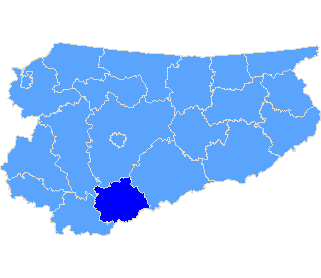
Province warmińsko-mazurskie
| The statistics of election committe |
| Lists submitted |
| Specification | Number of |
| lists | councils |
| Lists submitted for province council | 0 | 0 |
| Lists submitted for county councils | 1 | 1 |
| Lists submitted for councils of cities holding county rights | 0 | 0 |
| Lists registered for communal councils | 3 | 1 |
| Totalling | 4 | 2 |
| Submitted candidates |
| Specification | Number of candidates | Women | Women (%) | Men | Men (%) |
| Number of candidates submitted for the province council | 0 | 0 | - | 0 | - |
| Number of candidates submitted for county councils | 17 | 5 | 29,41% | 12 | 70,59% |
| Number of candidates submitted for councils of cities holding county rights | 0 | 0 | - | 0 | - |
| Number of candidates registered for communal councils | 36 | 12 | 33,33% | 24 | 66.67 |
| Number of candidates submitted for reeve, mayor and presidential elections | 1 | 0 | 0,00% | 1 | 100,00% |
| Totalling | 54 | 17 | 31,48% | 37 | 68,52% |
| Average age of submitted candidates |
| Specification | Average age | Average age of women | Average age of men |
| Average age of candidates submitted for the province council | - | - | - |
| Average age of candidates submitted for county councils | 42 | 41 | 42 |
| Average age of candidates for councils of cities holding county rights | - | - | - |
| Average age of candidates submitted for communal councils | 45 | 49 | 43 |
| Average age of candidates for reeve, mayor, president | 46 | - | 46 |
| Totalling | 44 | 46 | 42 |
| Submitted candidates for councils grouped by age |
| Age | Number of candidates | Women | Women (%) | Men | Men (%) |
| 18-29 | 4 | 1 | 25,00% | 3 | 75,00% |
| 30-39 | 13 | 1 | 7,69% | 12 | 92,31% |
| 40-59 | 33 | 13 | 39,39% | 20 | 60,61% |
| 60+ | 3 | 2 | 66,67% | 1 | 33,33% |
| Totalling | 53 | 17 | 32,08% | 36 | 67,92% |
| Submitted candidates for reeve, mayor, president grouped by age |
| Age | Number of candidates | Women | Women (%) | Men | Men (%) |
| 25-29 | 0 | 0 | - | 0 | - |
| 30-39 | 0 | 0 | - | 0 | - |
| 40-59 | 1 | 0 | 0,00% | 1 | 100,00% |
| 60+ | 0 | 0 | - | 0 | - |
| Totalling | 1 | 0 | 0,00% | 1 | 100,00% |
| The youngest and oldest submitted candidate for councils |
| | Age | Institution |
| Youngest | 23 | Rada Miejska w Nidzicy |
| Oldest | 65 | Rada Miejska w Nidzicy |
| The youngest and oldest submitted candidate for reeve, mayor, president |
| | Age | Institution |
| Youngest | 46 | Burmistrz Miasta Nidzica |
| Oldest | 46 | Burmistrz Miasta Nidzica |

