

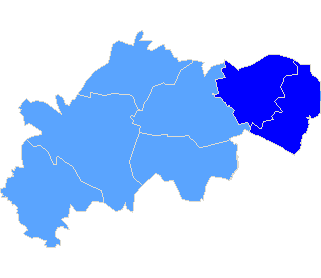
pow. ostrzeszowski
| The statistics of election committe |
| Lists submitted | ||
| Specification | Number of | |
| lists | councils | |
| Lists submitted for county councils | 0 | 0 |
| Lists registered for communal councils | 12 | 2 |
| Totalling | 12 | 2 |
| Submitted candidates | |||||
| Specification | Number of candidates | Women | Women (%) | Men | Men (%) |
| Number of candidates submitted for county councils | 0 | 0 | - | 0 | - |
| Number of candidates registered for communal councils | 17 | 11 | 64,71% | 6 | 35.29% |
| Number of candidates submitted for reeve, mayor and presidential elections | 1 | 1 | 100,00% | 0 | 0.00% |
| Totalling | 18 | 12 | 66,67% | 6 | 33,33% |
| Average age of submitted candidates | |||
| Specification | Average age | Average age of women | Average age of men |
| Average age of candidates submitted for county councils | - | - | - |
| Average age of candidates submitted for communal councils | 49 | 47 | 54 |
| Average age of candidates for reeve, mayor, president | 58 | 58 | - |
| Totalling | 49 | 47 | 54 |
| Submitted candidates for councils grouped by age | |||||
| Age | Number of candidates | Women | Women (%) | Men | Men (%) |
| 18-29 | 1 | 1 | 100,00% | 0 | 0,00% |
| 30-39 | 3 | 3 | 100,00% | 0 | 0,00% |
| 40-59 | 10 | 6 | 60,00% | 4 | 40,00% |
| 60+ | 3 | 1 | 33,33% | 2 | 66,67% |
| Totalling | 17 | 11 | 64,71% | 6 | 35,29% |
| Submitted candidates for reeve, mayor, president grouped by age | |||||
| Age | Number of candidates | Women | Women (%) | Men | Men (%) |
| 25-29 | 0 | 0 | - | 0 | - |
| 30-39 | 0 | 0 | - | 0 | - |
| 40-59 | 1 | 1 | 100,00% | 0 | 0,00% |
| 60+ | 0 | 0 | - | 0 | - |
| Totalling | 1 | 1 | 100,00% | 0 | 0,00% |
| The youngest and oldest submitted candidate for councils | ||
| Age | Institution | |
| Youngest | 27 | Rada Gminy Czajków |
| Oldest | 76 | Rada Gminy Czajków |
| The youngest and oldest submitted candidate for reeve, mayor, president | ||
| Age | Institution | |
| Youngest | 58 | Wójt Gminy Kraszewice |
| Oldest | 58 | Wójt Gminy Kraszewice |
| Rada Gminy Czajków |
| Submitted candidates | ||||||
| Specification | Number of candidates | Women | Women (%) | Men | Men (%) | Status |
| Constituency no. 1 | 1 | 1 | 100,00% | 0 | 0,00% | Registered |
| Constituency no. 5 | 1 | 1 | 100,00% | 0 | 0,00% | Registered |
| Totalling | 2 | 2 | 100,00% | 0 | 0,00% | |
| Age of the candidates | |||||
| Specification | Average age | Average age of women | Average age of men | Oldest | Youngest |
| Constituency no. 1 | 76 | 76 | - | 76 | 76 |
| Constituency no. 5 | 27 | 27 | - | 27 | 27 |
| The statistics of election committe |
| Lists submitted | ||
| Specification | Number of | |
| lists | councils | |
| Lists registered for communal councils | 2 | 1 |
| Totalling | 2 | 1 |
| Submitted candidates | |||||
| Specification | Number of candidates | Women | Women (%) | Men | Men (%) |
| Number of candidates registered for communal councils | 2 | 2 | 100,00% | 0 | 0,00% |
| Number of candidates submitted for reeve, mayor and presidential elections | 0 | 0 | - | 0 | - |
| Totalling | 2 | 2 | 100,00% | 0 | 0,00% |
| Average age of submitted candidates | |||
| Specification | Average age | Average age of women | Average age of men |
| Average age of candidates submitted for communal councils | 52 | 52 | - |
| Average age of candidates for reeve, mayor, president | - | - | - |
| Totalling | 52 | 52 | - |
| Submitted candidates for councils grouped by age | |||||
| Age | Number of candidates | Women | Women (%) | Men | Men (%) |
| 18-29 | 1 | 1 | 100,00% | 0 | 0,00% |
| 30-39 | 0 | 0 | - | 0 | - |
| 40-59 | 0 | 0 | - | 0 | - |
| 60+ | 1 | 1 | 100,00% | 0 | 0,00% |
| Totalling | 2 | 2 | 100,00% | 0 | 0,00% |
| Submitted candidates for reeve, mayor, president grouped by age | |||||
| Age | Number of candidates | Women | Women (%) | Men | Men (%) |
| 25-29 | 0 | 0 | - | 0 | - |
| 30-39 | 0 | 0 | - | 0 | - |
| 40-59 | 0 | 0 | - | 0 | - |
| 60+ | 0 | 0 | - | 0 | - |
| Totalling | 0 | 0 | - | 0 | - |
| The youngest and oldest submitted candidate for councils | ||
| Age | Institution | |
| Youngest | 27 | Rada Gminy Czajków |
| Oldest | 76 | Rada Gminy Czajków |
| Wójt Gminy Kraszewice |
| Number of | Family name and given names | Age | Education | Address, party membership and endorsements |
| 2 | Owczarek Barbara | 58 | średnie | Kuźnica Grabowska, submitted by KOMITET WYBORCZY "RUCH SAMORZĄDOWY IM. PROF. MARIANA FALSKIEGO W KUŹNICY GRABOWSKIEJ", not a member of any political party |
| Rada Gminy Kraszewice |
| Submitted candidates | ||||||
| Specification | Number of candidates | Women | Women (%) | Men | Men (%) | Status |
| Constituency no. 1 | 1 | 1 | 100,00% | 0 | 0,00% | Registered |
| Constituency no. 2 | 1 | 0 | 0,00% | 1 | 100,00% | Registered |
| Constituency no. 3 | 1 | 1 | 100,00% | 0 | 0,00% | Registered |
| Constituency no. 4 | 1 | 0 | 0,00% | 1 | 100,00% | Registered |
| Constituency no. 5 | 3 | 3 | 100,00% | 0 | 0,00% | Registered |
| Constituency no. 6 | 1 | 1 | 100,00% | 0 | 0,00% | Registered |
| Constituency no. 7 | 2 | 1 | 50,00% | 1 | 50,00% | Registered |
| Constituency no. 8 | 1 | 1 | 100,00% | 0 | 0,00% | Registered |
| Constituency no. 9 | 2 | 1 | 50,00% | 1 | 50,00% | Registered |
| Constituency no. 10 | 2 | 0 | 0,00% | 2 | 100,00% | Registered |
| Totalling | 15 | 9 | 60,00% | 6 | 40,00% | |
| Age of the candidates | |||||
| Specification | Average age | Average age of women | Average age of men | Oldest | Youngest |
| Constituency no. 1 | 30 | 30 | - | 30 | 30 |
| Constituency no. 2 | 50 | - | 50 | 50 | 50 |
| Constituency no. 3 | 58 | 58 | - | 58 | 58 |
| Constituency no. 4 | 42 | - | 42 | 42 | 42 |
| Constituency no. 5 | 44 | 44 | - | 58 | 34 |
| Constituency no. 6 | 57 | 57 | - | 57 | 57 |
| Constituency no. 7 | 57 | 52 | 61 | 61 | 52 |
| Constituency no. 8 | 38 | 38 | - | 38 | 38 |
| Constituency no. 9 | 45 | 43 | 46 | 46 | 43 |
| Constituency no. 10 | 64 | - | 64 | 73 | 54 |
| The statistics of election committe |
| Lists submitted | ||
| Specification | Number of | |
| lists | councils | |
| Lists registered for communal councils | 10 | 1 |
| Totalling | 10 | 1 |
| Submitted candidates | |||||
| Specification | Number of candidates | Women | Women (%) | Men | Men (%) |
| Number of candidates registered for communal councils | 15 | 9 | 60,00% | 6 | 40,00% |
| Number of candidates submitted for reeve, mayor and presidential elections | 1 | 1 | 100,00% | 0 | 0,00% |
| Totalling | 16 | 10 | 62,50% | 6 | 37,50% |
| Average age of submitted candidates | |||
| Specification | Average age | Average age of women | Average age of men |
| Average age of candidates submitted for communal councils | 49 | 46 | 54 |
| Average age of candidates for reeve, mayor, president | 58 | 58 | - |
| Totalling | 49 | 47 | 54 |
| Submitted candidates for councils grouped by age | |||||
| Age | Number of candidates | Women | Women (%) | Men | Men (%) |
| 18-29 | 0 | 0 | - | 0 | - |
| 30-39 | 3 | 3 | 100,00% | 0 | 0,00% |
| 40-59 | 10 | 6 | 60,00% | 4 | 40,00% |
| 60+ | 2 | 0 | 0,00% | 2 | 100,00% |
| Totalling | 15 | 9 | 60,00% | 6 | 40,00% |
| Submitted candidates for reeve, mayor, president grouped by age | |||||
| Age | Number of candidates | Women | Women (%) | Men | Men (%) |
| 25-29 | 0 | 0 | - | 0 | - |
| 30-39 | 0 | 0 | - | 0 | - |
| 40-59 | 1 | 1 | 100,00% | 0 | 0,00% |
| 60+ | 0 | 0 | - | 0 | - |
| Totalling | 1 | 1 | 100,00% | 0 | 0,00% |
| The youngest and oldest submitted candidate for councils | ||
| Age | Institution | |
| Youngest | 30 | Rada Gminy Kraszewice |
| Oldest | 73 | Rada Gminy Kraszewice |
| The youngest and oldest submitted candidate for reeve, mayor, president | ||
| Age | Institution | |
| Youngest | 58 | Wójt Gminy Kraszewice |
| Oldest | 58 | Wójt Gminy Kraszewice |
