

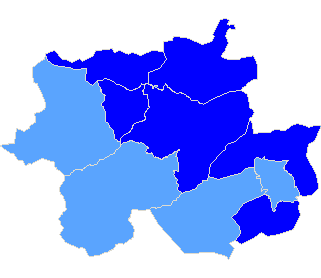
Powiat Suski
| The statistics of election committe |
| Lists submitted | ||
| Specification | Number of | |
| lists | councils | |
| Lists submitted for county councils | 0 | 0 |
| Lists registered for communal councils | 12 | 5 |
| Totalling | 12 | 5 |
| Submitted candidates | |||||
| Specification | Number of candidates | Women | Women (%) | Men | Men (%) |
| Number of candidates submitted for county councils | 0 | 0 | - | 0 | - |
| Number of candidates registered for communal councils | 22 | 7 | 31,82% | 15 | 68,18% |
| Number of candidates submitted for reeve, mayor and presidential elections | 1 | 0 | 0,00% | 1 | 100,00% |
| Totalling | 23 | 7 | 30,43% | 16 | 69,57% |
| Average age of submitted candidates | |||
| Specification | Average age | Average age of women | Average age of men |
| Average age of candidates submitted for county councils | - | - | - |
| Average age of candidates submitted for communal councils | 41 | 41 | 42 |
| Average age of candidates for reeve, mayor, president | 29 | - | 29 |
| Totalling | 40 | 41 | 41 |
| Submitted candidates for councils grouped by age | |||||
| Age | Number of candidates | Women | Women (%) | Men | Men (%) |
| 18-29 | 4 | 1 | 25,00% | 3 | 75,00% |
| 30-39 | 7 | 3 | 42,86% | 4 | 57,14% |
| 40-59 | 8 | 2 | 25,00% | 6 | 75,00% |
| 60+ | 3 | 1 | 33,33% | 2 | 66,67% |
| Totalling | 22 | 7 | 31,82% | 15 | 68,18% |
| Submitted candidates for reeve, mayor, president grouped by age | |||||
| Age | Number of candidates | Women | Women (%) | Men | Men (%) |
| 25-29 | 1 | 0 | 0,00% | 1 | 100,00% |
| 30-39 | 0 | 0 | - | 0 | - |
| 40-59 | 0 | 0 | - | 0 | - |
| 60+ | 0 | 0 | - | 0 | - |
| Totalling | 1 | 0 | 0,00% | 1 | 100,00% |
| The youngest and oldest submitted candidate for councils | ||
| Age | Institution | |
| Youngest | 19 | Rada Gminy w Jordanowie |
| Oldest | 71 | Rada Miejska w Suchej Beskidzkiej |
| The youngest and oldest submitted candidate for reeve, mayor, president | ||
| Age | Institution | |
| Youngest | 29 | Wójt Gminy Zembrzyce |
| Oldest | 29 | Wójt Gminy Zembrzyce |
| Rada Miejska w Suchej Beskidzkiej |
| Submitted candidates | ||||||
| Specification | Number of candidates | Women | Women (%) | Men | Men (%) | Status |
| Constituency no. 12 | 1 | 0 | 0,00% | 1 | 100,00% | Registered |
| Totalling | 1 | 0 | 0,00% | 1 | 100,00% | |
| Age of the candidates | |||||
| Specification | Average age | Average age of women | Average age of men | Oldest | Youngest |
| Constituency no. 12 | 71 | - | 71 | 71 | 71 |
| The statistics of election committe |
| Lists submitted | ||
| Specification | Number of | |
| lists | councils | |
| Lists registered for communal councils | 1 | 1 |
| Totalling | 1 | 1 |
| Submitted candidates | |||||
| Specification | Number of candidates | Women | Women (%) | Men | Men (%) |
| Number of candidates registered for communal councils | 1 | 0 | 0,00% | 1 | 100,00% |
| Number of candidates submitted for reeve, mayor and presidential elections | 0 | 0 | - | 0 | - |
| Totalling | 1 | 0 | 0,00% | 1 | 100,00% |
| Average age of submitted candidates | |||
| Specification | Average age | Average age of women | Average age of men |
| Average age of candidates submitted for communal councils | 71 | - | 71 |
| Average age of candidates for reeve, mayor, president | - | - | - |
| Totalling | 71 | - | 71 |
| Submitted candidates for councils grouped by age | |||||
| Age | Number of candidates | Women | Women (%) | Men | Men (%) |
| 18-29 | 0 | 0 | - | 0 | - |
| 30-39 | 0 | 0 | - | 0 | - |
| 40-59 | 0 | 0 | - | 0 | - |
| 60+ | 1 | 0 | 0,00% | 1 | 100,00% |
| Totalling | 1 | 0 | 0,00% | 1 | 100,00% |
| Submitted candidates for reeve, mayor, president grouped by age | |||||
| Age | Number of candidates | Women | Women (%) | Men | Men (%) |
| 25-29 | 0 | 0 | - | 0 | - |
| 30-39 | 0 | 0 | - | 0 | - |
| 40-59 | 0 | 0 | - | 0 | - |
| 60+ | 0 | 0 | - | 0 | - |
| Totalling | 0 | 0 | - | 0 | - |
| The youngest and oldest submitted candidate for councils | ||
| Age | Institution | |
| Youngest | 71 | Rada Miejska w Suchej Beskidzkiej |
| Oldest | 71 | Rada Miejska w Suchej Beskidzkiej |
| Rada Gminy w Budzowie |
| Submitted candidates | ||||||
| Specification | Number of candidates | Women | Women (%) | Men | Men (%) | Status |
| Constituency no. 1 | 3 | 1 | 33,33% | 2 | 66,67% | Registered |
| Totalling | 3 | 1 | 33,33% | 2 | 66,67% | |
| Age of the candidates | |||||
| Specification | Average age | Average age of women | Average age of men | Oldest | Youngest |
| Constituency no. 1 | 54 | 69 | 47 | 69 | 43 |
| The statistics of election committe |
| Lists submitted | ||
| Specification | Number of | |
| lists | councils | |
| Lists registered for communal councils | 1 | 1 |
| Totalling | 1 | 1 |
| Submitted candidates | |||||
| Specification | Number of candidates | Women | Women (%) | Men | Men (%) |
| Number of candidates registered for communal councils | 3 | 1 | 33,33% | 2 | 66,67% |
| Number of candidates submitted for reeve, mayor and presidential elections | 0 | 0 | - | 0 | - |
| Totalling | 3 | 1 | 33,33% | 2 | 66,67% |
| Average age of submitted candidates | |||
| Specification | Average age | Average age of women | Average age of men |
| Average age of candidates submitted for communal councils | 54 | 69 | 47 |
| Average age of candidates for reeve, mayor, president | - | - | - |
| Totalling | 54 | 69 | 47 |
| Submitted candidates for councils grouped by age | |||||
| Age | Number of candidates | Women | Women (%) | Men | Men (%) |
| 18-29 | 0 | 0 | - | 0 | - |
| 30-39 | 0 | 0 | - | 0 | - |
| 40-59 | 2 | 0 | 0,00% | 2 | 100,00% |
| 60+ | 1 | 1 | 100,00% | 0 | 0,00% |
| Totalling | 3 | 1 | 33,33% | 2 | 66,67% |
| Submitted candidates for reeve, mayor, president grouped by age | |||||
| Age | Number of candidates | Women | Women (%) | Men | Men (%) |
| 25-29 | 0 | 0 | - | 0 | - |
| 30-39 | 0 | 0 | - | 0 | - |
| 40-59 | 0 | 0 | - | 0 | - |
| 60+ | 0 | 0 | - | 0 | - |
| Totalling | 0 | 0 | - | 0 | - |
| The youngest and oldest submitted candidate for councils | ||
| Age | Institution | |
| Youngest | 43 | Rada Gminy w Budzowie |
| Oldest | 69 | Rada Gminy w Budzowie |
| Rada Gminy w Jordanowie |
| Submitted candidates | ||||||
| Specification | Number of candidates | Women | Women (%) | Men | Men (%) | Status |
| Constituency no. 1 | 1 | 0 | 0,00% | 1 | 100,00% | Registered |
| Constituency no. 2 | 2 | 0 | 0,00% | 2 | 100,00% | Registered |
| Constituency no. 3 | 1 | 1 | 100,00% | 0 | 0,00% | Registered |
| Constituency no. 4 | 1 | 0 | 0,00% | 1 | 100,00% | Registered |
| Totalling | 5 | 1 | 20,00% | 4 | 80,00% | |
| Age of the candidates | |||||
| Specification | Average age | Average age of women | Average age of men | Oldest | Youngest |
| Constituency no. 1 | 30 | - | 30 | 30 | 30 |
| Constituency no. 2 | 29 | - | 29 | 38 | 19 |
| Constituency no. 3 | 31 | 31 | - | 31 | 31 |
| Constituency no. 4 | 49 | - | 49 | 49 | 49 |
| The statistics of election committe |
| Lists submitted | ||
| Specification | Number of | |
| lists | councils | |
| Lists registered for communal councils | 4 | 1 |
| Totalling | 4 | 1 |
| Submitted candidates | |||||
| Specification | Number of candidates | Women | Women (%) | Men | Men (%) |
| Number of candidates registered for communal councils | 5 | 1 | 20,00% | 4 | 80,00% |
| Number of candidates submitted for reeve, mayor and presidential elections | 0 | 0 | - | 0 | - |
| Totalling | 5 | 1 | 20,00% | 4 | 80,00% |
| Average age of submitted candidates | |||
| Specification | Average age | Average age of women | Average age of men |
| Average age of candidates submitted for communal councils | 33 | 31 | 34 |
| Average age of candidates for reeve, mayor, president | - | - | - |
| Totalling | 33 | 31 | 34 |
| Submitted candidates for councils grouped by age | |||||
| Age | Number of candidates | Women | Women (%) | Men | Men (%) |
| 18-29 | 1 | 0 | 0,00% | 1 | 100,00% |
| 30-39 | 3 | 1 | 33,33% | 2 | 66,67% |
| 40-59 | 1 | 0 | 0,00% | 1 | 100,00% |
| 60+ | 0 | 0 | - | 0 | - |
| Totalling | 5 | 1 | 20,00% | 4 | 80,00% |
| Submitted candidates for reeve, mayor, president grouped by age | |||||
| Age | Number of candidates | Women | Women (%) | Men | Men (%) |
| 25-29 | 0 | 0 | - | 0 | - |
| 30-39 | 0 | 0 | - | 0 | - |
| 40-59 | 0 | 0 | - | 0 | - |
| 60+ | 0 | 0 | - | 0 | - |
| Totalling | 0 | 0 | - | 0 | - |
| The youngest and oldest submitted candidate for councils | ||
| Age | Institution | |
| Youngest | 19 | Rada Gminy w Jordanowie |
| Oldest | 49 | Rada Gminy w Jordanowie |
| Wójt Gminy Zembrzyce |
| Number of | Family name and given names | Age | Education | Address, party membership and endorsements |
| 3 | Palarski Łukasz Jan | 29 | wyższe prawnicze | Zembrzyce, submitted by KOMITET WYBORCZY POLSKIE STRONNICTWO LUDOWE, member of Polskiego Stronnictwa Ludowego |
| Rada Gminy Zembrzyce |
| Submitted candidates | ||||||
| Specification | Number of candidates | Women | Women (%) | Men | Men (%) | Status |
| Constituency no. 1 | 1 | 1 | 100,00% | 0 | 0,00% | Registered |
| Constituency no. 2 | 4 | 2 | 50,00% | 2 | 50,00% | Registered |
| Constituency no. 4 | 4 | 0 | 0,00% | 4 | 100,00% | Registered |
| Constituency no. 5 | 2 | 1 | 50,00% | 1 | 50,00% | Registered |
| Constituency no. 6 | 1 | 1 | 100,00% | 0 | 0,00% | Registered |
| Totalling | 12 | 5 | 41,67% | 7 | 58,33% | |
| Age of the candidates | |||||
| Specification | Average age | Average age of women | Average age of men | Oldest | Youngest |
| Constituency no. 1 | 56 | 56 | - | 56 | 56 |
| Constituency no. 2 | 35 | 36 | 35 | 47 | 22 |
| Constituency no. 4 | 46 | - | 46 | 61 | 29 |
| Constituency no. 5 | 38 | 30 | 46 | 46 | 30 |
| Constituency no. 6 | 31 | 31 | - | 31 | 31 |
| The statistics of election committe |
| Lists submitted | ||
| Specification | Number of | |
| lists | councils | |
| Lists registered for communal councils | 5 | 1 |
| Totalling | 5 | 1 |
| Submitted candidates | |||||
| Specification | Number of candidates | Women | Women (%) | Men | Men (%) |
| Number of candidates registered for communal councils | 12 | 5 | 41,67% | 7 | 58,33% |
| Number of candidates submitted for reeve, mayor and presidential elections | 1 | 0 | 0,00% | 1 | 100,00% |
| Totalling | 13 | 5 | 38,46% | 8 | 61,54% |
| Average age of submitted candidates | |||
| Specification | Average age | Average age of women | Average age of men |
| Average age of candidates submitted for communal councils | 41 | 38 | 43 |
| Average age of candidates for reeve, mayor, president | 29 | - | 29 |
| Totalling | 40 | 38 | 41 |
| Submitted candidates for councils grouped by age | |||||
| Age | Number of candidates | Women | Women (%) | Men | Men (%) |
| 18-29 | 3 | 1 | 33,33% | 2 | 66,67% |
| 30-39 | 3 | 2 | 66,67% | 1 | 33,33% |
| 40-59 | 5 | 2 | 40,00% | 3 | 60,00% |
| 60+ | 1 | 0 | 0,00% | 1 | 100,00% |
| Totalling | 12 | 5 | 41,67% | 7 | 58,33% |
| Submitted candidates for reeve, mayor, president grouped by age | |||||
| Age | Number of candidates | Women | Women (%) | Men | Men (%) |
| 25-29 | 1 | 0 | 0,00% | 1 | 100,00% |
| 30-39 | 0 | 0 | - | 0 | - |
| 40-59 | 0 | 0 | - | 0 | - |
| 60+ | 0 | 0 | - | 0 | - |
| Totalling | 1 | 0 | 0,00% | 1 | 100,00% |
| The youngest and oldest submitted candidate for councils | ||
| Age | Institution | |
| Youngest | 22 | Rada Gminy Zembrzyce |
| Oldest | 61 | Rada Gminy Zembrzyce |
| The youngest and oldest submitted candidate for reeve, mayor, president | ||
| Age | Institution | |
| Youngest | 29 | Wójt Gminy Zembrzyce |
| Oldest | 29 | Wójt Gminy Zembrzyce |
| Rada Miejska w Makowie Podhalańskim |
| Submitted candidates | ||||||
| Specification | Number of candidates | Women | Women (%) | Men | Men (%) | Status |
| Constituency no. 2 | 1 | 0 | 0,00% | 1 | 100,00% | Registered |
| Totalling | 1 | 0 | 0,00% | 1 | 100,00% | |
| Age of the candidates | |||||
| Specification | Average age | Average age of women | Average age of men | Oldest | Youngest |
| Constituency no. 2 | 30 | - | 30 | 30 | 30 |
| The statistics of election committe |
| Lists submitted | ||
| Specification | Number of | |
| lists | councils | |
| Lists registered for communal councils | 1 | 1 |
| Totalling | 1 | 1 |
| Submitted candidates | |||||
| Specification | Number of candidates | Women | Women (%) | Men | Men (%) |
| Number of candidates registered for communal councils | 1 | 0 | 0,00% | 1 | 100,00% |
| Number of candidates submitted for reeve, mayor and presidential elections | 0 | 0 | - | 0 | - |
| Totalling | 1 | 0 | 0,00% | 1 | 100,00% |
| Average age of submitted candidates | |||
| Specification | Average age | Average age of women | Average age of men |
| Average age of candidates submitted for communal councils | 30 | - | 30 |
| Average age of candidates for reeve, mayor, president | - | - | - |
| Totalling | 30 | - | 30 |
| Submitted candidates for councils grouped by age | |||||
| Age | Number of candidates | Women | Women (%) | Men | Men (%) |
| 18-29 | 0 | 0 | - | 0 | - |
| 30-39 | 1 | 0 | 0,00% | 1 | 100,00% |
| 40-59 | 0 | 0 | - | 0 | - |
| 60+ | 0 | 0 | - | 0 | - |
| Totalling | 1 | 0 | 0,00% | 1 | 100,00% |
| Submitted candidates for reeve, mayor, president grouped by age | |||||
| Age | Number of candidates | Women | Women (%) | Men | Men (%) |
| 25-29 | 0 | 0 | - | 0 | - |
| 30-39 | 0 | 0 | - | 0 | - |
| 40-59 | 0 | 0 | - | 0 | - |
| 60+ | 0 | 0 | - | 0 | - |
| Totalling | 0 | 0 | - | 0 | - |
| The youngest and oldest submitted candidate for councils | ||
| Age | Institution | |
| Youngest | 30 | Rada Miejska w Makowie Podhalańskim |
| Oldest | 30 | Rada Miejska w Makowie Podhalańskim |
