

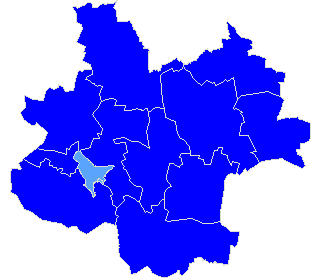
Powiat kolski
| Rada Powiatu Kolskiego |
| Submitted candidates | ||||||
| Specification | Number of candidates | Women | Women (%) | Men | Men (%) | Status |
| Constituency no. 1 | 9 | 2 | 22,22% | 7 | 77,78% | Registered |
| Constituency no. 2 | 6 | 1 | 16,67% | 5 | 83,33% | Registered |
| Constituency no. 3 | 6 | 0 | 0,00% | 6 | 100,00% | Registered |
| Constituency no. 4 | 6 | 1 | 16,67% | 5 | 83,33% | Registered |
| Constituency no. 5 | 6 | 2 | 33,33% | 4 | 66,67% | Registered |
| Constituency no. 6 | 6 | 0 | 0,00% | 6 | 100,00% | Registered |
| Totalling | 39 | 6 | 15,38% | 33 | 84,62% | |
| Age of the candidates | |||||
| Specification | Average age | Average age of women | Average age of men | Oldest | Youngest |
| Constituency no. 1 | 54 | 51 | 54 | 62 | 43 |
| Constituency no. 2 | 46 | 44 | 46 | 60 | 28 |
| Constituency no. 3 | 47 | - | 47 | 55 | 35 |
| Constituency no. 4 | 50 | 59 | 48 | 59 | 30 |
| Constituency no. 5 | 61 | 63 | 60 | 68 | 47 |
| Constituency no. 6 | 43 | - | 43 | 54 | 33 |
| The statistics of election committe |
| Lists submitted | ||
| Specification | Number of | |
| lists | councils | |
| Lists submitted for county councils | 6 | 1 |
| Lists registered for communal councils | 76 | 10 |
| Totalling | 82 | 11 |
| Submitted candidates | |||||
| Specification | Number of candidates | Women | Women (%) | Men | Men (%) |
| Number of candidates submitted for county councils | 39 | 6 | 15,38% | 33 | 84,62% |
| Number of candidates registered for communal councils | 105 | 28 | 26,67% | 77 | 73,33% |
| Number of candidates submitted for reeve, mayor and presidential elections | 5 | 0 | 0,00% | 5 | 100,00% |
| Totalling | 149 | 34 | 22,82% | 115 | 77,18% |
| Average age of submitted candidates | |||
| Specification | Average age | Average age of women | Average age of men |
| Average age of candidates submitted for county councils | 50 | 55 | 49 |
| Average age of candidates submitted for communal councils | 49 | 48 | 49 |
| Average age of candidates for reeve, mayor, president | 48 | - | 48 |
| Totalling | 49 | 49 | 48 |
| Submitted candidates for councils grouped by age | |||||
| Age | Number of candidates | Women | Women (%) | Men | Men (%) |
| 18-29 | 11 | 1 | 9,09% | 10 | 90,91% |
| 30-39 | 15 | 5 | 33,33% | 10 | 66,67% |
| 40-59 | 92 | 24 | 26,09% | 68 | 73,91% |
| 60+ | 26 | 4 | 15,38% | 22 | 84,62% |
| Totalling | 144 | 34 | 23,61% | 110 | 76,39% |
| Submitted candidates for reeve, mayor, president grouped by age | |||||
| Age | Number of candidates | Women | Women (%) | Men | Men (%) |
| 25-29 | 0 | 0 | - | 0 | - |
| 30-39 | 0 | 0 | - | 0 | - |
| 40-59 | 5 | 0 | 0,00% | 5 | 100,00% |
| 60+ | 0 | 0 | - | 0 | - |
| Totalling | 5 | 0 | 0,00% | 5 | 100,00% |
| The youngest and oldest submitted candidate for councils | ||
| Age | Institution | |
| Youngest | 24 | Rada Gminy w Chodowie |
| Oldest | 72 | Rada Gminy Osiek Mały |
| The youngest and oldest submitted candidate for reeve, mayor, president | ||
| Age | Institution | |
| Youngest | 45 | Wójt Gminy Kościelec |
| Oldest | 57 | Wójt Gminy Chodów |
| Rada Gminy Babiak |
| Submitted candidates | ||||||
| Specification | Number of candidates | Women | Women (%) | Men | Men (%) | Status |
| Constituency no. 1 | 4 | 1 | 25,00% | 3 | 75,00% | Registered |
| Constituency no. 2 | 1 | 0 | 0,00% | 1 | 100,00% | Registered |
| Constituency no. 3 | 1 | 0 | 0,00% | 1 | 100,00% | Registered |
| Constituency no. 4 | 1 | 0 | 0,00% | 1 | 100,00% | Registered |
| Constituency no. 5 | 1 | 0 | 0,00% | 1 | 100,00% | Registered |
| Constituency no. 6 | 1 | 0 | 0,00% | 1 | 100,00% | Registered |
| Constituency no. 7 | 2 | 1 | 50,00% | 1 | 50,00% | Registered |
| Constituency no. 8 | 1 | 0 | 0,00% | 1 | 100,00% | Registered |
| Constituency no. 9 | 1 | 0 | 0,00% | 1 | 100,00% | Registered |
| Constituency no. 10 | 1 | 0 | 0,00% | 1 | 100,00% | Registered |
| Constituency no. 11 | 1 | 1 | 100,00% | 0 | 0,00% | Registered |
| Totalling | 15 | 3 | 20,00% | 12 | 80,00% | |
| Age of the candidates | |||||
| Specification | Average age | Average age of women | Average age of men | Oldest | Youngest |
| Constituency no. 1 | 43 | 45 | 43 | 52 | 27 |
| Constituency no. 2 | 35 | - | 35 | 35 | 35 |
| Constituency no. 3 | 39 | - | 39 | 39 | 39 |
| Constituency no. 4 | 54 | - | 54 | 54 | 54 |
| Constituency no. 5 | 53 | - | 53 | 53 | 53 |
| Constituency no. 6 | 69 | - | 69 | 69 | 69 |
| Constituency no. 7 | 35 | 25 | 45 | 45 | 25 |
| Constituency no. 8 | 51 | - | 51 | 51 | 51 |
| Constituency no. 9 | 48 | - | 48 | 48 | 48 |
| Constituency no. 10 | 41 | - | 41 | 41 | 41 |
| Constituency no. 11 | 43 | 43 | - | 43 | 43 |
| The statistics of election committe |
| Lists submitted | ||
| Specification | Number of | |
| lists | councils | |
| Lists registered for communal councils | 11 | 1 |
| Totalling | 11 | 1 |
| Submitted candidates | |||||
| Specification | Number of candidates | Women | Women (%) | Men | Men (%) |
| Number of candidates registered for communal councils | 15 | 3 | 20,00% | 12 | 80,00% |
| Number of candidates submitted for reeve, mayor and presidential elections | 0 | 0 | - | 0 | - |
| Totalling | 15 | 3 | 20,00% | 12 | 80,00% |
| Average age of submitted candidates | |||
| Specification | Average age | Average age of women | Average age of men |
| Average age of candidates submitted for communal councils | 45 | 38 | 47 |
| Average age of candidates for reeve, mayor, president | - | - | - |
| Totalling | 45 | 38 | 47 |
| Submitted candidates for councils grouped by age | |||||
| Age | Number of candidates | Women | Women (%) | Men | Men (%) |
| 18-29 | 2 | 1 | 50,00% | 1 | 50,00% |
| 30-39 | 2 | 0 | 0,00% | 2 | 100,00% |
| 40-59 | 10 | 2 | 20,00% | 8 | 80,00% |
| 60+ | 1 | 0 | 0,00% | 1 | 100,00% |
| Totalling | 15 | 3 | 20,00% | 12 | 80,00% |
| Submitted candidates for reeve, mayor, president grouped by age | |||||
| Age | Number of candidates | Women | Women (%) | Men | Men (%) |
| 25-29 | 0 | 0 | - | 0 | - |
| 30-39 | 0 | 0 | - | 0 | - |
| 40-59 | 0 | 0 | - | 0 | - |
| 60+ | 0 | 0 | - | 0 | - |
| Totalling | 0 | 0 | - | 0 | - |
| The youngest and oldest submitted candidate for councils | ||
| Age | Institution | |
| Youngest | 25 | Rada Gminy Babiak |
| Oldest | 69 | Rada Gminy Babiak |
| Wójt Gminy Chodów |
| Number of | Family name and given names | Age | Education | Address, party membership and endorsements |
| 1 | Tomczak Henryk Józef | 57 | wyższe | Kłodawa, submitted by KOMITET WYBORCZY POLSKIE STRONNICTWO LUDOWE, member of Polskiego Stronnictwa Ludowego |
| Rada Gminy w Chodowie |
| Submitted candidates | ||||||
| Specification | Number of candidates | Women | Women (%) | Men | Men (%) | Status |
| Constituency no. 1 | 2 | 1 | 50,00% | 1 | 50,00% | Registered |
| Constituency no. 2 | 2 | 1 | 50,00% | 1 | 50,00% | Registered |
| Constituency no. 3 | 2 | 1 | 50,00% | 1 | 50,00% | Registered |
| Constituency no. 4 | 2 | 1 | 50,00% | 1 | 50,00% | Registered |
| Constituency no. 5 | 1 | 0 | 0,00% | 1 | 100,00% | Registered |
| Constituency no. 6 | 2 | 2 | 100,00% | 0 | 0,00% | Registered |
| Constituency no. 8 | 3 | 0 | 0,00% | 3 | 100,00% | Registered |
| Totalling | 14 | 6 | 42,86% | 8 | 57,14% | |
| Age of the candidates | |||||
| Specification | Average age | Average age of women | Average age of men | Oldest | Youngest |
| Constituency no. 1 | 52 | 56 | 48 | 56 | 48 |
| Constituency no. 2 | 50 | 43 | 57 | 57 | 43 |
| Constituency no. 3 | 49 | 45 | 53 | 53 | 45 |
| Constituency no. 4 | 56 | 63 | 49 | 63 | 49 |
| Constituency no. 5 | 49 | - | 49 | 49 | 49 |
| Constituency no. 6 | 39 | 39 | - | 41 | 37 |
| Constituency no. 8 | 48 | - | 48 | 62 | 24 |
| The statistics of election committe |
| Lists submitted | ||
| Specification | Number of | |
| lists | councils | |
| Lists registered for communal councils | 7 | 1 |
| Totalling | 7 | 1 |
| Submitted candidates | |||||
| Specification | Number of candidates | Women | Women (%) | Men | Men (%) |
| Number of candidates registered for communal councils | 14 | 6 | 42,86% | 8 | 57,14% |
| Number of candidates submitted for reeve, mayor and presidential elections | 1 | 0 | 0,00% | 1 | 100,00% |
| Totalling | 15 | 6 | 40,00% | 9 | 60,00% |
| Average age of submitted candidates | |||
| Specification | Average age | Average age of women | Average age of men |
| Average age of candidates submitted for communal councils | 49 | 48 | 50 |
| Average age of candidates for reeve, mayor, president | 57 | - | 57 |
| Totalling | 49 | 48 | 50 |
| Submitted candidates for councils grouped by age | |||||
| Age | Number of candidates | Women | Women (%) | Men | Men (%) |
| 18-29 | 1 | 0 | 0,00% | 1 | 100,00% |
| 30-39 | 1 | 1 | 100,00% | 0 | 0,00% |
| 40-59 | 10 | 4 | 40,00% | 6 | 60,00% |
| 60+ | 2 | 1 | 50,00% | 1 | 50,00% |
| Totalling | 14 | 6 | 42,86% | 8 | 57,14% |
| Submitted candidates for reeve, mayor, president grouped by age | |||||
| Age | Number of candidates | Women | Women (%) | Men | Men (%) |
| 25-29 | 0 | 0 | - | 0 | - |
| 30-39 | 0 | 0 | - | 0 | - |
| 40-59 | 1 | 0 | 0,00% | 1 | 100,00% |
| 60+ | 0 | 0 | - | 0 | - |
| Totalling | 1 | 0 | 0,00% | 1 | 100,00% |
| The youngest and oldest submitted candidate for councils | ||
| Age | Institution | |
| Youngest | 24 | Rada Gminy w Chodowie |
| Oldest | 63 | Rada Gminy w Chodowie |
| The youngest and oldest submitted candidate for reeve, mayor, president | ||
| Age | Institution | |
| Youngest | 57 | Wójt Gminy Chodów |
| Oldest | 57 | Wójt Gminy Chodów |
| Rada Gminy Grzegorzew |
| Submitted candidates | ||||||
| Specification | Number of candidates | Women | Women (%) | Men | Men (%) | Status |
| Constituency no. 1 | 4 | 1 | 25,00% | 3 | 75,00% | Registered |
| Constituency no. 2 | 1 | 0 | 0,00% | 1 | 100,00% | Registered |
| Constituency no. 3 | 2 | 0 | 0,00% | 2 | 100,00% | Registered |
| Constituency no. 4 | 3 | 0 | 0,00% | 3 | 100,00% | Registered |
| Constituency no. 5 | 2 | 0 | 0,00% | 2 | 100,00% | Registered |
| Constituency no. 6 | 1 | 0 | 0,00% | 1 | 100,00% | Registered |
| Totalling | 13 | 1 | 7,69% | 12 | 92,31% | |
| Age of the candidates | |||||
| Specification | Average age | Average age of women | Average age of men | Oldest | Youngest |
| Constituency no. 1 | 54 | 58 | 53 | 58 | 46 |
| Constituency no. 2 | 25 | - | 25 | 25 | 25 |
| Constituency no. 3 | 40 | - | 40 | 53 | 27 |
| Constituency no. 4 | 40 | - | 40 | 52 | 33 |
| Constituency no. 5 | 53 | - | 53 | 54 | 51 |
| Constituency no. 6 | 61 | - | 61 | 61 | 61 |
| The statistics of election committe |
| Lists submitted | ||
| Specification | Number of | |
| lists | councils | |
| Lists registered for communal councils | 6 | 1 |
| Totalling | 6 | 1 |
| Submitted candidates | |||||
| Specification | Number of candidates | Women | Women (%) | Men | Men (%) |
| Number of candidates registered for communal councils | 13 | 1 | 7,69% | 12 | 92,31% |
| Number of candidates submitted for reeve, mayor and presidential elections | 0 | 0 | - | 0 | - |
| Totalling | 13 | 1 | 7,69% | 12 | 92,31% |
| Average age of submitted candidates | |||
| Specification | Average age | Average age of women | Average age of men |
| Average age of candidates submitted for communal councils | 47 | 58 | 46 |
| Average age of candidates for reeve, mayor, president | - | - | - |
| Totalling | 47 | 58 | 46 |
| Submitted candidates for councils grouped by age | |||||
| Age | Number of candidates | Women | Women (%) | Men | Men (%) |
| 18-29 | 2 | 0 | 0,00% | 2 | 100,00% |
| 30-39 | 2 | 0 | 0,00% | 2 | 100,00% |
| 40-59 | 8 | 1 | 12,50% | 7 | 87,50% |
| 60+ | 1 | 0 | 0,00% | 1 | 100,00% |
| Totalling | 13 | 1 | 7,69% | 12 | 92,31% |
| Submitted candidates for reeve, mayor, president grouped by age | |||||
| Age | Number of candidates | Women | Women (%) | Men | Men (%) |
| 25-29 | 0 | 0 | - | 0 | - |
| 30-39 | 0 | 0 | - | 0 | - |
| 40-59 | 0 | 0 | - | 0 | - |
| 60+ | 0 | 0 | - | 0 | - |
| Totalling | 0 | 0 | - | 0 | - |
| The youngest and oldest submitted candidate for councils | ||
| Age | Institution | |
| Youngest | 25 | Rada Gminy Grzegorzew |
| Oldest | 61 | Rada Gminy Grzegorzew |
| Rada Gminy w Kole |
| Submitted candidates | ||||||
| Specification | Number of candidates | Women | Women (%) | Men | Men (%) | Status |
| Constituency no. 5 | 1 | 1 | 100,00% | 0 | 0,00% | Registered |
| Constituency no. 7 | 1 | 0 | 0,00% | 1 | 100,00% | Registered |
| Constituency no. 9 | 1 | 0 | 0,00% | 1 | 100,00% | Registered |
| Totalling | 3 | 1 | 33,33% | 2 | 66,67% | |
| Age of the candidates | |||||
| Specification | Average age | Average age of women | Average age of men | Oldest | Youngest |
| Constituency no. 5 | 49 | 49 | - | 49 | 49 |
| Constituency no. 7 | 55 | - | 55 | 55 | 55 |
| Constituency no. 9 | 42 | - | 42 | 42 | 42 |
| The statistics of election committe |
| Lists submitted | ||
| Specification | Number of | |
| lists | councils | |
| Lists registered for communal councils | 3 | 1 |
| Totalling | 3 | 1 |
| Submitted candidates | |||||
| Specification | Number of candidates | Women | Women (%) | Men | Men (%) |
| Number of candidates registered for communal councils | 3 | 1 | 33,33% | 2 | 66,67% |
| Number of candidates submitted for reeve, mayor and presidential elections | 0 | 0 | - | 0 | - |
| Totalling | 3 | 1 | 33,33% | 2 | 66,67% |
| Average age of submitted candidates | |||
| Specification | Average age | Average age of women | Average age of men |
| Average age of candidates submitted for communal councils | 49 | 49 | 49 |
| Average age of candidates for reeve, mayor, president | - | - | - |
| Totalling | 49 | 49 | 49 |
| Submitted candidates for councils grouped by age | |||||
| Age | Number of candidates | Women | Women (%) | Men | Men (%) |
| 18-29 | 0 | 0 | - | 0 | - |
| 30-39 | 0 | 0 | - | 0 | - |
| 40-59 | 3 | 1 | 33,33% | 2 | 66,67% |
| 60+ | 0 | 0 | - | 0 | - |
| Totalling | 3 | 1 | 33,33% | 2 | 66,67% |
| Submitted candidates for reeve, mayor, president grouped by age | |||||
| Age | Number of candidates | Women | Women (%) | Men | Men (%) |
| 25-29 | 0 | 0 | - | 0 | - |
| 30-39 | 0 | 0 | - | 0 | - |
| 40-59 | 0 | 0 | - | 0 | - |
| 60+ | 0 | 0 | - | 0 | - |
| Totalling | 0 | 0 | - | 0 | - |
| The youngest and oldest submitted candidate for councils | ||
| Age | Institution | |
| Youngest | 42 | Rada Gminy w Kole |
| Oldest | 55 | Rada Gminy w Kole |
| Wójt Gminy Kościelec |
| Number of | Family name and given names | Age | Education | Address, party membership and endorsements |
| 1 | Ostrowski Dariusz Tadeusz | 45 | wyższe | Dąbrowice Stare, submitted by KOMITET WYBORCZY POLSKIE STRONNICTWO LUDOWE, member of Polskiego Stronnictwa Ludowego |
| Rada Gminy Kościelec |
| Submitted candidates | ||||||
| Specification | Number of candidates | Women | Women (%) | Men | Men (%) | Status |
| Constituency no. 1 | 1 | 1 | 100,00% | 0 | 0,00% | Registered |
| Constituency no. 2 | 1 | 0 | 0,00% | 1 | 100,00% | Registered |
| Constituency no. 3 | 1 | 1 | 100,00% | 0 | 0,00% | Registered |
| Constituency no. 4 | 1 | 0 | 0,00% | 1 | 100,00% | Registered |
| Constituency no. 5 | 1 | 1 | 100,00% | 0 | 0,00% | Registered |
| Constituency no. 7 | 1 | 0 | 0,00% | 1 | 100,00% | Registered |
| Constituency no. 8 | 2 | 1 | 50,00% | 1 | 50,00% | Registered |
| Constituency no. 9 | 1 | 0 | 0,00% | 1 | 100,00% | Registered |
| Constituency no. 10 | 1 | 1 | 100,00% | 0 | 0,00% | Registered |
| Constituency no. 11 | 1 | 1 | 100,00% | 0 | 0,00% | Registered |
| Constituency no. 13 | 1 | 1 | 100,00% | 0 | 0,00% | Registered |
| Totalling | 12 | 7 | 58,33% | 5 | 41,67% | |
| Age of the candidates | |||||
| Specification | Average age | Average age of women | Average age of men | Oldest | Youngest |
| Constituency no. 1 | 56 | 56 | - | 56 | 56 |
| Constituency no. 2 | 68 | - | 68 | 68 | 68 |
| Constituency no. 3 | 43 | 43 | - | 43 | 43 |
| Constituency no. 4 | 35 | - | 35 | 35 | 35 |
| Constituency no. 5 | 52 | 52 | - | 52 | 52 |
| Constituency no. 7 | 41 | - | 41 | 41 | 41 |
| Constituency no. 8 | 57 | 66 | 47 | 66 | 47 |
| Constituency no. 9 | 37 | - | 37 | 37 | 37 |
| Constituency no. 10 | 42 | 42 | - | 42 | 42 |
| Constituency no. 11 | 57 | 57 | - | 57 | 57 |
| Constituency no. 13 | 34 | 34 | - | 34 | 34 |
| The statistics of election committe |
| Lists submitted | ||
| Specification | Number of | |
| lists | councils | |
| Lists registered for communal councils | 11 | 1 |
| Totalling | 11 | 1 |
| Submitted candidates | |||||
| Specification | Number of candidates | Women | Women (%) | Men | Men (%) |
| Number of candidates registered for communal councils | 12 | 7 | 58,33% | 5 | 41,67% |
| Number of candidates submitted for reeve, mayor and presidential elections | 1 | 0 | 0,00% | 1 | 100,00% |
| Totalling | 13 | 7 | 53,85% | 6 | 46,15% |
| Average age of submitted candidates | |||
| Specification | Average age | Average age of women | Average age of men |
| Average age of candidates submitted for communal councils | 48 | 50 | 46 |
| Average age of candidates for reeve, mayor, president | 45 | - | 45 |
| Totalling | 47 | 50 | 45 |
| Submitted candidates for councils grouped by age | |||||
| Age | Number of candidates | Women | Women (%) | Men | Men (%) |
| 18-29 | 0 | 0 | - | 0 | - |
| 30-39 | 3 | 1 | 33,33% | 2 | 66,67% |
| 40-59 | 7 | 5 | 71,43% | 2 | 28,57% |
| 60+ | 2 | 1 | 50,00% | 1 | 50,00% |
| Totalling | 12 | 7 | 58,33% | 5 | 41,67% |
| Submitted candidates for reeve, mayor, president grouped by age | |||||
| Age | Number of candidates | Women | Women (%) | Men | Men (%) |
| 25-29 | 0 | 0 | - | 0 | - |
| 30-39 | 0 | 0 | - | 0 | - |
| 40-59 | 1 | 0 | 0,00% | 1 | 100,00% |
| 60+ | 0 | 0 | - | 0 | - |
| Totalling | 1 | 0 | 0,00% | 1 | 100,00% |
| The youngest and oldest submitted candidate for councils | ||
| Age | Institution | |
| Youngest | 34 | Rada Gminy Kościelec |
| Oldest | 68 | Rada Gminy Kościelec |
| The youngest and oldest submitted candidate for reeve, mayor, president | ||
| Age | Institution | |
| Youngest | 45 | Wójt Gminy Kościelec |
| Oldest | 45 | Wójt Gminy Kościelec |
| Rada Gminy Olszówka |
| Submitted candidates | ||||||
| Specification | Number of candidates | Women | Women (%) | Men | Men (%) | Status |
| Constituency no. 1 | 1 | 0 | 0,00% | 1 | 100,00% | Registered |
| Constituency no. 2 | 1 | 0 | 0,00% | 1 | 100,00% | Registered |
| Constituency no. 4 | 2 | 0 | 0,00% | 2 | 100,00% | Registered |
| Constituency no. 7 | 1 | 1 | 100,00% | 0 | 0,00% | Registered |
| Constituency no. 10 | 1 | 0 | 0,00% | 1 | 100,00% | Registered |
| Constituency no. 11 | 1 | 0 | 0,00% | 1 | 100,00% | Registered |
| Totalling | 7 | 1 | 14,29% | 6 | 85,71% | |
| Age of the candidates | |||||
| Specification | Average age | Average age of women | Average age of men | Oldest | Youngest |
| Constituency no. 1 | 29 | - | 29 | 29 | 29 |
| Constituency no. 2 | 29 | - | 29 | 29 | 29 |
| Constituency no. 4 | 49 | - | 49 | 51 | 47 |
| Constituency no. 7 | 53 | 53 | - | 53 | 53 |
| Constituency no. 10 | 54 | - | 54 | 54 | 54 |
| Constituency no. 11 | 65 | - | 65 | 65 | 65 |
| The statistics of election committe |
| Lists submitted | ||
| Specification | Number of | |
| lists | councils | |
| Lists registered for communal councils | 6 | 1 |
| Totalling | 6 | 1 |
| Submitted candidates | |||||
| Specification | Number of candidates | Women | Women (%) | Men | Men (%) |
| Number of candidates registered for communal councils | 7 | 1 | 14,29% | 6 | 85,71% |
| Number of candidates submitted for reeve, mayor and presidential elections | 0 | 0 | - | 0 | - |
| Totalling | 7 | 1 | 14,29% | 6 | 85,71% |
| Average age of submitted candidates | |||
| Specification | Average age | Average age of women | Average age of men |
| Average age of candidates submitted for communal councils | 47 | 53 | 46 |
| Average age of candidates for reeve, mayor, president | - | - | - |
| Totalling | 47 | 53 | 46 |
| Submitted candidates for councils grouped by age | |||||
| Age | Number of candidates | Women | Women (%) | Men | Men (%) |
| 18-29 | 2 | 0 | 0,00% | 2 | 100,00% |
| 30-39 | 0 | 0 | - | 0 | - |
| 40-59 | 4 | 1 | 25,00% | 3 | 75,00% |
| 60+ | 1 | 0 | 0,00% | 1 | 100,00% |
| Totalling | 7 | 1 | 14,29% | 6 | 85,71% |
| Submitted candidates for reeve, mayor, president grouped by age | |||||
| Age | Number of candidates | Women | Women (%) | Men | Men (%) |
| 25-29 | 0 | 0 | - | 0 | - |
| 30-39 | 0 | 0 | - | 0 | - |
| 40-59 | 0 | 0 | - | 0 | - |
| 60+ | 0 | 0 | - | 0 | - |
| Totalling | 0 | 0 | - | 0 | - |
| The youngest and oldest submitted candidate for councils | ||
| Age | Institution | |
| Youngest | 29 | Rada Gminy Olszówka |
| Oldest | 65 | Rada Gminy Olszówka |
| Wójt Gminy Osiek Mały |
| Number of | Family name and given names | Age | Education | Address, party membership and endorsements |
| 1 | GÓRCZEWSKI MAREK | 47 | ŚREDNIE | ROSOCHA, submitted by KOMITET WYBORCZY POLSKIE STRONNICTWO LUDOWE, member of Polskiego Stronnictwa Ludowego |
| Rada Gminy Osiek Mały |
| Submitted candidates | ||||||
| Specification | Number of candidates | Women | Women (%) | Men | Men (%) | Status |
| Constituency no. 1 | 2 | 0 | 0,00% | 2 | 100,00% | Registered |
| Constituency no. 2 | 2 | 2 | 100,00% | 0 | 0,00% | Registered |
| Constituency no. 3 | 1 | 0 | 0,00% | 1 | 100,00% | Registered |
| Constituency no. 4 | 1 | 0 | 0,00% | 1 | 100,00% | Registered |
| Constituency no. 5 | 1 | 1 | 100,00% | 0 | 0,00% | Registered |
| Constituency no. 6 | 1 | 0 | 0,00% | 1 | 100,00% | Registered |
| Constituency no. 7 | 1 | 0 | 0,00% | 1 | 100,00% | Registered |
| Constituency no. 8 | 1 | 0 | 0,00% | 1 | 100,00% | Registered |
| Constituency no. 9 | 2 | 0 | 0,00% | 2 | 100,00% | Registered |
| Constituency no. 10 | 1 | 1 | 100,00% | 0 | 0,00% | Registered |
| Constituency no. 11 | 1 | 0 | 0,00% | 1 | 100,00% | Registered |
| Constituency no. 12 | 1 | 0 | 0,00% | 1 | 100,00% | Registered |
| Totalling | 15 | 4 | 26,67% | 11 | 73,33% | |
| Age of the candidates | |||||
| Specification | Average age | Average age of women | Average age of men | Oldest | Youngest |
| Constituency no. 1 | 63 | - | 63 | 63 | 62 |
| Constituency no. 2 | 48 | 48 | - | 58 | 38 |
| Constituency no. 3 | 50 | - | 50 | 50 | 50 |
| Constituency no. 4 | 65 | - | 65 | 65 | 65 |
| Constituency no. 5 | 51 | 51 | - | 51 | 51 |
| Constituency no. 6 | 62 | - | 62 | 62 | 62 |
| Constituency no. 7 | 44 | - | 44 | 44 | 44 |
| Constituency no. 8 | 28 | - | 28 | 28 | 28 |
| Constituency no. 9 | 55 | - | 55 | 59 | 50 |
| Constituency no. 10 | 35 | 35 | - | 35 | 35 |
| Constituency no. 11 | 62 | - | 62 | 62 | 62 |
| Constituency no. 12 | 72 | - | 72 | 72 | 72 |
| The statistics of election committe |
| Lists submitted | ||
| Specification | Number of | |
| lists | councils | |
| Lists registered for communal councils | 12 | 1 |
| Totalling | 12 | 1 |
| Submitted candidates | |||||
| Specification | Number of candidates | Women | Women (%) | Men | Men (%) |
| Number of candidates registered for communal councils | 15 | 4 | 26,67% | 11 | 73,33% |
| Number of candidates submitted for reeve, mayor and presidential elections | 1 | 0 | 0,00% | 1 | 100,00% |
| Totalling | 16 | 4 | 25,00% | 12 | 75,00% |
| Average age of submitted candidates | |||
| Specification | Average age | Average age of women | Average age of men |
| Average age of candidates submitted for communal councils | 53 | 46 | 56 |
| Average age of candidates for reeve, mayor, president | 47 | - | 47 |
| Totalling | 52 | 46 | 55 |
| Submitted candidates for councils grouped by age | |||||
| Age | Number of candidates | Women | Women (%) | Men | Men (%) |
| 18-29 | 1 | 0 | 0,00% | 1 | 100,00% |
| 30-39 | 2 | 2 | 100,00% | 0 | 0,00% |
| 40-59 | 6 | 2 | 33,33% | 4 | 66,67% |
| 60+ | 6 | 0 | 0,00% | 6 | 100,00% |
| Totalling | 15 | 4 | 26,67% | 11 | 73,33% |
| Submitted candidates for reeve, mayor, president grouped by age | |||||
| Age | Number of candidates | Women | Women (%) | Men | Men (%) |
| 25-29 | 0 | 0 | - | 0 | - |
| 30-39 | 0 | 0 | - | 0 | - |
| 40-59 | 1 | 0 | 0,00% | 1 | 100,00% |
| 60+ | 0 | 0 | - | 0 | - |
| Totalling | 1 | 0 | 0,00% | 1 | 100,00% |
| The youngest and oldest submitted candidate for councils | ||
| Age | Institution | |
| Youngest | 28 | Rada Gminy Osiek Mały |
| Oldest | 72 | Rada Gminy Osiek Mały |
| The youngest and oldest submitted candidate for reeve, mayor, president | ||
| Age | Institution | |
| Youngest | 47 | Wójt Gminy Osiek Mały |
| Oldest | 47 | Wójt Gminy Osiek Mały |
| Burmistrz Miasta Dąbie |
| Number of | Family name and given names | Age | Education | Address, party membership and endorsements |
| 3 | Wasiak Zenon | 48 | Wyższe | Kupinin, submitted by KOMITET WYBORCZY POLSKIE STRONNICTWO LUDOWE, member of Polskiego Stronnictwa Ludowego |
| Rada Miejska w Dąbiu |
| Submitted candidates | ||||||
| Specification | Number of candidates | Women | Women (%) | Men | Men (%) | Status |
| Constituency no. 1 | 1 | 1 | 100,00% | 0 | 0,00% | Registered |
| Constituency no. 2 | 1 | 0 | 0,00% | 1 | 100,00% | Registered |
| Constituency no. 3 | 1 | 0 | 0,00% | 1 | 100,00% | Registered |
| Constituency no. 5 | 1 | 0 | 0,00% | 1 | 100,00% | Registered |
| Constituency no. 6 | 1 | 0 | 0,00% | 1 | 100,00% | Registered |
| Constituency no. 7 | 1 | 0 | 0,00% | 1 | 100,00% | Registered |
| Constituency no. 8 | 1 | 0 | 0,00% | 1 | 100,00% | Registered |
| Constituency no. 9 | 1 | 0 | 0,00% | 1 | 100,00% | Registered |
| Constituency no. 10 | 1 | 0 | 0,00% | 1 | 100,00% | Registered |
| Constituency no. 11 | 1 | 0 | 0,00% | 1 | 100,00% | Registered |
| Constituency no. 14 | 1 | 1 | 100,00% | 0 | 0,00% | Registered |
| Constituency no. 15 | 1 | 0 | 0,00% | 1 | 100,00% | Registered |
| Totalling | 12 | 2 | 16,67% | 10 | 83,33% | |
| Age of the candidates | |||||
| Specification | Average age | Average age of women | Average age of men | Oldest | Youngest |
| Constituency no. 1 | 55 | 55 | - | 55 | 55 |
| Constituency no. 2 | 57 | - | 57 | 57 | 57 |
| Constituency no. 3 | 51 | - | 51 | 51 | 51 |
| Constituency no. 5 | 64 | - | 64 | 64 | 64 |
| Constituency no. 6 | 24 | - | 24 | 24 | 24 |
| Constituency no. 7 | 42 | - | 42 | 42 | 42 |
| Constituency no. 8 | 56 | - | 56 | 56 | 56 |
| Constituency no. 9 | 64 | - | 64 | 64 | 64 |
| Constituency no. 10 | 48 | - | 48 | 48 | 48 |
| Constituency no. 11 | 51 | - | 51 | 51 | 51 |
| Constituency no. 14 | 35 | 35 | - | 35 | 35 |
| Constituency no. 15 | 29 | - | 29 | 29 | 29 |
| The statistics of election committe |
| Lists submitted | ||
| Specification | Number of | |
| lists | councils | |
| Lists registered for communal councils | 12 | 1 |
| Totalling | 12 | 1 |
| Submitted candidates | |||||
| Specification | Number of candidates | Women | Women (%) | Men | Men (%) |
| Number of candidates registered for communal councils | 12 | 2 | 16,67% | 10 | 83,33% |
| Number of candidates submitted for reeve, mayor and presidential elections | 1 | 0 | 0,00% | 1 | 100,00% |
| Totalling | 13 | 2 | 15,38% | 11 | 84,62% |
| Average age of submitted candidates | |||
| Specification | Average age | Average age of women | Average age of men |
| Average age of candidates submitted for communal councils | 48 | 45 | 49 |
| Average age of candidates for reeve, mayor, president | 48 | - | 48 |
| Totalling | 48 | 45 | 48 |
| Submitted candidates for councils grouped by age | |||||
| Age | Number of candidates | Women | Women (%) | Men | Men (%) |
| 18-29 | 2 | 0 | 0,00% | 2 | 100,00% |
| 30-39 | 1 | 1 | 100,00% | 0 | 0,00% |
| 40-59 | 7 | 1 | 14,29% | 6 | 85,71% |
| 60+ | 2 | 0 | 0,00% | 2 | 100,00% |
| Totalling | 12 | 2 | 16,67% | 10 | 83,33% |
| Submitted candidates for reeve, mayor, president grouped by age | |||||
| Age | Number of candidates | Women | Women (%) | Men | Men (%) |
| 25-29 | 0 | 0 | - | 0 | - |
| 30-39 | 0 | 0 | - | 0 | - |
| 40-59 | 1 | 0 | 0,00% | 1 | 100,00% |
| 60+ | 0 | 0 | - | 0 | - |
| Totalling | 1 | 0 | 0,00% | 1 | 100,00% |
| The youngest and oldest submitted candidate for councils | ||
| Age | Institution | |
| Youngest | 24 | Rada Miejska w Dąbiu |
| Oldest | 64 | Rada Miejska w Dąbiu |
| The youngest and oldest submitted candidate for reeve, mayor, president | ||
| Age | Institution | |
| Youngest | 48 | Burmistrz Miasta Dąbie |
| Oldest | 48 | Burmistrz Miasta Dąbie |
| Burmistrz Kłodawy |
| Number of | Family name and given names | Age | Education | Address, party membership and endorsements |
| 4 | Ratajczyk Wiesław Bronisław | 47 | Wyższe | Kobylata, submitted by KOMITET WYBORCZY POLSKIE STRONNICTWO LUDOWE, member of Polskiego Stronnictwa Ludowego |
| Rada Miejska w Kłodawie |
| Submitted candidates | ||||||
| Specification | Number of candidates | Women | Women (%) | Men | Men (%) | Status |
| Constituency no. 1 | 4 | 1 | 25,00% | 3 | 75,00% | Registered |
| Constituency no. 2 | 3 | 0 | 0,00% | 3 | 100,00% | Registered |
| Constituency no. 4 | 2 | 0 | 0,00% | 2 | 100,00% | Registered |
| Constituency no. 5 | 1 | 1 | 100,00% | 0 | 0,00% | Registered |
| Constituency no. 6 | 1 | 0 | 0,00% | 1 | 100,00% | Registered |
| Constituency no. 7 | 1 | 0 | 0,00% | 1 | 100,00% | Registered |
| Constituency no. 8 | 1 | 1 | 100,00% | 0 | 0,00% | Registered |
| Totalling | 13 | 3 | 23,08% | 10 | 76,92% | |
| Age of the candidates | |||||
| Specification | Average age | Average age of women | Average age of men | Oldest | Youngest |
| Constituency no. 1 | 53 | 53 | 53 | 61 | 47 |
| Constituency no. 2 | 55 | - | 55 | 61 | 50 |
| Constituency no. 4 | 60 | - | 60 | 64 | 55 |
| Constituency no. 5 | 54 | 54 | - | 54 | 54 |
| Constituency no. 6 | 57 | - | 57 | 57 | 57 |
| Constituency no. 7 | 49 | - | 49 | 49 | 49 |
| Constituency no. 8 | 60 | 60 | - | 60 | 60 |
| The statistics of election committe |
| Lists submitted | ||
| Specification | Number of | |
| lists | councils | |
| Lists registered for communal councils | 7 | 1 |
| Totalling | 7 | 1 |
| Submitted candidates | |||||
| Specification | Number of candidates | Women | Women (%) | Men | Men (%) |
| Number of candidates registered for communal councils | 13 | 3 | 23,08% | 10 | 76,92% |
| Number of candidates submitted for reeve, mayor and presidential elections | 1 | 0 | 0,00% | 1 | 100,00% |
| Totalling | 14 | 3 | 21,43% | 11 | 78,57% |
| Average age of submitted candidates | |||
| Specification | Average age | Average age of women | Average age of men |
| Average age of candidates submitted for communal councils | 55 | 56 | 55 |
| Average age of candidates for reeve, mayor, president | 47 | - | 47 |
| Totalling | 54 | 56 | 54 |
| Submitted candidates for councils grouped by age | |||||
| Age | Number of candidates | Women | Women (%) | Men | Men (%) |
| 18-29 | 0 | 0 | - | 0 | - |
| 30-39 | 0 | 0 | - | 0 | - |
| 40-59 | 9 | 2 | 22,22% | 7 | 77,78% |
| 60+ | 4 | 1 | 25,00% | 3 | 75,00% |
| Totalling | 13 | 3 | 23,08% | 10 | 76,92% |
| Submitted candidates for reeve, mayor, president grouped by age | |||||
| Age | Number of candidates | Women | Women (%) | Men | Men (%) |
| 25-29 | 0 | 0 | - | 0 | - |
| 30-39 | 0 | 0 | - | 0 | - |
| 40-59 | 1 | 0 | 0,00% | 1 | 100,00% |
| 60+ | 0 | 0 | - | 0 | - |
| Totalling | 1 | 0 | 0,00% | 1 | 100,00% |
| The youngest and oldest submitted candidate for councils | ||
| Age | Institution | |
| Youngest | 47 | Rada Miejska w Kłodawie |
| Oldest | 64 | Rada Miejska w Kłodawie |
| The youngest and oldest submitted candidate for reeve, mayor, president | ||
| Age | Institution | |
| Youngest | 47 | Burmistrz Kłodawy |
| Oldest | 47 | Burmistrz Kłodawy |
| Rada Miejska w Przedczu |
| Submitted candidates | ||||||
| Specification | Number of candidates | Women | Women (%) | Men | Men (%) | Status |
| Constituency no. 6 | 1 | 0 | 0,00% | 1 | 100,00% | Registered |
| Totalling | 1 | 0 | 0,00% | 1 | 100,00% | |
| Age of the candidates | |||||
| Specification | Average age | Average age of women | Average age of men | Oldest | Youngest |
| Constituency no. 6 | 53 | - | 53 | 53 | 53 |
| The statistics of election committe |
| Lists submitted | ||
| Specification | Number of | |
| lists | councils | |
| Lists registered for communal councils | 1 | 1 |
| Totalling | 1 | 1 |
| Submitted candidates | |||||
| Specification | Number of candidates | Women | Women (%) | Men | Men (%) |
| Number of candidates registered for communal councils | 1 | 0 | 0,00% | 1 | 100,00% |
| Number of candidates submitted for reeve, mayor and presidential elections | 0 | 0 | - | 0 | - |
| Totalling | 1 | 0 | 0,00% | 1 | 100,00% |
| Average age of submitted candidates | |||
| Specification | Average age | Average age of women | Average age of men |
| Average age of candidates submitted for communal councils | 53 | - | 53 |
| Average age of candidates for reeve, mayor, president | - | - | - |
| Totalling | 53 | - | 53 |
| Submitted candidates for councils grouped by age | |||||
| Age | Number of candidates | Women | Women (%) | Men | Men (%) |
| 18-29 | 0 | 0 | - | 0 | - |
| 30-39 | 0 | 0 | - | 0 | - |
| 40-59 | 1 | 0 | 0,00% | 1 | 100,00% |
| 60+ | 0 | 0 | - | 0 | - |
| Totalling | 1 | 0 | 0,00% | 1 | 100,00% |
| Submitted candidates for reeve, mayor, president grouped by age | |||||
| Age | Number of candidates | Women | Women (%) | Men | Men (%) |
| 25-29 | 0 | 0 | - | 0 | - |
| 30-39 | 0 | 0 | - | 0 | - |
| 40-59 | 0 | 0 | - | 0 | - |
| 60+ | 0 | 0 | - | 0 | - |
| Totalling | 0 | 0 | - | 0 | - |
| The youngest and oldest submitted candidate for councils | ||
| Age | Institution | |
| Youngest | 53 | Rada Miejska w Przedczu |
| Oldest | 53 | Rada Miejska w Przedczu |
