

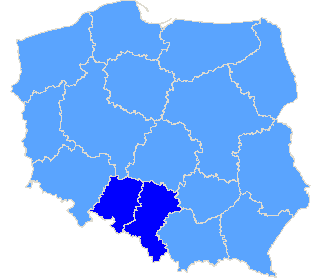
Rzeczpospolita Polska
| The statistics of election committe |
| Lists submitted | ||
| Specification | Number of | |
| lists | councils | |
| Lists submitted for provinces councils | 7 | 1 |
| Lists submitted for county councils | 18 | 4 |
| Lists submitted for councils of cities holding county rights | 21 | 5 |
| Lists submitted for districts councils of the cap. city of Warsaw | 0 | 0 |
| Lists registered for communal councils | 36 | 9 |
| Totalling | 82 | 19 |
| Submitted candidates | |||||
| Specification | Number of candidates | Women | Women (%) | Men | Men (%) |
| Number of candidates submitted for the province council | 84 | 11 | 13,10% | 73 | 86,90% |
| Number of candidates submitted for county councils | 95 | 23 | 24,21% | 72 | 75,79% |
| Number of candidates submitted for councils of cities holding county rights | 174 | 36 | 20,69% | 138 | 79,31% |
| Number of candidates submitted for districts councils of the cap. city of Warsaw | 0 | 0 | - | 0 | - |
| Number of candidates registered for communal councils | 106 | 14 | 13,21% | 92 | 86,79% |
| Number of candidates submitted for reeve, mayor and presidential elections | 7 | 1 | 14,29% | 6 | 85,71% |
| Totalling | 466 | 85 | 18,24% | 381 | 81,76% |
| Average age of submitted candidates | |||
| Specification | Average age | Average age of women | Average age of men |
| Average age of candidates submitted for the province council | 43 | 42 | 43 |
| Average age of candidates submitted for county councils | 42 | 41 | 43 |
| Average age of candidates for councils of cities holding county rights | 39 | 37 | 40 |
| Average age of candidates submitted for communal councils | 44 | 44 | 44 |
| Average age of candidates for reeve, mayor, president | 51 | 47 | 52 |
| Totalling | 41 | 40 | 42 |
| Submitted candidates for councils grouped by age | |||||
| Age | Number of candidates | Women | Women (%) | Men | Men (%) |
| 18-29 | 115 | 27 | 23,48% | 88 | 76,52% |
| 30-39 | 104 | 14 | 13,46% | 90 | 86,54% |
| 40-59 | 174 | 36 | 20,69% | 138 | 79,31% |
| 60+ | 66 | 7 | 10,61% | 59 | 89,39% |
| Totalling | 459 | 84 | 18,30% | 375 | 81,70% |
| Submitted candidates for reeve, mayor, president grouped by age | |||||
| Age | Number of candidates | Women | Women (%) | Men | Men (%) |
| 25-29 | 0 | 0 | - | 0 | - |
| 30-39 | 1 | 0 | 0,00% | 1 | 100,00% |
| 40-59 | 5 | 1 | 20,00% | 4 | 80,00% |
| 60+ | 1 | 0 | 0,00% | 1 | 100,00% |
| Totalling | 7 | 1 | 14,29% | 6 | 85,71% |
| The youngest and oldest submitted candidate for councils | ||
| Age | Institution | |
| Youngest | 18 | Rada Miasta Chorzów |
| Oldest | 80 | Sejmik Województwa Śląskiego |
| The youngest and oldest submitted candidate for reeve, mayor, president | ||
| Age | Institution | |
| Youngest | 37 | Wójt Gminy Godów |
| Oldest | 70 | Prezydent Miasta Rybnika |
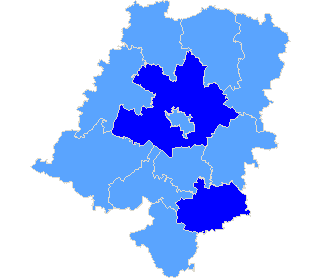
Province opolskie
| Specification |
| pow. kędzierzyńsko-kozielski |
| pow. opolski |
| The statistics of election committe |
| Lists submitted | ||
| Specification | Number of | |
| lists | councils | |
| Lists submitted for province council | 0 | 0 |
| Lists submitted for county councils | 6 | 1 |
| Lists submitted for councils of cities holding county rights | 0 | 0 |
| Lists registered for communal councils | 10 | 1 |
| Totalling | 16 | 2 |
| Submitted candidates | |||||
| Specification | Number of candidates | Women | Women (%) | Men | Men (%) |
| Number of candidates submitted for the province council | 0 | 0 | - | 0 | - |
| Number of candidates submitted for county councils | 22 | 4 | 18,18% | 18 | 81,82% |
| Number of candidates submitted for councils of cities holding county rights | 0 | 0 | - | 0 | - |
| Number of candidates registered for communal councils | 13 | 4 | 30,77% | 9 | 69,23% |
| Number of candidates submitted for reeve, mayor and presidential elections | 1 | 0 | 0,00% | 1 | 100,00% |
| Totalling | 36 | 8 | 22,22% | 28 | 77,78% |
| Average age of submitted candidates | |||
| Specification | Average age | Average age of women | Average age of men |
| Average age of candidates submitted for the province council | - | - | - |
| Average age of candidates submitted for county councils | 39 | 27 | 41 |
| Average age of candidates for councils of cities holding county rights | - | - | - |
| Average age of candidates submitted for communal councils | 44 | 48 | 42 |
| Average age of candidates for reeve, mayor, president | 52 | - | 52 |
| Totalling | 41 | 37 | 41 |
| Submitted candidates for councils grouped by age | |||||
| Age | Number of candidates | Women | Women (%) | Men | Men (%) |
| 18-29 | 12 | 4 | 33,33% | 8 | 66,67% |
| 30-39 | 4 | 0 | 0,00% | 4 | 100,00% |
| 40-59 | 17 | 4 | 23,53% | 13 | 76,47% |
| 60+ | 2 | 0 | 0,00% | 2 | 100,00% |
| Totalling | 35 | 8 | 22,86% | 27 | 77,14% |
| Submitted candidates for reeve, mayor, president grouped by age | |||||
| Age | Number of candidates | Women | Women (%) | Men | Men (%) |
| 25-29 | 0 | 0 | - | 0 | - |
| 30-39 | 0 | 0 | - | 0 | - |
| 40-59 | 1 | 0 | 0,00% | 1 | 100,00% |
| 60+ | 0 | 0 | - | 0 | - |
| Totalling | 1 | 0 | 0,00% | 1 | 100,00% |
| The youngest and oldest submitted candidate for councils | ||
| Age | Institution | |
| Youngest | 18 | Rada Powiatu Opolskiego |
| Oldest | 77 | Rada Powiatu Opolskiego |
| The youngest and oldest submitted candidate for reeve, mayor, president | ||
| Age | Institution | |
| Youngest | 52 | Wójt Gminy Cisek |
| Oldest | 52 | Wójt Gminy Cisek |
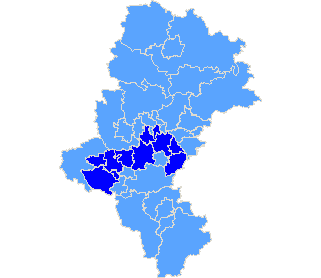
Province śląskie
| Sejmik Województwa Śląskiego |
| Submitted candidates | ||||||
| Specification | Number of candidates | Women | Women (%) | Men | Men (%) | Status |
| Constituency no. 1 | 11 | 0 | 0,00% | 11 | 100,00% | Registered |
| Constituency no. 2 | 14 | 3 | 21,43% | 11 | 78,57% | Registered |
| Constituency no. 3 | 16 | 2 | 12,50% | 14 | 87,50% | Registered |
| Constituency no. 4 | 14 | 3 | 21,43% | 11 | 78,57% | Registered |
| Constituency no. 5 | 12 | 1 | 8,33% | 11 | 91,67% | Registered |
| Constituency no. 6 | 7 | 0 | 0,00% | 7 | 100,00% | Registered |
| Constituency no. 7 | 10 | 2 | 20,00% | 8 | 80,00% | Registered |
| Totalling | 84 | 11 | 13,10% | 73 | 86,90% | |
| Age of the candidates | |||||
| Specification | Average age | Average age of women | Average age of men | Oldest | Youngest |
| Constituency no. 1 | 38 | - | 38 | 66 | 21 |
| Constituency no. 2 | 48 | 41 | 50 | 68 | 21 |
| Constituency no. 3 | 39 | 49 | 37 | 64 | 21 |
| Constituency no. 4 | 44 | 52 | 41 | 65 | 20 |
| Constituency no. 5 | 49 | 34 | 51 | 80 | 32 |
| Constituency no. 6 | 46 | - | 46 | 65 | 34 |
| Constituency no. 7 | 36 | 24 | 40 | 62 | 21 |
| Specification |
| m. Chorzów |
| m. Katowice |
| m. Mysłowice |
| m. Ruda Śląska |
| m. Rybnik |
| pow. mikołowski |
| pow. rybnicki |
| pow. bieruńsko-lędziński |
| pow. wodzisławski |
| The statistics of election committe |
| Lists submitted | ||
| Specification | Number of | |
| lists | councils | |
| Lists submitted for province council | 7 | 1 |
| Lists submitted for county councils | 12 | 3 |
| Lists submitted for councils of cities holding county rights | 21 | 5 |
| Lists registered for communal councils | 26 | 8 |
| Totalling | 66 | 17 |
| Submitted candidates | |||||
| Specification | Number of candidates | Women | Women (%) | Men | Men (%) |
| Number of candidates submitted for the province council | 84 | 11 | 13,10% | 73 | 86,90% |
| Number of candidates submitted for county councils | 73 | 19 | 26,03% | 54 | 73,97% |
| Number of candidates submitted for councils of cities holding county rights | 174 | 36 | 20,69% | 138 | 79,31% |
| Number of candidates registered for communal councils | 93 | 10 | 10,75% | 83 | 89,25% |
| Number of candidates submitted for reeve, mayor and presidential elections | 6 | 1 | 16,67% | 5 | 83,33% |
| Totalling | 430 | 77 | 17,91% | 353 | 82,09% |
| Average age of submitted candidates | |||
| Specification | Average age | Average age of women | Average age of men |
| Average age of candidates submitted for the province council | 43 | 42 | 43 |
| Average age of candidates submitted for county councils | 44 | 45 | 44 |
| Average age of candidates for councils of cities holding county rights | 39 | 37 | 40 |
| Average age of candidates submitted for communal councils | 45 | 43 | 45 |
| Average age of candidates for reeve, mayor, president | 51 | 47 | 52 |
| Totalling | 42 | 40 | 42 |
| Submitted candidates for councils grouped by age | |||||
| Age | Number of candidates | Women | Women (%) | Men | Men (%) |
| 18-29 | 103 | 23 | 22,33% | 80 | 77,67% |
| 30-39 | 100 | 14 | 14,00% | 86 | 86,00% |
| 40-59 | 157 | 32 | 20,38% | 125 | 79,62% |
| 60+ | 64 | 7 | 10,94% | 57 | 89,06% |
| Totalling | 424 | 76 | 17,92% | 348 | 82,08% |
| Submitted candidates for reeve, mayor, president grouped by age | |||||
| Age | Number of candidates | Women | Women (%) | Men | Men (%) |
| 25-29 | 0 | 0 | - | 0 | - |
| 30-39 | 1 | 0 | 0,00% | 1 | 100,00% |
| 40-59 | 4 | 1 | 25,00% | 3 | 75,00% |
| 60+ | 1 | 0 | 0,00% | 1 | 100,00% |
| Totalling | 6 | 1 | 16,67% | 5 | 83,33% |
| The youngest and oldest submitted candidate for councils | ||
| Age | Institution | |
| Youngest | 18 | Rada Miasta Chorzów |
| Oldest | 80 | Sejmik Województwa Śląskiego |
| The youngest and oldest submitted candidate for reeve, mayor, president | ||
| Age | Institution | |
| Youngest | 37 | Wójt Gminy Godów |
| Oldest | 70 | Prezydent Miasta Rybnika |
