

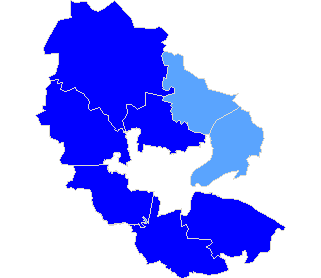
Powiat bydgoski
| Rada Powiatu Bydgoskiego |
| Submitted candidates | ||||||
| Specification | Number of candidates | Women | Women (%) | Men | Men (%) | Status |
| Constituency no. 1 | 10 | 5 | 50,00% | 5 | 50,00% | Registered |
| Constituency no. 2 | 8 | 4 | 50,00% | 4 | 50,00% | Registered |
| Constituency no. 3 | 10 | 2 | 20,00% | 8 | 80,00% | Registered |
| Constituency no. 4 | 7 | 2 | 28,57% | 5 | 71,43% | Registered |
| Constituency no. 5 | 8 | 4 | 50,00% | 4 | 50,00% | Registered |
| Totalling | 43 | 17 | 39,53% | 26 | 60,47% | |
| Age of the candidates | |||||
| Specification | Average age | Average age of women | Average age of men | Oldest | Youngest |
| Constituency no. 1 | 45 | 41 | 50 | 63 | 22 |
| Constituency no. 2 | 46 | 45 | 46 | 59 | 25 |
| Constituency no. 3 | 45 | 47 | 45 | 60 | 25 |
| Constituency no. 4 | 51 | 57 | 48 | 63 | 27 |
| Constituency no. 5 | 46 | 46 | 46 | 55 | 35 |
| The statistics of election committe |
| Lists submitted | ||
| Specification | Number of | |
| lists | councils | |
| Lists submitted for county councils | 5 | 1 |
| Lists registered for communal councils | 23 | 6 |
| Totalling | 28 | 7 |
| Submitted candidates | |||||
| Specification | Number of candidates | Women | Women (%) | Men | Men (%) |
| Number of candidates submitted for county councils | 43 | 17 | 39,53% | 26 | 60,47% |
| Number of candidates registered for communal councils | 97 | 46 | 47,42% | 51 | 52,58% |
| Number of candidates submitted for reeve, mayor and presidential elections | 2 | 0 | 0,00% | 2 | 100,00% |
| Totalling | 142 | 63 | 44,37% | 79 | 55,63% |
| Average age of submitted candidates | |||
| Specification | Average age | Average age of women | Average age of men |
| Average age of candidates submitted for county councils | 46 | 46 | 47 |
| Average age of candidates submitted for communal councils | 43 | 44 | 42 |
| Average age of candidates for reeve, mayor, president | 45 | - | 45 |
| Totalling | 43 | 44 | 43 |
| Submitted candidates for councils grouped by age | |||||
| Age | Number of candidates | Women | Women (%) | Men | Men (%) |
| 18-29 | 25 | 11 | 44,00% | 14 | 56,00% |
| 30-39 | 27 | 11 | 40,74% | 16 | 59,26% |
| 40-59 | 76 | 35 | 46,05% | 41 | 53,95% |
| 60+ | 12 | 6 | 50,00% | 6 | 50,00% |
| Totalling | 140 | 63 | 45,00% | 77 | 55,00% |
| Submitted candidates for reeve, mayor, president grouped by age | |||||
| Age | Number of candidates | Women | Women (%) | Men | Men (%) |
| 25-29 | 0 | 0 | - | 0 | - |
| 30-39 | 1 | 0 | 0,00% | 1 | 100,00% |
| 40-59 | 1 | 0 | 0,00% | 1 | 100,00% |
| 60+ | 0 | 0 | - | 0 | - |
| Totalling | 2 | 0 | 0,00% | 2 | 100,00% |
| The youngest and oldest submitted candidate for councils | ||
| Age | Institution | |
| Youngest | 19 | Rada Miejska w Koronowie |
| Oldest | 74 | Rada Miejska w Koronowie |
| The youngest and oldest submitted candidate for reeve, mayor, president | ||
| Age | Institution | |
| Youngest | 39 | Burmistrz Koronowa |
| Oldest | 52 | Wójt Gminy Osielsko |
| Rada Gminy Białe Błota |
| Submitted candidates | ||||||
| Specification | Number of candidates | Women | Women (%) | Men | Men (%) | Status |
| Constituency no. 1 | 2 | 1 | 50,00% | 1 | 50,00% | Registered |
| Constituency no. 2 | 4 | 1 | 25,00% | 3 | 75,00% | Registered |
| Constituency no. 3 | 5 | 3 | 60,00% | 2 | 40,00% | Registered |
| Constituency no. 4 | 4 | 3 | 75,00% | 1 | 25,00% | Registered |
| Totalling | 15 | 8 | 53,33% | 7 | 46,67% | |
| Age of the candidates | |||||
| Specification | Average age | Average age of women | Average age of men | Oldest | Youngest |
| Constituency no. 1 | 58 | 58 | 57 | 58 | 57 |
| Constituency no. 2 | 42 | 23 | 48 | 63 | 23 |
| Constituency no. 3 | 37 | 40 | 34 | 46 | 32 |
| Constituency no. 4 | 44 | 47 | 34 | 57 | 29 |
| The statistics of election committe |
| Lists submitted | ||
| Specification | Number of | |
| lists | councils | |
| Lists registered for communal councils | 4 | 1 |
| Totalling | 4 | 1 |
| Submitted candidates | |||||
| Specification | Number of candidates | Women | Women (%) | Men | Men (%) |
| Number of candidates registered for communal councils | 15 | 8 | 53,33% | 7 | 46,67% |
| Number of candidates submitted for reeve, mayor and presidential elections | 0 | 0 | - | 0 | - |
| Totalling | 15 | 8 | 53,33% | 7 | 46,67% |
| Average age of submitted candidates | |||
| Specification | Average age | Average age of women | Average age of men |
| Average age of candidates submitted for communal councils | 43 | 43 | 43 |
| Average age of candidates for reeve, mayor, president | - | - | - |
| Totalling | 43 | 43 | 43 |
| Submitted candidates for councils grouped by age | |||||
| Age | Number of candidates | Women | Women (%) | Men | Men (%) |
| 18-29 | 2 | 2 | 100,00% | 0 | 0,00% |
| 30-39 | 6 | 2 | 33,33% | 4 | 66,67% |
| 40-59 | 6 | 4 | 66,67% | 2 | 33,33% |
| 60+ | 1 | 0 | 0,00% | 1 | 100,00% |
| Totalling | 15 | 8 | 53,33% | 7 | 46,67% |
| Submitted candidates for reeve, mayor, president grouped by age | |||||
| Age | Number of candidates | Women | Women (%) | Men | Men (%) |
| 25-29 | 0 | 0 | - | 0 | - |
| 30-39 | 0 | 0 | - | 0 | - |
| 40-59 | 0 | 0 | - | 0 | - |
| 60+ | 0 | 0 | - | 0 | - |
| Totalling | 0 | 0 | - | 0 | - |
| The youngest and oldest submitted candidate for councils | ||
| Age | Institution | |
| Youngest | 23 | Rada Gminy Białe Błota |
| Oldest | 63 | Rada Gminy Białe Błota |
| Rada Gminy Nowa Wieś Wielka |
| Submitted candidates | ||||||
| Specification | Number of candidates | Women | Women (%) | Men | Men (%) | Status |
| Constituency no. 1 | 3 | 2 | 66,67% | 1 | 33,33% | Registered |
| Totalling | 3 | 2 | 66,67% | 1 | 33,33% | |
| Age of the candidates | |||||
| Specification | Average age | Average age of women | Average age of men | Oldest | Youngest |
| Constituency no. 1 | 28 | 32 | 20 | 32 | 20 |
| The statistics of election committe |
| Lists submitted | ||
| Specification | Number of | |
| lists | councils | |
| Lists registered for communal councils | 1 | 1 |
| Totalling | 1 | 1 |
| Submitted candidates | |||||
| Specification | Number of candidates | Women | Women (%) | Men | Men (%) |
| Number of candidates registered for communal councils | 3 | 2 | 66,67% | 1 | 33,33% |
| Number of candidates submitted for reeve, mayor and presidential elections | 0 | 0 | - | 0 | - |
| Totalling | 3 | 2 | 66,67% | 1 | 33,33% |
| Average age of submitted candidates | |||
| Specification | Average age | Average age of women | Average age of men |
| Average age of candidates submitted for communal councils | 28 | 32 | 20 |
| Average age of candidates for reeve, mayor, president | - | - | - |
| Totalling | 28 | 32 | 20 |
| Submitted candidates for councils grouped by age | |||||
| Age | Number of candidates | Women | Women (%) | Men | Men (%) |
| 18-29 | 1 | 0 | 0,00% | 1 | 100,00% |
| 30-39 | 2 | 2 | 100,00% | 0 | 0,00% |
| 40-59 | 0 | 0 | - | 0 | - |
| 60+ | 0 | 0 | - | 0 | - |
| Totalling | 3 | 2 | 66,67% | 1 | 33,33% |
| Submitted candidates for reeve, mayor, president grouped by age | |||||
| Age | Number of candidates | Women | Women (%) | Men | Men (%) |
| 25-29 | 0 | 0 | - | 0 | - |
| 30-39 | 0 | 0 | - | 0 | - |
| 40-59 | 0 | 0 | - | 0 | - |
| 60+ | 0 | 0 | - | 0 | - |
| Totalling | 0 | 0 | - | 0 | - |
| The youngest and oldest submitted candidate for councils | ||
| Age | Institution | |
| Youngest | 20 | Rada Gminy Nowa Wieś Wielka |
| Oldest | 32 | Rada Gminy Nowa Wieś Wielka |
| Wójt Gminy Osielsko |
| Number of | Family name and given names | Age | Education | Address, party membership and endorsements |
| 1 | Rzadkiewicz Ireneusz Tomasz | 52 | wyższe | Niemcz, submitted by KOMITET WYBORCZY PLATFORMA OBYWATELSKA RP, endorsed by Platforma Obywatelska RP, member of Platformy Obywatelskiej Rzeczypospolitej Polskiej |
| Rada Gminy Osielsko |
| Submitted candidates | ||||||
| Specification | Number of candidates | Women | Women (%) | Men | Men (%) | Status |
| Constituency no. 1 | 3 | 1 | 33,33% | 2 | 66,67% | Registered |
| Constituency no. 2 | 2 | 1 | 50,00% | 1 | 50,00% | Registered |
| Constituency no. 3 | 2 | 1 | 50,00% | 1 | 50,00% | Registered |
| Constituency no. 5 | 3 | 1 | 33,33% | 2 | 66,67% | Registered |
| Constituency no. 6 | 3 | 1 | 33,33% | 2 | 66,67% | Registered |
| Constituency no. 7 | 1 | 0 | 0,00% | 1 | 100,00% | Registered |
| Totalling | 14 | 5 | 35,71% | 9 | 64,29% | |
| Age of the candidates | |||||
| Specification | Average age | Average age of women | Average age of men | Oldest | Youngest |
| Constituency no. 1 | 46 | 48 | 45 | 48 | 41 |
| Constituency no. 2 | 42 | 37 | 46 | 46 | 37 |
| Constituency no. 3 | 49 | 44 | 54 | 54 | 44 |
| Constituency no. 5 | 47 | 44 | 49 | 58 | 40 |
| Constituency no. 6 | 43 | 62 | 34 | 62 | 31 |
| Constituency no. 7 | 23 | - | 23 | 23 | 23 |
| The statistics of election committe |
| Lists submitted | ||
| Specification | Number of | |
| lists | councils | |
| Lists registered for communal councils | 6 | 1 |
| Totalling | 6 | 1 |
| Submitted candidates | |||||
| Specification | Number of candidates | Women | Women (%) | Men | Men (%) |
| Number of candidates registered for communal councils | 14 | 5 | 35,71% | 9 | 64,29% |
| Number of candidates submitted for reeve, mayor and presidential elections | 1 | 0 | 0,00% | 1 | 100,00% |
| Totalling | 15 | 5 | 33,33% | 10 | 66,67% |
| Average age of submitted candidates | |||
| Specification | Average age | Average age of women | Average age of men |
| Average age of candidates submitted for communal councils | 44 | 47 | 42 |
| Average age of candidates for reeve, mayor, president | 52 | - | 52 |
| Totalling | 44 | 47 | 43 |
| Submitted candidates for councils grouped by age | |||||
| Age | Number of candidates | Women | Women (%) | Men | Men (%) |
| 18-29 | 1 | 0 | 0,00% | 1 | 100,00% |
| 30-39 | 3 | 1 | 33,33% | 2 | 66,67% |
| 40-59 | 9 | 3 | 33,33% | 6 | 66,67% |
| 60+ | 1 | 1 | 100,00% | 0 | 0,00% |
| Totalling | 14 | 5 | 35,71% | 9 | 64,29% |
| Submitted candidates for reeve, mayor, president grouped by age | |||||
| Age | Number of candidates | Women | Women (%) | Men | Men (%) |
| 25-29 | 0 | 0 | - | 0 | - |
| 30-39 | 0 | 0 | - | 0 | - |
| 40-59 | 1 | 0 | 0,00% | 1 | 100,00% |
| 60+ | 0 | 0 | - | 0 | - |
| Totalling | 1 | 0 | 0,00% | 1 | 100,00% |
| The youngest and oldest submitted candidate for councils | ||
| Age | Institution | |
| Youngest | 23 | Rada Gminy Osielsko |
| Oldest | 62 | Rada Gminy Osielsko |
| The youngest and oldest submitted candidate for reeve, mayor, president | ||
| Age | Institution | |
| Youngest | 52 | Wójt Gminy Osielsko |
| Oldest | 52 | Wójt Gminy Osielsko |
| Rada Gminy Sicienko |
| Submitted candidates | ||||||
| Specification | Number of candidates | Women | Women (%) | Men | Men (%) | Status |
| Constituency no. 1 | 3 | 1 | 33,33% | 2 | 66,67% | Registered |
| Constituency no. 3 | 4 | 2 | 50,00% | 2 | 50,00% | Registered |
| Constituency no. 4 | 1 | 0 | 0,00% | 1 | 100,00% | Registered |
| Totalling | 8 | 3 | 37,50% | 5 | 62,50% | |
| Age of the candidates | |||||
| Specification | Average age | Average age of women | Average age of men | Oldest | Youngest |
| Constituency no. 1 | 49 | 53 | 48 | 53 | 43 |
| Constituency no. 3 | 42 | 44 | 40 | 50 | 31 |
| Constituency no. 4 | 61 | - | 61 | 61 | 61 |
| The statistics of election committe |
| Lists submitted | ||
| Specification | Number of | |
| lists | councils | |
| Lists registered for communal councils | 3 | 1 |
| Totalling | 3 | 1 |
| Submitted candidates | |||||
| Specification | Number of candidates | Women | Women (%) | Men | Men (%) |
| Number of candidates registered for communal councils | 8 | 3 | 37,50% | 5 | 62,50% |
| Number of candidates submitted for reeve, mayor and presidential elections | 0 | 0 | - | 0 | - |
| Totalling | 8 | 3 | 37,50% | 5 | 62,50% |
| Average age of submitted candidates | |||
| Specification | Average age | Average age of women | Average age of men |
| Average age of candidates submitted for communal councils | 47 | 47 | 47 |
| Average age of candidates for reeve, mayor, president | - | - | - |
| Totalling | 47 | 47 | 47 |
| Submitted candidates for councils grouped by age | |||||
| Age | Number of candidates | Women | Women (%) | Men | Men (%) |
| 18-29 | 0 | 0 | - | 0 | - |
| 30-39 | 2 | 1 | 50,00% | 1 | 50,00% |
| 40-59 | 5 | 2 | 40,00% | 3 | 60,00% |
| 60+ | 1 | 0 | 0,00% | 1 | 100,00% |
| Totalling | 8 | 3 | 37,50% | 5 | 62,50% |
| Submitted candidates for reeve, mayor, president grouped by age | |||||
| Age | Number of candidates | Women | Women (%) | Men | Men (%) |
| 25-29 | 0 | 0 | - | 0 | - |
| 30-39 | 0 | 0 | - | 0 | - |
| 40-59 | 0 | 0 | - | 0 | - |
| 60+ | 0 | 0 | - | 0 | - |
| Totalling | 0 | 0 | - | 0 | - |
| The youngest and oldest submitted candidate for councils | ||
| Age | Institution | |
| Youngest | 31 | Rada Gminy Sicienko |
| Oldest | 61 | Rada Gminy Sicienko |
| Burmistrz Koronowa |
| Number of | Family name and given names | Age | Education | Address, party membership and endorsements |
| 4 | Marszelski Sławomir Stefan | 39 | wyższe | Wilcze, submitted by KOMITET WYBORCZY PLATFORMA OBYWATELSKA RP, endorsed by Platforma Obywatelska RP, not a member of any political party |
| Rada Miejska w Koronowie |
| Submitted candidates | ||||||
| Specification | Number of candidates | Women | Women (%) | Men | Men (%) | Status |
| Constituency no. 1 | 10 | 5 | 50,00% | 5 | 50,00% | Registered |
| Constituency no. 2 | 10 | 6 | 60,00% | 4 | 40,00% | Registered |
| Constituency no. 3 | 12 | 6 | 50,00% | 6 | 50,00% | Registered |
| Constituency no. 4 | 10 | 4 | 40,00% | 6 | 60,00% | Registered |
| Totalling | 42 | 21 | 50,00% | 21 | 50,00% | |
| Age of the candidates | |||||
| Specification | Average age | Average age of women | Average age of men | Oldest | Youngest |
| Constituency no. 1 | 37 | 47 | 27 | 64 | 20 |
| Constituency no. 2 | 39 | 44 | 31 | 55 | 19 |
| Constituency no. 3 | 49 | 53 | 45 | 64 | 25 |
| Constituency no. 4 | 54 | 52 | 55 | 74 | 41 |
| The statistics of election committe |
| Lists submitted | ||
| Specification | Number of | |
| lists | councils | |
| Lists registered for communal councils | 4 | 1 |
| Totalling | 4 | 1 |
| Submitted candidates | |||||
| Specification | Number of candidates | Women | Women (%) | Men | Men (%) |
| Number of candidates registered for communal councils | 42 | 21 | 50,00% | 21 | 50,00% |
| Number of candidates submitted for reeve, mayor and presidential elections | 1 | 0 | 0,00% | 1 | 100,00% |
| Totalling | 43 | 21 | 48,84% | 22 | 51,16% |
| Average age of submitted candidates | |||
| Specification | Average age | Average age of women | Average age of men |
| Average age of candidates submitted for communal councils | 45 | 49 | 41 |
| Average age of candidates for reeve, mayor, president | 39 | - | 39 |
| Totalling | 44 | 49 | 40 |
| Submitted candidates for councils grouped by age | |||||
| Age | Number of candidates | Women | Women (%) | Men | Men (%) |
| 18-29 | 10 | 2 | 20,00% | 8 | 80,00% |
| 30-39 | 3 | 2 | 66,67% | 1 | 33,33% |
| 40-59 | 24 | 14 | 58,33% | 10 | 41,67% |
| 60+ | 5 | 3 | 60,00% | 2 | 40,00% |
| Totalling | 42 | 21 | 50,00% | 21 | 50,00% |
| Submitted candidates for reeve, mayor, president grouped by age | |||||
| Age | Number of candidates | Women | Women (%) | Men | Men (%) |
| 25-29 | 0 | 0 | - | 0 | - |
| 30-39 | 1 | 0 | 0,00% | 1 | 100,00% |
| 40-59 | 0 | 0 | - | 0 | - |
| 60+ | 0 | 0 | - | 0 | - |
| Totalling | 1 | 0 | 0,00% | 1 | 100,00% |
| The youngest and oldest submitted candidate for councils | ||
| Age | Institution | |
| Youngest | 19 | Rada Miejska w Koronowie |
| Oldest | 74 | Rada Miejska w Koronowie |
| The youngest and oldest submitted candidate for reeve, mayor, president | ||
| Age | Institution | |
| Youngest | 39 | Burmistrz Koronowa |
| Oldest | 39 | Burmistrz Koronowa |
| Rada Miejska w Solcu Kujawskim |
| Submitted candidates | ||||||
| Specification | Number of candidates | Women | Women (%) | Men | Men (%) | Status |
| Constituency no. 1 | 4 | 2 | 50,00% | 2 | 50,00% | Registered |
| Constituency no. 2 | 3 | 1 | 33,33% | 2 | 66,67% | Registered |
| Constituency no. 3 | 3 | 2 | 66,67% | 1 | 33,33% | Registered |
| Constituency no. 4 | 4 | 1 | 25,00% | 3 | 75,00% | Registered |
| Constituency no. 5 | 1 | 1 | 100,00% | 0 | 0,00% | Registered |
| Totalling | 15 | 7 | 46,67% | 8 | 53,33% | |
| Age of the candidates | |||||
| Specification | Average age | Average age of women | Average age of men | Oldest | Youngest |
| Constituency no. 1 | 35 | 27 | 42 | 54 | 27 |
| Constituency no. 2 | 41 | 28 | 47 | 60 | 28 |
| Constituency no. 3 | 34 | 37 | 28 | 49 | 25 |
| Constituency no. 4 | 43 | 30 | 47 | 56 | 30 |
| Constituency no. 5 | 52 | 52 | - | 52 | 52 |
| The statistics of election committe |
| Lists submitted | ||
| Specification | Number of | |
| lists | councils | |
| Lists registered for communal councils | 5 | 1 |
| Totalling | 5 | 1 |
| Submitted candidates | |||||
| Specification | Number of candidates | Women | Women (%) | Men | Men (%) |
| Number of candidates registered for communal councils | 15 | 7 | 46,67% | 8 | 53,33% |
| Number of candidates submitted for reeve, mayor and presidential elections | 0 | 0 | - | 0 | - |
| Totalling | 15 | 7 | 46,67% | 8 | 53,33% |
| Average age of submitted candidates | |||
| Specification | Average age | Average age of women | Average age of men |
| Average age of candidates submitted for communal councils | 39 | 34 | 44 |
| Average age of candidates for reeve, mayor, president | - | - | - |
| Totalling | 39 | 34 | 44 |
| Submitted candidates for councils grouped by age | |||||
| Age | Number of candidates | Women | Women (%) | Men | Men (%) |
| 18-29 | 5 | 4 | 80,00% | 1 | 20,00% |
| 30-39 | 4 | 1 | 25,00% | 3 | 75,00% |
| 40-59 | 5 | 2 | 40,00% | 3 | 60,00% |
| 60+ | 1 | 0 | 0,00% | 1 | 100,00% |
| Totalling | 15 | 7 | 46,67% | 8 | 53,33% |
| Submitted candidates for reeve, mayor, president grouped by age | |||||
| Age | Number of candidates | Women | Women (%) | Men | Men (%) |
| 25-29 | 0 | 0 | - | 0 | - |
| 30-39 | 0 | 0 | - | 0 | - |
| 40-59 | 0 | 0 | - | 0 | - |
| 60+ | 0 | 0 | - | 0 | - |
| Totalling | 0 | 0 | - | 0 | - |
| The youngest and oldest submitted candidate for councils | ||
| Age | Institution | |
| Youngest | 25 | Rada Miejska w Solcu Kujawskim |
| Oldest | 60 | Rada Miejska w Solcu Kujawskim |
