

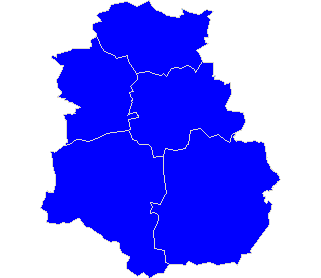
Powiat nakielski
| Rada Powiatu Nakielskiego |
| Submitted candidates | ||||||
| Specification | Number of candidates | Women | Women (%) | Men | Men (%) | Status |
| Constituency no. 1 | 14 | 4 | 28,57% | 10 | 71,43% | Registered |
| Constituency no. 2 | 6 | 1 | 16,67% | 5 | 83,33% | Registered |
| Constituency no. 3 | 6 | 1 | 16,67% | 5 | 83,33% | Registered |
| Constituency no. 4 | 12 | 3 | 25,00% | 9 | 75,00% | Registered |
| Totalling | 38 | 9 | 23,68% | 29 | 76,32% | |
| Age of the candidates | |||||
| Specification | Average age | Average age of women | Average age of men | Oldest | Youngest |
| Constituency no. 1 | 44 | 50 | 42 | 60 | 20 |
| Constituency no. 2 | 48 | 36 | 50 | 64 | 28 |
| Constituency no. 3 | 41 | 48 | 39 | 48 | 19 |
| Constituency no. 4 | 45 | 46 | 45 | 58 | 22 |
| The statistics of election committe |
| Lists submitted | ||
| Specification | Number of | |
| lists | councils | |
| Lists submitted for county councils | 4 | 1 |
| Lists registered for communal councils | 18 | 5 |
| Totalling | 22 | 6 |
| Submitted candidates | |||||
| Specification | Number of candidates | Women | Women (%) | Men | Men (%) |
| Number of candidates submitted for county councils | 38 | 9 | 23,68% | 29 | 76,32% |
| Number of candidates registered for communal councils | 109 | 43 | 39,45% | 66 | 60,55% |
| Number of candidates submitted for reeve, mayor and presidential elections | 5 | 0 | 0,00% | 5 | 100,00% |
| Totalling | 152 | 52 | 34,21% | 100 | 65,79% |
| Average age of submitted candidates | |||
| Specification | Average age | Average age of women | Average age of men |
| Average age of candidates submitted for county councils | 44 | 47 | 44 |
| Average age of candidates submitted for communal councils | 42 | 41 | 42 |
| Average age of candidates for reeve, mayor, president | 43 | - | 43 |
| Totalling | 42 | 42 | 42 |
| Submitted candidates for councils grouped by age | |||||
| Age | Number of candidates | Women | Women (%) | Men | Men (%) |
| 18-29 | 29 | 11 | 37,93% | 18 | 62,07% |
| 30-39 | 30 | 8 | 26,67% | 22 | 73,33% |
| 40-59 | 78 | 30 | 38,46% | 48 | 61,54% |
| 60+ | 10 | 3 | 30,00% | 7 | 70,00% |
| Totalling | 147 | 52 | 35,37% | 95 | 64,63% |
| Submitted candidates for reeve, mayor, president grouped by age | |||||
| Age | Number of candidates | Women | Women (%) | Men | Men (%) |
| 25-29 | 0 | 0 | - | 0 | - |
| 30-39 | 2 | 0 | 0,00% | 2 | 100,00% |
| 40-59 | 3 | 0 | 0,00% | 3 | 100,00% |
| 60+ | 0 | 0 | - | 0 | - |
| Totalling | 5 | 0 | 0,00% | 5 | 100,00% |
| The youngest and oldest submitted candidate for councils | ||
| Age | Institution | |
| Youngest | 18 | Rada Miejska w Szubinie |
| Oldest | 71 | Rada Miejska w Szubinie |
| The youngest and oldest submitted candidate for reeve, mayor, president | ||
| Age | Institution | |
| Youngest | 30 | Wójt Gminy Sadki |
| Oldest | 57 | Burmistrz Miasta i Gminy Nakło nad Notecią |
| Wójt Gminy Sadki |
| Number of | Family name and given names | Age | Education | Address, party membership and endorsements |
| 3 | Przygoda Wojciech Jan | 30 | wyższe | Olszewka, submitted by KOMITET WYBORCZY PLATFORMA OBYWATELSKA RP, not a member of any political party |
| Rada Gminy Sadki |
| Submitted candidates | ||||||
| Specification | Number of candidates | Women | Women (%) | Men | Men (%) | Status |
| Constituency no. 1 | 4 | 1 | 25,00% | 3 | 75,00% | Registered |
| Constituency no. 2 | 1 | 0 | 0,00% | 1 | 100,00% | Registered |
| Constituency no. 3 | 1 | 1 | 100,00% | 0 | 0,00% | Registered |
| Constituency no. 4 | 3 | 1 | 33,33% | 2 | 66,67% | Registered |
| Totalling | 9 | 3 | 33,33% | 6 | 66,67% | |
| Age of the candidates | |||||
| Specification | Average age | Average age of women | Average age of men | Oldest | Youngest |
| Constituency no. 1 | 35 | 29 | 37 | 51 | 20 |
| Constituency no. 2 | 50 | - | 50 | 50 | 50 |
| Constituency no. 3 | 48 | 48 | - | 48 | 48 |
| Constituency no. 4 | 36 | 35 | 37 | 46 | 28 |
| The statistics of election committe |
| Lists submitted | ||
| Specification | Number of | |
| lists | councils | |
| Lists registered for communal councils | 4 | 1 |
| Totalling | 4 | 1 |
| Submitted candidates | |||||
| Specification | Number of candidates | Women | Women (%) | Men | Men (%) |
| Number of candidates registered for communal councils | 9 | 3 | 33,33% | 6 | 66,67% |
| Number of candidates submitted for reeve, mayor and presidential elections | 1 | 0 | 0,00% | 1 | 100,00% |
| Totalling | 10 | 3 | 30,00% | 7 | 70,00% |
| Average age of submitted candidates | |||
| Specification | Average age | Average age of women | Average age of men |
| Average age of candidates submitted for communal councils | 38 | 37 | 39 |
| Average age of candidates for reeve, mayor, president | 30 | - | 30 |
| Totalling | 37 | 37 | 37 |
| Submitted candidates for councils grouped by age | |||||
| Age | Number of candidates | Women | Women (%) | Men | Men (%) |
| 18-29 | 3 | 1 | 33,33% | 2 | 66,67% |
| 30-39 | 2 | 1 | 50,00% | 1 | 50,00% |
| 40-59 | 4 | 1 | 25,00% | 3 | 75,00% |
| 60+ | 0 | 0 | - | 0 | - |
| Totalling | 9 | 3 | 33,33% | 6 | 66,67% |
| Submitted candidates for reeve, mayor, president grouped by age | |||||
| Age | Number of candidates | Women | Women (%) | Men | Men (%) |
| 25-29 | 0 | 0 | - | 0 | - |
| 30-39 | 1 | 0 | 0,00% | 1 | 100,00% |
| 40-59 | 0 | 0 | - | 0 | - |
| 60+ | 0 | 0 | - | 0 | - |
| Totalling | 1 | 0 | 0,00% | 1 | 100,00% |
| The youngest and oldest submitted candidate for councils | ||
| Age | Institution | |
| Youngest | 20 | Rada Gminy Sadki |
| Oldest | 51 | Rada Gminy Sadki |
| The youngest and oldest submitted candidate for reeve, mayor, president | ||
| Age | Institution | |
| Youngest | 30 | Wójt Gminy Sadki |
| Oldest | 30 | Wójt Gminy Sadki |
| Burmistrz Kcyni |
| Number of | Family name and given names | Age | Education | Address, party membership and endorsements |
| 2 | Pezacki Mirosław | 38 | wyższe | Kcynia, submitted by KOMITET WYBORCZY PLATFORMA OBYWATELSKA RP, not a member of any political party |
| Rada Miejska w Kcyni |
| Submitted candidates | ||||||
| Specification | Number of candidates | Women | Women (%) | Men | Men (%) | Status |
| Constituency no. 1 | 5 | 2 | 40,00% | 3 | 60,00% | Registered |
| Constituency no. 2 | 5 | 0 | 0,00% | 5 | 100,00% | Registered |
| Constituency no. 3 | 2 | 1 | 50,00% | 1 | 50,00% | Registered |
| Totalling | 12 | 3 | 25,00% | 9 | 75,00% | |
| Age of the candidates | |||||
| Specification | Average age | Average age of women | Average age of men | Oldest | Youngest |
| Constituency no. 1 | 47 | 56 | 42 | 63 | 31 |
| Constituency no. 2 | 33 | - | 33 | 58 | 24 |
| Constituency no. 3 | 43 | 35 | 51 | 51 | 35 |
| The statistics of election committe |
| Lists submitted | ||
| Specification | Number of | |
| lists | councils | |
| Lists registered for communal councils | 3 | 1 |
| Totalling | 3 | 1 |
| Submitted candidates | |||||
| Specification | Number of candidates | Women | Women (%) | Men | Men (%) |
| Number of candidates registered for communal councils | 12 | 3 | 25,00% | 9 | 75,00% |
| Number of candidates submitted for reeve, mayor and presidential elections | 1 | 0 | 0,00% | 1 | 100,00% |
| Totalling | 13 | 3 | 23,08% | 10 | 76,92% |
| Average age of submitted candidates | |||
| Specification | Average age | Average age of women | Average age of men |
| Average age of candidates submitted for communal councils | 41 | 49 | 38 |
| Average age of candidates for reeve, mayor, president | 38 | - | 38 |
| Totalling | 40 | 49 | 38 |
| Submitted candidates for councils grouped by age | |||||
| Age | Number of candidates | Women | Women (%) | Men | Men (%) |
| 18-29 | 3 | 0 | 0,00% | 3 | 100,00% |
| 30-39 | 4 | 1 | 25,00% | 3 | 75,00% |
| 40-59 | 4 | 1 | 25,00% | 3 | 75,00% |
| 60+ | 1 | 1 | 100,00% | 0 | 0,00% |
| Totalling | 12 | 3 | 25,00% | 9 | 75,00% |
| Submitted candidates for reeve, mayor, president grouped by age | |||||
| Age | Number of candidates | Women | Women (%) | Men | Men (%) |
| 25-29 | 0 | 0 | - | 0 | - |
| 30-39 | 1 | 0 | 0,00% | 1 | 100,00% |
| 40-59 | 0 | 0 | - | 0 | - |
| 60+ | 0 | 0 | - | 0 | - |
| Totalling | 1 | 0 | 0,00% | 1 | 100,00% |
| The youngest and oldest submitted candidate for councils | ||
| Age | Institution | |
| Youngest | 24 | Rada Miejska w Kcyni |
| Oldest | 63 | Rada Miejska w Kcyni |
| The youngest and oldest submitted candidate for reeve, mayor, president | ||
| Age | Institution | |
| Youngest | 38 | Burmistrz Kcyni |
| Oldest | 38 | Burmistrz Kcyni |
| Burmistrz Miasta i Gminy Mrocza |
| Number of | Family name and given names | Age | Education | Address, party membership and endorsements |
| 2 | Miler Jarosław Hieronim | 48 | Wyższe | Kosowo, submitted by KOMITET WYBORCZY PLATFORMA OBYWATELSKA RP, member of Platformy Obywatelskiej Rzeczypospolitej Polskiej |
| Rada Miejska w Mroczy |
| Submitted candidates | ||||||
| Specification | Number of candidates | Women | Women (%) | Men | Men (%) | Status |
| Constituency no. 1 | 5 | 1 | 20,00% | 4 | 80,00% | Registered |
| Constituency no. 2 | 2 | 0 | 0,00% | 2 | 100,00% | Registered |
| Constituency no. 3 | 1 | 1 | 100,00% | 0 | 0,00% | Registered |
| Constituency no. 4 | 1 | 1 | 100,00% | 0 | 0,00% | Registered |
| Totalling | 9 | 3 | 33,33% | 6 | 66,67% | |
| Age of the candidates | |||||
| Specification | Average age | Average age of women | Average age of men | Oldest | Youngest |
| Constituency no. 1 | 50 | 53 | 49 | 57 | 30 |
| Constituency no. 2 | 36 | - | 36 | 37 | 35 |
| Constituency no. 3 | 22 | 22 | - | 22 | 22 |
| Constituency no. 4 | 42 | 42 | - | 42 | 42 |
| The statistics of election committe |
| Lists submitted | ||
| Specification | Number of | |
| lists | councils | |
| Lists registered for communal councils | 4 | 1 |
| Totalling | 4 | 1 |
| Submitted candidates | |||||
| Specification | Number of candidates | Women | Women (%) | Men | Men (%) |
| Number of candidates registered for communal councils | 9 | 3 | 33,33% | 6 | 66,67% |
| Number of candidates submitted for reeve, mayor and presidential elections | 1 | 0 | 0,00% | 1 | 100,00% |
| Totalling | 10 | 3 | 30,00% | 7 | 70,00% |
| Average age of submitted candidates | |||
| Specification | Average age | Average age of women | Average age of men |
| Average age of candidates submitted for communal councils | 43 | 39 | 45 |
| Average age of candidates for reeve, mayor, president | 48 | - | 48 |
| Totalling | 43 | 39 | 45 |
| Submitted candidates for councils grouped by age | |||||
| Age | Number of candidates | Women | Women (%) | Men | Men (%) |
| 18-29 | 1 | 1 | 100,00% | 0 | 0,00% |
| 30-39 | 3 | 0 | 0,00% | 3 | 100,00% |
| 40-59 | 5 | 2 | 40,00% | 3 | 60,00% |
| 60+ | 0 | 0 | - | 0 | - |
| Totalling | 9 | 3 | 33,33% | 6 | 66,67% |
| Submitted candidates for reeve, mayor, president grouped by age | |||||
| Age | Number of candidates | Women | Women (%) | Men | Men (%) |
| 25-29 | 0 | 0 | - | 0 | - |
| 30-39 | 0 | 0 | - | 0 | - |
| 40-59 | 1 | 0 | 0,00% | 1 | 100,00% |
| 60+ | 0 | 0 | - | 0 | - |
| Totalling | 1 | 0 | 0,00% | 1 | 100,00% |
| The youngest and oldest submitted candidate for councils | ||
| Age | Institution | |
| Youngest | 22 | Rada Miejska w Mroczy |
| Oldest | 57 | Rada Miejska w Mroczy |
| The youngest and oldest submitted candidate for reeve, mayor, president | ||
| Age | Institution | |
| Youngest | 48 | Burmistrz Miasta i Gminy Mrocza |
| Oldest | 48 | Burmistrz Miasta i Gminy Mrocza |
| Burmistrz Miasta i Gminy Nakło nad Notecią |
| Number of | Family name and given names | Age | Education | Address, party membership and endorsements |
| 2 | Kinderman Andrzej | 57 | wyższe | Nakło nad Notecią, submitted by KOMITET WYBORCZY PLATFORMA OBYWATELSKA RP, member of Platformy Obywatelskiej Rzeczypospolitej Polskiej |
| Rada Miejska w Nakle nad Notecią |
| Submitted candidates | ||||||
| Specification | Number of candidates | Women | Women (%) | Men | Men (%) | Status |
| Constituency no. 1 | 14 | 7 | 50,00% | 7 | 50,00% | Registered |
| Constituency no. 2 | 10 | 4 | 40,00% | 6 | 60,00% | Registered |
| Constituency no. 3 | 15 | 8 | 53,33% | 7 | 46,67% | Registered |
| Totalling | 39 | 19 | 48,72% | 20 | 51,28% | |
| Age of the candidates | |||||
| Specification | Average age | Average age of women | Average age of men | Oldest | Youngest |
| Constituency no. 1 | 43 | 46 | 39 | 63 | 23 |
| Constituency no. 2 | 39 | 35 | 42 | 58 | 19 |
| Constituency no. 3 | 44 | 45 | 44 | 58 | 28 |
| The statistics of election committe |
| Lists submitted | ||
| Specification | Number of | |
| lists | councils | |
| Lists registered for communal councils | 3 | 1 |
| Totalling | 3 | 1 |
| Submitted candidates | |||||
| Specification | Number of candidates | Women | Women (%) | Men | Men (%) |
| Number of candidates registered for communal councils | 39 | 19 | 48,72% | 20 | 51,28% |
| Number of candidates submitted for reeve, mayor and presidential elections | 1 | 0 | 0,00% | 1 | 100,00% |
| Totalling | 40 | 19 | 47,50% | 21 | 52,50% |
| Average age of submitted candidates | |||
| Specification | Average age | Average age of women | Average age of men |
| Average age of candidates submitted for communal councils | 42 | 43 | 42 |
| Average age of candidates for reeve, mayor, president | 57 | - | 57 |
| Totalling | 42 | 43 | 42 |
| Submitted candidates for councils grouped by age | |||||
| Age | Number of candidates | Women | Women (%) | Men | Men (%) |
| 18-29 | 10 | 5 | 50,00% | 5 | 50,00% |
| 30-39 | 3 | 0 | 0,00% | 3 | 100,00% |
| 40-59 | 25 | 13 | 52,00% | 12 | 48,00% |
| 60+ | 1 | 1 | 100,00% | 0 | 0,00% |
| Totalling | 39 | 19 | 48,72% | 20 | 51,28% |
| Submitted candidates for reeve, mayor, president grouped by age | |||||
| Age | Number of candidates | Women | Women (%) | Men | Men (%) |
| 25-29 | 0 | 0 | - | 0 | - |
| 30-39 | 0 | 0 | - | 0 | - |
| 40-59 | 1 | 0 | 0,00% | 1 | 100,00% |
| 60+ | 0 | 0 | - | 0 | - |
| Totalling | 1 | 0 | 0,00% | 1 | 100,00% |
| The youngest and oldest submitted candidate for councils | ||
| Age | Institution | |
| Youngest | 19 | Rada Miejska w Nakle nad Notecią |
| Oldest | 63 | Rada Miejska w Nakle nad Notecią |
| The youngest and oldest submitted candidate for reeve, mayor, president | ||
| Age | Institution | |
| Youngest | 57 | Burmistrz Miasta i Gminy Nakło nad Notecią |
| Oldest | 57 | Burmistrz Miasta i Gminy Nakło nad Notecią |
| Burmistrz Szubina |
| Number of | Family name and given names | Age | Education | Address, party membership and endorsements |
| 1 | Michalak Artur Jan | 43 | wyższe | Rynarzewo, submitted by KOMITET WYBORCZY PLATFORMA OBYWATELSKA RP, member of Platformy Obywatelskiej Rzeczypospolitej Polskiej |
| Rada Miejska w Szubinie |
| Submitted candidates | ||||||
| Specification | Number of candidates | Women | Women (%) | Men | Men (%) | Status |
| Constituency no. 1 | 8 | 0 | 0,00% | 8 | 100,00% | Registered |
| Constituency no. 2 | 10 | 2 | 20,00% | 8 | 80,00% | Registered |
| Constituency no. 3 | 10 | 6 | 60,00% | 4 | 40,00% | Registered |
| Constituency no. 4 | 12 | 7 | 58,33% | 5 | 41,67% | Registered |
| Totalling | 40 | 15 | 37,50% | 25 | 62,50% | |
| Age of the candidates | |||||
| Specification | Average age | Average age of women | Average age of men | Oldest | Youngest |
| Constituency no. 1 | 44 | - | 44 | 59 | 30 |
| Constituency no. 2 | 46 | 32 | 49 | 63 | 27 |
| Constituency no. 3 | 41 | 41 | 40 | 71 | 18 |
| Constituency no. 4 | 41 | 40 | 43 | 62 | 21 |
| The statistics of election committe |
| Lists submitted | ||
| Specification | Number of | |
| lists | councils | |
| Lists registered for communal councils | 4 | 1 |
| Totalling | 4 | 1 |
| Submitted candidates | |||||
| Specification | Number of candidates | Women | Women (%) | Men | Men (%) |
| Number of candidates registered for communal councils | 40 | 15 | 37,50% | 25 | 62,50% |
| Number of candidates submitted for reeve, mayor and presidential elections | 1 | 0 | 0,00% | 1 | 100,00% |
| Totalling | 41 | 15 | 36,59% | 26 | 63,41% |
| Average age of submitted candidates | |||
| Specification | Average age | Average age of women | Average age of men |
| Average age of candidates submitted for communal councils | 43 | 40 | 45 |
| Average age of candidates for reeve, mayor, president | 43 | - | 43 |
| Totalling | 43 | 40 | 44 |
| Submitted candidates for councils grouped by age | |||||
| Age | Number of candidates | Women | Women (%) | Men | Men (%) |
| 18-29 | 6 | 3 | 50,00% | 3 | 50,00% |
| 30-39 | 13 | 5 | 38,46% | 8 | 61,54% |
| 40-59 | 16 | 7 | 43,75% | 9 | 56,25% |
| 60+ | 5 | 0 | 0,00% | 5 | 100,00% |
| Totalling | 40 | 15 | 37,50% | 25 | 62,50% |
| Submitted candidates for reeve, mayor, president grouped by age | |||||
| Age | Number of candidates | Women | Women (%) | Men | Men (%) |
| 25-29 | 0 | 0 | - | 0 | - |
| 30-39 | 0 | 0 | - | 0 | - |
| 40-59 | 1 | 0 | 0,00% | 1 | 100,00% |
| 60+ | 0 | 0 | - | 0 | - |
| Totalling | 1 | 0 | 0,00% | 1 | 100,00% |
| The youngest and oldest submitted candidate for councils | ||
| Age | Institution | |
| Youngest | 18 | Rada Miejska w Szubinie |
| Oldest | 71 | Rada Miejska w Szubinie |
| The youngest and oldest submitted candidate for reeve, mayor, president | ||
| Age | Institution | |
| Youngest | 43 | Burmistrz Szubina |
| Oldest | 43 | Burmistrz Szubina |
