

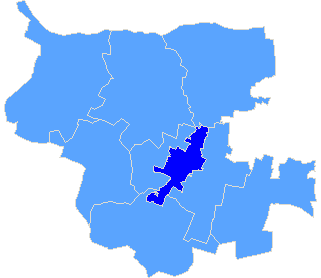
Powiat sochaczewski
| Rada Powiatu w Sochaczewie |
| Submitted candidates | ||||||
| Specification | Number of candidates | Women | Women (%) | Men | Men (%) | Status |
| Constituency no. 3 | 15 | 5 | 33,33% | 10 | 66,67% | Registered |
| Totalling | 15 | 5 | 33,33% | 10 | 66,67% | |
| Age of the candidates | |||||
| Specification | Average age | Average age of women | Average age of men | Oldest | Youngest |
| Constituency no. 3 | 44 | 47 | 43 | 64 | 28 |
| The statistics of election committe |
| Lists submitted | ||
| Specification | Number of | |
| lists | councils | |
| Lists submitted for county councils | 1 | 1 |
| Lists registered for communal councils | 4 | 1 |
| Totalling | 5 | 2 |
| Submitted candidates | |||||
| Specification | Number of candidates | Women | Women (%) | Men | Men (%) |
| Number of candidates submitted for county councils | 15 | 5 | 33,33% | 10 | 66,67% |
| Number of candidates registered for communal councils | 30 | 10 | 33,33% | 20 | 66,67% |
| Number of candidates submitted for reeve, mayor and presidential elections | 1 | 1 | 100,00% | 0 | 0,00% |
| Totalling | 46 | 16 | 34,78% | 30 | 65,22% |
| Average age of submitted candidates | |||
| Specification | Average age | Average age of women | Average age of men |
| Average age of candidates submitted for county councils | 44 | 47 | 43 |
| Average age of candidates submitted for communal councils | 44 | 45 | 43 |
| Average age of candidates for reeve, mayor, president | 49 | 49 | - |
| Totalling | 44 | 45 | 43 |
| Submitted candidates for councils grouped by age | |||||
| Age | Number of candidates | Women | Women (%) | Men | Men (%) |
| 18-29 | 11 | 2 | 18,18% | 9 | 81,82% |
| 30-39 | 7 | 2 | 28,57% | 5 | 71,43% |
| 40-59 | 21 | 9 | 42,86% | 12 | 57,14% |
| 60+ | 6 | 2 | 33,33% | 4 | 66,67% |
| Totalling | 45 | 15 | 33,33% | 30 | 66,67% |
| Submitted candidates for reeve, mayor, president grouped by age | |||||
| Age | Number of candidates | Women | Women (%) | Men | Men (%) |
| 25-29 | 0 | 0 | - | 0 | - |
| 30-39 | 0 | 0 | - | 0 | - |
| 40-59 | 1 | 1 | 100,00% | 0 | 0,00% |
| 60+ | 0 | 0 | - | 0 | - |
| Totalling | 1 | 1 | 100,00% | 0 | 0,00% |
| The youngest and oldest submitted candidate for councils | ||
| Age | Institution | |
| Youngest | 25 | Rada Miejska w Sochaczewie |
| Oldest | 64 | Rada Powiatu w Sochaczewie |
| The youngest and oldest submitted candidate for reeve, mayor, president | ||
| Age | Institution | |
| Youngest | 49 | Burmistrz Miasta Sochaczew |
| Oldest | 49 | Burmistrz Miasta Sochaczew |
| Burmistrz Miasta Sochaczew |
| Number of | Family name and given names | Age | Education | Address, party membership and endorsements |
| 6 | Pawlak Urszula Henryka | 49 | wyższe | Sochaczew, submitted by KOMITET WYBORCZY PLATFORMA OBYWATELSKA RP, member of Platformy Obywatelskiej Rzeczypospolitej Polskiej |
| Rada Miejska w Sochaczewie |
| Submitted candidates | ||||||
| Specification | Number of candidates | Women | Women (%) | Men | Men (%) | Status |
| Constituency no. 1 | 9 | 3 | 33,33% | 6 | 66,67% | Registered |
| Constituency no. 2 | 6 | 5 | 83,33% | 1 | 16,67% | Registered |
| Constituency no. 3 | 7 | 1 | 14,29% | 6 | 85,71% | Registered |
| Constituency no. 4 | 8 | 1 | 12,50% | 7 | 87,50% | Registered |
| Totalling | 30 | 10 | 33,33% | 20 | 66,67% | |
| Age of the candidates | |||||
| Specification | Average age | Average age of women | Average age of men | Oldest | Youngest |
| Constituency no. 1 | 49 | 54 | 47 | 62 | 27 |
| Constituency no. 2 | 41 | 44 | 29 | 61 | 26 |
| Constituency no. 3 | 42 | 32 | 44 | 62 | 26 |
| Constituency no. 4 | 40 | 41 | 40 | 60 | 25 |
| The statistics of election committe |
| Lists submitted | ||
| Specification | Number of | |
| lists | councils | |
| Lists registered for communal councils | 4 | 1 |
| Totalling | 4 | 1 |
| Submitted candidates | |||||
| Specification | Number of candidates | Women | Women (%) | Men | Men (%) |
| Number of candidates registered for communal councils | 30 | 10 | 33,33% | 20 | 66,67% |
| Number of candidates submitted for reeve, mayor and presidential elections | 1 | 1 | 100,00% | 0 | 0,00% |
| Totalling | 31 | 11 | 35,48% | 20 | 64,52% |
| Average age of submitted candidates | |||
| Specification | Average age | Average age of women | Average age of men |
| Average age of candidates submitted for communal councils | 44 | 45 | 43 |
| Average age of candidates for reeve, mayor, president | 49 | 49 | - |
| Totalling | 44 | 45 | 43 |
| Submitted candidates for councils grouped by age | |||||
| Age | Number of candidates | Women | Women (%) | Men | Men (%) |
| 18-29 | 8 | 1 | 12,50% | 7 | 87,50% |
| 30-39 | 4 | 2 | 50,00% | 2 | 50,00% |
| 40-59 | 14 | 6 | 42,86% | 8 | 57,14% |
| 60+ | 4 | 1 | 25,00% | 3 | 75,00% |
| Totalling | 30 | 10 | 33,33% | 20 | 66,67% |
| Submitted candidates for reeve, mayor, president grouped by age | |||||
| Age | Number of candidates | Women | Women (%) | Men | Men (%) |
| 25-29 | 0 | 0 | - | 0 | - |
| 30-39 | 0 | 0 | - | 0 | - |
| 40-59 | 1 | 1 | 100,00% | 0 | 0,00% |
| 60+ | 0 | 0 | - | 0 | - |
| Totalling | 1 | 1 | 100,00% | 0 | 0,00% |
| The youngest and oldest submitted candidate for councils | ||
| Age | Institution | |
| Youngest | 25 | Rada Miejska w Sochaczewie |
| Oldest | 62 | Rada Miejska w Sochaczewie |
| The youngest and oldest submitted candidate for reeve, mayor, president | ||
| Age | Institution | |
| Youngest | 49 | Burmistrz Miasta Sochaczew |
| Oldest | 49 | Burmistrz Miasta Sochaczew |
