

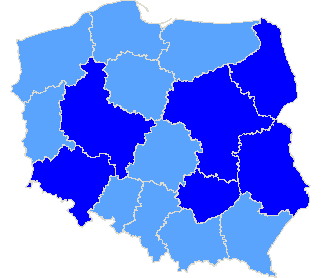
Rzeczpospolita Polska
| The statistics of election committe |
| Lists submitted | ||
| Specification | Number of | |
| lists | councils | |
| Lists submitted for provinces councils | 10 | 2 |
| Lists submitted for county councils | 28 | 7 |
| Lists submitted for councils of cities holding county rights | 4 | 1 |
| Lists submitted for districts councils of the cap. city of Warsaw | 0 | 0 |
| Lists registered for communal councils | 227 | 63 |
| Totalling | 269 | 73 |
| Submitted candidates | |||||
| Specification | Number of candidates | Women | Women (%) | Men | Men (%) |
| Number of candidates submitted for the province council | 85 | 27 | 31,76% | 58 | 68,24% |
| Number of candidates submitted for county councils | 161 | 58 | 36,02% | 103 | 63,98% |
| Number of candidates submitted for councils of cities holding county rights | 33 | 14 | 42,42% | 19 | 57,58% |
| Number of candidates submitted for districts councils of the cap. city of Warsaw | 0 | 0 | - | 0 | - |
| Number of candidates registered for communal councils | 367 | 114 | 31,06% | 253 | 68,94% |
| Number of candidates submitted for reeve, mayor and presidential elections | 17 | 0 | 0,00% | 17 | 100,00% |
| Totalling | 663 | 213 | 32,13% | 450 | 67,87% |
| Average age of submitted candidates | |||
| Specification | Average age | Average age of women | Average age of men |
| Average age of candidates submitted for the province council | 48 | 46 | 48 |
| Average age of candidates submitted for county councils | 42 | 41 | 44 |
| Average age of candidates for councils of cities holding county rights | 55 | 59 | 51 |
| Average age of candidates submitted for communal councils | 42 | 41 | 43 |
| Average age of candidates for reeve, mayor, president | 47 | - | 47 |
| Totalling | 43 | 42 | 44 |
| Submitted candidates for councils grouped by age | |||||
| Age | Number of candidates | Women | Women (%) | Men | Men (%) |
| 18-29 | 110 | 36 | 32,73% | 74 | 67,27% |
| 30-39 | 126 | 50 | 39,68% | 76 | 60,32% |
| 40-59 | 322 | 104 | 32,30% | 218 | 67,70% |
| 60+ | 88 | 23 | 26,14% | 65 | 73,86% |
| Totalling | 646 | 213 | 32,97% | 433 | 67,03% |
| Submitted candidates for reeve, mayor, president grouped by age | |||||
| Age | Number of candidates | Women | Women (%) | Men | Men (%) |
| 25-29 | 1 | 0 | 0,00% | 1 | 100,00% |
| 30-39 | 3 | 0 | 0,00% | 3 | 100,00% |
| 40-59 | 11 | 0 | 0,00% | 11 | 100,00% |
| 60+ | 2 | 0 | 0,00% | 2 | 100,00% |
| Totalling | 17 | 0 | 0,00% | 17 | 100,00% |
| The youngest and oldest submitted candidate for councils | ||
| Age | Institution | |
| Youngest | 18 | Rada Gminy Krzczonów |
| Oldest | 82 | Rada Miasta Lublin |
| The youngest and oldest submitted candidate for reeve, mayor, president | ||
| Age | Institution | |
| Youngest | 29 | Wójt Gminy Zamość |
| Oldest | 61 | Prezydent Miasta Lublin |
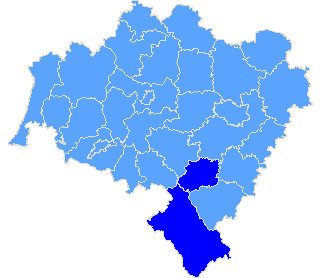
Province dolnośląskie
| Specification |
| pow. dzierżoniowski |
| pow. kłodzki |
| The statistics of election committe |
| Lists submitted | ||
| Specification | Number of | |
| lists | councils | |
| Lists submitted for province council | 0 | 0 |
| Lists submitted for county councils | 0 | 0 |
| Lists submitted for councils of cities holding county rights | 0 | 0 |
| Lists registered for communal councils | 6 | 2 |
| Totalling | 6 | 2 |
| Submitted candidates | |||||
| Specification | Number of candidates | Women | Women (%) | Men | Men (%) |
| Number of candidates submitted for the province council | 0 | 0 | - | 0 | - |
| Number of candidates submitted for county councils | 0 | 0 | - | 0 | - |
| Number of candidates submitted for councils of cities holding county rights | 0 | 0 | - | 0 | - |
| Number of candidates registered for communal councils | 12 | 5 | 41,67% | 7 | 58,33% |
| Number of candidates submitted for reeve, mayor and presidential elections | 1 | 0 | 0,00% | 1 | 100,00% |
| Totalling | 13 | 5 | 38,46% | 8 | 61,54% |
| Average age of submitted candidates | |||
| Specification | Average age | Average age of women | Average age of men |
| Average age of candidates submitted for the province council | - | - | - |
| Average age of candidates submitted for county councils | - | - | - |
| Average age of candidates for councils of cities holding county rights | - | - | - |
| Average age of candidates submitted for communal councils | 44 | 45 | 44 |
| Average age of candidates for reeve, mayor, president | 61 | - | 61 |
| Totalling | 45 | 45 | 46 |
| Submitted candidates for councils grouped by age | |||||
| Age | Number of candidates | Women | Women (%) | Men | Men (%) |
| 18-29 | 2 | 0 | 0,00% | 2 | 100,00% |
| 30-39 | 3 | 2 | 66,67% | 1 | 33,33% |
| 40-59 | 5 | 2 | 40,00% | 3 | 60,00% |
| 60+ | 2 | 1 | 50,00% | 1 | 50,00% |
| Totalling | 12 | 5 | 41,67% | 7 | 58,33% |
| Submitted candidates for reeve, mayor, president grouped by age | |||||
| Age | Number of candidates | Women | Women (%) | Men | Men (%) |
| 25-29 | 0 | 0 | - | 0 | - |
| 30-39 | 0 | 0 | - | 0 | - |
| 40-59 | 0 | 0 | - | 0 | - |
| 60+ | 1 | 0 | 0,00% | 1 | 100,00% |
| Totalling | 1 | 0 | 0,00% | 1 | 100,00% |
| The youngest and oldest submitted candidate for councils | ||
| Age | Institution | |
| Youngest | 22 | Rada Gminy Łagiewniki |
| Oldest | 67 | Rada Gminy Łagiewniki |
| The youngest and oldest submitted candidate for reeve, mayor, president | ||
| Age | Institution | |
| Youngest | 61 | Wójt Gminy Łagiewniki |
| Oldest | 61 | Wójt Gminy Łagiewniki |
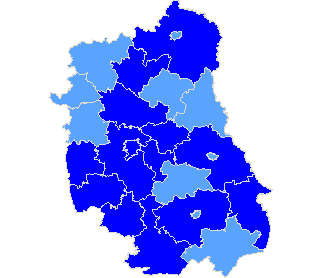
Province lubelskie
| Sejmik Województwa Lubelskiego |
| Submitted candidates | ||||||
| Specification | Number of candidates | Women | Women (%) | Men | Men (%) | Status |
| Constituency no. 1 | 10 | 2 | 20,00% | 8 | 80,00% | Registered |
| Constituency no. 2 | 14 | 5 | 35,71% | 9 | 64,29% | Registered |
| Constituency no. 3 | 7 | 1 | 14,29% | 6 | 85,71% | Registered |
| Constituency no. 4 | 7 | 4 | 57,14% | 3 | 42,86% | Registered |
| Constituency no. 5 | 14 | 4 | 28,57% | 10 | 71,43% | Registered |
| Totalling | 52 | 16 | 30,77% | 36 | 69,23% | |
| Age of the candidates | |||||
| Specification | Average age | Average age of women | Average age of men | Oldest | Youngest |
| Constituency no. 1 | 48 | 63 | 44 | 75 | 19 |
| Constituency no. 2 | 52 | 49 | 53 | 70 | 27 |
| Constituency no. 3 | 42 | 38 | 42 | 57 | 24 |
| Constituency no. 4 | 42 | 40 | 45 | 53 | 23 |
| Constituency no. 5 | 46 | 41 | 48 | 80 | 20 |
| The statistics of election committe |
| Lists submitted | ||
| Specification | Number of | |
| lists | councils | |
| Lists submitted for province council | 5 | 1 |
| Lists submitted for county councils | 24 | 6 |
| Lists submitted for councils of cities holding county rights | 4 | 1 |
| Lists registered for communal councils | 173 | 50 |
| Totalling | 206 | 58 |
| Submitted candidates | |||||
| Specification | Number of candidates | Women | Women (%) | Men | Men (%) |
| Number of candidates submitted for the province council | 52 | 16 | 30,77% | 36 | 69,23% |
| Number of candidates submitted for county councils | 129 | 50 | 38,76% | 79 | 61,24% |
| Number of candidates submitted for councils of cities holding county rights | 33 | 14 | 42,42% | 19 | 57,58% |
| Number of candidates registered for communal councils | 254 | 88 | 34,65% | 166 | 65,35% |
| Number of candidates submitted for reeve, mayor and presidential elections | 12 | 0 | 0,00% | 12 | 100,00% |
| Totalling | 480 | 168 | 35,00% | 312 | 65,00% |
| Average age of submitted candidates | |||
| Specification | Average age | Average age of women | Average age of men |
| Average age of candidates submitted for the province council | 47 | 46 | 47 |
| Average age of candidates submitted for county councils | 42 | 41 | 44 |
| Average age of candidates for councils of cities holding county rights | 55 | 59 | 51 |
| Average age of candidates submitted for communal councils | 42 | 42 | 42 |
| Average age of candidates for reeve, mayor, president | 46 | - | 46 |
| Totalling | 43 | 43 | 43 |
| Submitted candidates for councils grouped by age | |||||
| Age | Number of candidates | Women | Women (%) | Men | Men (%) |
| 18-29 | 90 | 31 | 34,44% | 59 | 65,56% |
| 30-39 | 85 | 35 | 41,18% | 50 | 58,82% |
| 40-59 | 231 | 83 | 35,93% | 148 | 64,07% |
| 60+ | 62 | 19 | 30,65% | 43 | 69,35% |
| Totalling | 468 | 168 | 35,90% | 300 | 64,10% |
| Submitted candidates for reeve, mayor, president grouped by age | |||||
| Age | Number of candidates | Women | Women (%) | Men | Men (%) |
| 25-29 | 1 | 0 | 0,00% | 1 | 100,00% |
| 30-39 | 2 | 0 | 0,00% | 2 | 100,00% |
| 40-59 | 8 | 0 | 0,00% | 8 | 100,00% |
| 60+ | 1 | 0 | 0,00% | 1 | 100,00% |
| Totalling | 12 | 0 | 0,00% | 12 | 100,00% |
| The youngest and oldest submitted candidate for councils | ||
| Age | Institution | |
| Youngest | 18 | Rada Gminy Krzczonów |
| Oldest | 82 | Rada Miasta Lublin |
| The youngest and oldest submitted candidate for reeve, mayor, president | ||
| Age | Institution | |
| Youngest | 29 | Wójt Gminy Zamość |
| Oldest | 61 | Prezydent Miasta Lublin |
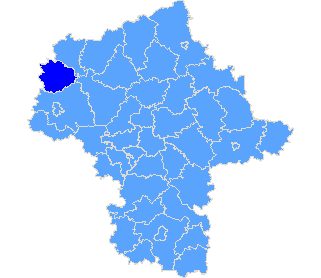
Province mazowieckie
| Specification |
| pow. sierpecki |
| The statistics of election committe |
| Lists submitted | ||
| Specification | Number of | |
| lists | councils | |
| Lists submitted for province council | 0 | 0 |
| Lists submitted for county councils | 0 | 0 |
| Lists submitted for councils of cities holding county rights | 0 | 0 |
| Lists submitted for districts councils of the cap. city of Warsaw | 0 | 0 |
| Lists registered for communal councils | 1 | 1 |
| Totalling | 1 | 1 |
| Submitted candidates | |||||
| Specification | Number of candidates | Women | Women (%) | Men | Men (%) |
| Number of candidates submitted for the province council | 0 | 0 | - | 0 | - |
| Number of candidates submitted for county councils | 0 | 0 | - | 0 | - |
| Number of candidates submitted for councils of cities holding county rights | 0 | 0 | - | 0 | - |
| Number of candidates submitted for districts councils of the cap. city of Warsaw | 0 | 0 | - | 0 | - |
| Number of candidates registered for communal councils | 1 | 1 | 100,00% | 0 | 0,00% |
| Number of candidates submitted for reeve, mayor and presidential elections | 0 | 0 | - | 0 | - |
| Totalling | 1 | 1 | 100,00% | 0 | 0,00% |
| Average age of submitted candidates | |||
| Specification | Average age | Average age of women | Average age of men |
| Average age of candidates submitted for the province council | - | - | - |
| Average age of candidates submitted for county councils | - | - | - |
| Average age of candidates for councils of cities holding county rights | - | - | - |
| Average age of candidates for districts councils of the cap. city of Warsaw | - | - | - |
| Average age of candidates submitted for communal councils | 60 | 60 | - |
| Average age of candidates for reeve, mayor, president | - | - | - |
| Totalling | 60 | 60 | - |
| Submitted candidates for councils grouped by age | |||||
| Age | Number of candidates | Women | Women (%) | Men | Men (%) |
| 18-29 | 0 | 0 | - | 0 | - |
| 30-39 | 0 | 0 | - | 0 | - |
| 40-59 | 0 | 0 | - | 0 | - |
| 60+ | 1 | 1 | 100,00% | 0 | 0,00% |
| Totalling | 1 | 1 | 100,00% | 0 | 0,00% |
| Submitted candidates for reeve, mayor, president grouped by age | |||||
| Age | Number of candidates | Women | Women (%) | Men | Men (%) |
| 25-29 | 0 | 0 | - | 0 | - |
| 30-39 | 0 | 0 | - | 0 | - |
| 40-59 | 0 | 0 | - | 0 | - |
| 60+ | 0 | 0 | - | 0 | - |
| Totalling | 0 | 0 | - | 0 | - |
| The youngest and oldest submitted candidate for councils | ||
| Age | Institution | |
| Youngest | 60 | Rada Gminy Zawidz |
| Oldest | 60 | Rada Gminy Zawidz |
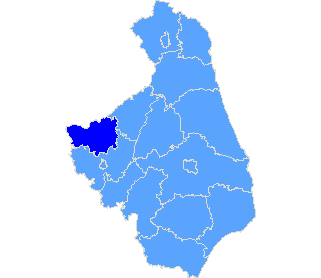
Province podlaskie
| Specification |
| pow. kolneński |
| The statistics of election committe |
| Lists submitted | ||
| Specification | Number of | |
| lists | councils | |
| Lists submitted for province council | 0 | 0 |
| Lists submitted for county councils | 0 | 0 |
| Lists submitted for councils of cities holding county rights | 0 | 0 |
| Lists registered for communal councils | 6 | 1 |
| Totalling | 6 | 1 |
| Submitted candidates | |||||
| Specification | Number of candidates | Women | Women (%) | Men | Men (%) |
| Number of candidates submitted for the province council | 0 | 0 | - | 0 | - |
| Number of candidates submitted for county councils | 0 | 0 | - | 0 | - |
| Number of candidates submitted for councils of cities holding county rights | 0 | 0 | - | 0 | - |
| Number of candidates registered for communal councils | 10 | 4 | 40,00% | 6 | 60,00% |
| Number of candidates submitted for reeve, mayor and presidential elections | 1 | 0 | 0,00% | 1 | 100,00% |
| Totalling | 11 | 4 | 36,36% | 7 | 63,64% |
| Average age of submitted candidates | |||
| Specification | Average age | Average age of women | Average age of men |
| Average age of candidates submitted for the province council | - | - | - |
| Average age of candidates submitted for county councils | - | - | - |
| Average age of candidates for councils of cities holding county rights | - | - | - |
| Average age of candidates submitted for communal councils | 44 | 40 | 47 |
| Average age of candidates for reeve, mayor, president | 50 | - | 50 |
| Totalling | 44 | 40 | 47 |
| Submitted candidates for councils grouped by age | |||||
| Age | Number of candidates | Women | Women (%) | Men | Men (%) |
| 18-29 | 2 | 1 | 50,00% | 1 | 50,00% |
| 30-39 | 3 | 2 | 66,67% | 1 | 33,33% |
| 40-59 | 3 | 0 | 0,00% | 3 | 100,00% |
| 60+ | 2 | 1 | 50,00% | 1 | 50,00% |
| Totalling | 10 | 4 | 40,00% | 6 | 60,00% |
| Submitted candidates for reeve, mayor, president grouped by age | |||||
| Age | Number of candidates | Women | Women (%) | Men | Men (%) |
| 25-29 | 0 | 0 | - | 0 | - |
| 30-39 | 0 | 0 | - | 0 | - |
| 40-59 | 1 | 0 | 0,00% | 1 | 100,00% |
| 60+ | 0 | 0 | - | 0 | - |
| Totalling | 1 | 0 | 0,00% | 1 | 100,00% |
| The youngest and oldest submitted candidate for councils | ||
| Age | Institution | |
| Youngest | 25 | Rada Miejska w Stawiskach |
| Oldest | 63 | Rada Miejska w Stawiskach |
| The youngest and oldest submitted candidate for reeve, mayor, president | ||
| Age | Institution | |
| Youngest | 50 | Burmistrz Stawisk |
| Oldest | 50 | Burmistrz Stawisk |
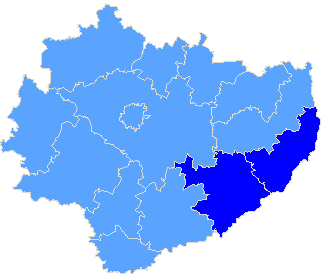
Province świętokrzyskie
| Specification |
| pow. sandomierski |
| pow. staszowski |
| The statistics of election committe |
| Lists submitted | ||
| Specification | Number of | |
| lists | councils | |
| Lists submitted for province council | 0 | 0 |
| Lists submitted for county councils | 4 | 1 |
| Lists submitted for councils of cities holding county rights | 0 | 0 |
| Lists registered for communal councils | 25 | 5 |
| Totalling | 29 | 6 |
| Submitted candidates | |||||
| Specification | Number of candidates | Women | Women (%) | Men | Men (%) |
| Number of candidates submitted for the province council | 0 | 0 | - | 0 | - |
| Number of candidates submitted for county councils | 32 | 8 | 25,00% | 24 | 75,00% |
| Number of candidates submitted for councils of cities holding county rights | 0 | 0 | - | 0 | - |
| Number of candidates registered for communal councils | 64 | 12 | 18,75% | 52 | 81,25% |
| Number of candidates submitted for reeve, mayor and presidential elections | 1 | 0 | 0,00% | 1 | 100,00% |
| Totalling | 97 | 20 | 20,62% | 77 | 79,38% |
| Average age of submitted candidates | |||
| Specification | Average age | Average age of women | Average age of men |
| Average age of candidates submitted for the province council | - | - | - |
| Average age of candidates submitted for county councils | 46 | 45 | 47 |
| Average age of candidates for councils of cities holding county rights | - | - | - |
| Average age of candidates submitted for communal councils | 46 | 41 | 47 |
| Average age of candidates for reeve, mayor, president | 38 | - | 38 |
| Totalling | 45 | 42 | 46 |
| Submitted candidates for councils grouped by age | |||||
| Age | Number of candidates | Women | Women (%) | Men | Men (%) |
| 18-29 | 7 | 2 | 28,57% | 5 | 71,43% |
| 30-39 | 21 | 6 | 28,57% | 15 | 71,43% |
| 40-59 | 60 | 12 | 20,00% | 48 | 80,00% |
| 60+ | 8 | 0 | 0,00% | 8 | 100,00% |
| Totalling | 96 | 20 | 20,83% | 76 | 79,17% |
| Submitted candidates for reeve, mayor, president grouped by age | |||||
| Age | Number of candidates | Women | Women (%) | Men | Men (%) |
| 25-29 | 0 | 0 | - | 0 | - |
| 30-39 | 1 | 0 | 0,00% | 1 | 100,00% |
| 40-59 | 0 | 0 | - | 0 | - |
| 60+ | 0 | 0 | - | 0 | - |
| Totalling | 1 | 0 | 0,00% | 1 | 100,00% |
| The youngest and oldest submitted candidate for councils | ||
| Age | Institution | |
| Youngest | 21 | Rada Powiatu Staszowskiego |
| Oldest | 73 | Rada Miejska w Staszowie |
| The youngest and oldest submitted candidate for reeve, mayor, president | ||
| Age | Institution | |
| Youngest | 38 | Burmistrz Miasta i Gminy Osiek |
| Oldest | 38 | Burmistrz Miasta i Gminy Osiek |
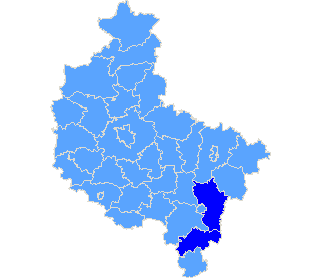
Province wielkopolskie
| Sejmik Województwa Wielkopolskiego |
| Submitted candidates | ||||||
| Specification | Number of candidates | Women | Women (%) | Men | Men (%) | Status |
| Constituency no. 1 | 7 | 4 | 57,14% | 3 | 42,86% | Registered |
| Constituency no. 2 | 6 | 2 | 33,33% | 4 | 66,67% | Registered |
| Constituency no. 3 | 6 | 0 | 0,00% | 6 | 100,00% | Registered |
| Constituency no. 4 | 6 | 3 | 50,00% | 3 | 50,00% | Registered |
| Constituency no. 6 | 8 | 2 | 25,00% | 6 | 75,00% | Registered |
| Totalling | 33 | 11 | 33,33% | 22 | 66,67% | |
| Age of the candidates | |||||
| Specification | Average age | Average age of women | Average age of men | Oldest | Youngest |
| Constituency no. 1 | 41 | 45 | 36 | 54 | 27 |
| Constituency no. 2 | 49 | 52 | 47 | 72 | 20 |
| Constituency no. 3 | 65 | - | 65 | 78 | 54 |
| Constituency no. 4 | 40 | 43 | 37 | 63 | 24 |
| Constituency no. 6 | 55 | 55 | 55 | 68 | 36 |
| Specification |
| pow. kaliski |
| pow. ostrzeszowski |
| The statistics of election committe |
| Lists submitted | ||
| Specification | Number of | |
| lists | councils | |
| Lists submitted for province council | 5 | 1 |
| Lists submitted for county councils | 0 | 0 |
| Lists submitted for councils of cities holding county rights | 0 | 0 |
| Lists registered for communal councils | 16 | 4 |
| Totalling | 21 | 5 |
| Submitted candidates | |||||
| Specification | Number of candidates | Women | Women (%) | Men | Men (%) |
| Number of candidates submitted for the province council | 33 | 11 | 33,33% | 22 | 66,67% |
| Number of candidates submitted for county councils | 0 | 0 | - | 0 | - |
| Number of candidates submitted for councils of cities holding county rights | 0 | 0 | - | 0 | - |
| Number of candidates registered for communal councils | 26 | 4 | 15,38% | 22 | 84,62% |
| Number of candidates submitted for reeve, mayor and presidential elections | 2 | 0 | 0,00% | 2 | 100,00% |
| Totalling | 61 | 15 | 24,59% | 46 | 75,41% |
| Average age of submitted candidates | |||
| Specification | Average age | Average age of women | Average age of men |
| Average age of candidates submitted for the province council | 50 | 47 | 51 |
| Average age of candidates submitted for county councils | - | - | - |
| Average age of candidates for councils of cities holding county rights | - | - | - |
| Average age of candidates submitted for communal councils | 42 | 31 | 43 |
| Average age of candidates for reeve, mayor, president | 51 | - | 51 |
| Totalling | 46 | 42 | 47 |
| Submitted candidates for councils grouped by age | |||||
| Age | Number of candidates | Women | Women (%) | Men | Men (%) |
| 18-29 | 9 | 2 | 22,22% | 7 | 77,78% |
| 30-39 | 14 | 5 | 35,71% | 9 | 64,29% |
| 40-59 | 23 | 7 | 30,43% | 16 | 69,57% |
| 60+ | 13 | 1 | 7,69% | 12 | 92,31% |
| Totalling | 59 | 15 | 25,42% | 44 | 74,58% |
| Submitted candidates for reeve, mayor, president grouped by age | |||||
| Age | Number of candidates | Women | Women (%) | Men | Men (%) |
| 25-29 | 0 | 0 | - | 0 | - |
| 30-39 | 0 | 0 | - | 0 | - |
| 40-59 | 2 | 0 | 0,00% | 2 | 100,00% |
| 60+ | 0 | 0 | - | 0 | - |
| Totalling | 2 | 0 | 0,00% | 2 | 100,00% |
| The youngest and oldest submitted candidate for councils | ||
| Age | Institution | |
| Youngest | 20 | Sejmik Województwa Wielkopolskiego |
| Oldest | 78 | Sejmik Województwa Wielkopolskiego |
| The youngest and oldest submitted candidate for reeve, mayor, president | ||
| Age | Institution | |
| Youngest | 51 | Burmistrz Miasta i Gminy Mikstat |
| Oldest | 51 | Burmistrz Miasta i Gminy Mikstat |
