

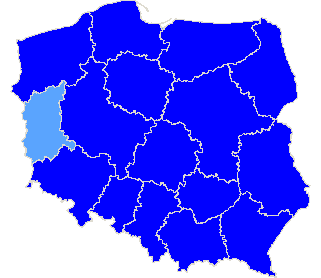
Rzeczpospolita Polska
| The statistics of election committe |
| Lists submitted | ||
| Specification | Number of | |
| lists | councils | |
| Lists submitted for provinces councils | 60 | 14 |
| Lists submitted for county councils | 56 | 19 |
| Lists submitted for councils of cities holding county rights | 19 | 4 |
| Lists submitted for districts councils of the cap. city of Warsaw | 0 | 0 |
| Lists registered for communal councils | 300 | 96 |
| Totalling | 435 | 133 |
| Submitted candidates | |||||
| Specification | Number of candidates | Women | Women (%) | Men | Men (%) |
| Number of candidates submitted for the province council | 504 | 161 | 31,94% | 343 | 68,06% |
| Number of candidates submitted for county councils | 334 | 82 | 24,55% | 252 | 75,45% |
| Number of candidates submitted for councils of cities holding county rights | 129 | 63 | 48,84% | 66 | 51,16% |
| Number of candidates submitted for districts councils of the cap. city of Warsaw | 0 | 0 | - | 0 | - |
| Number of candidates registered for communal councils | 383 | 138 | 36,03% | 245 | 63,97% |
| Number of candidates submitted for reeve, mayor and presidential elections | 20 | 1 | 5,00% | 19 | 95,00% |
| Totalling | 1 370 | 445 | 32,48% | 925 | 67,52% |
| Average age of submitted candidates | |||
| Specification | Average age | Average age of women | Average age of men |
| Average age of candidates submitted for the province council | 41 | 39 | 43 |
| Average age of candidates submitted for county councils | 43 | 37 | 44 |
| Average age of candidates for councils of cities holding county rights | 45 | 43 | 47 |
| Average age of candidates submitted for communal councils | 42 | 39 | 44 |
| Average age of candidates for reeve, mayor, president | 48 | 32 | 49 |
| Totalling | 42 | 39 | 43 |
| Submitted candidates for councils grouped by age | |||||
| Age | Number of candidates | Women | Women (%) | Men | Men (%) |
| 18-29 | 296 | 111 | 37,50% | 185 | 62,50% |
| 30-39 | 266 | 112 | 42,11% | 154 | 57,89% |
| 40-59 | 622 | 194 | 31,19% | 428 | 68,81% |
| 60+ | 166 | 27 | 16,27% | 139 | 83,73% |
| Totalling | 1 350 | 444 | 32,89% | 906 | 67,11% |
| Submitted candidates for reeve, mayor, president grouped by age | |||||
| Age | Number of candidates | Women | Women (%) | Men | Men (%) |
| 25-29 | 1 | 0 | 0,00% | 1 | 100,00% |
| 30-39 | 3 | 1 | 33,33% | 2 | 66,67% |
| 40-59 | 13 | 0 | 0,00% | 13 | 100,00% |
| 60+ | 3 | 0 | 0,00% | 3 | 100,00% |
| Totalling | 20 | 1 | 5,00% | 19 | 95,00% |
| The youngest and oldest submitted candidate for councils | ||
| Age | Institution | |
| Youngest | 18 | Sejmik Województwa Pomorskiego |
| Oldest | 84 | Sejmik Województwa Zachodniopomorskiego |
| The youngest and oldest submitted candidate for reeve, mayor, president | ||
| Age | Institution | |
| Youngest | 26 | Prezydent Miasta Grudziądza |
| Oldest | 67 | Wójt Gminy Mieścisko |
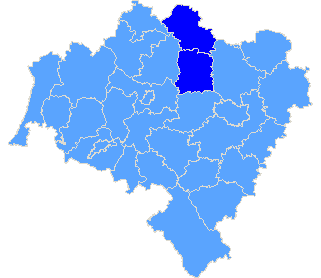
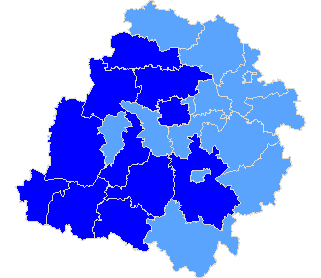
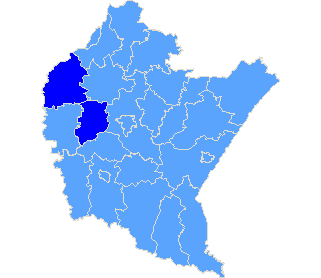
Province dolnośląskie
| Sejmik Województwa Dolnośląskiego |
| Submitted candidates | ||||||
| Specification | Number of candidates | Women | Women (%) | Men | Men (%) | Status |
| Constituency no. 1 | 10 | 2 | 20,00% | 8 | 80,00% | Registered |
| Constituency no. 2 | 8 | 0 | 0,00% | 8 | 100,00% | Registered |
| Constituency no. 3 | 8 | 2 | 25,00% | 6 | 75,00% | Registered |
| Constituency no. 4 | 6 | 3 | 50,00% | 3 | 50,00% | Registered |
| Constituency no. 5 | 8 | 2 | 25,00% | 6 | 75,00% | Registered |
| Totalling | 40 | 9 | 22,50% | 31 | 77,50% | |
| Age of the candidates | |||||
| Specification | Average age | Average age of women | Average age of men | Oldest | Youngest |
| Constituency no. 1 | 21 | 21 | 21 | 24 | 20 |
| Constituency no. 2 | 52 | - | 52 | 62 | 20 |
| Constituency no. 3 | 49 | 50 | 49 | 62 | 31 |
| Constituency no. 4 | 51 | 44 | 58 | 60 | 35 |
| Constituency no. 5 | 39 | 46 | 37 | 72 | 19 |
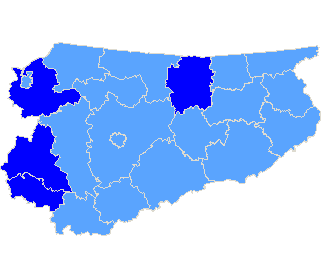
| Specification |
| pow. górowski |
| pow. wołowski |
| The statistics of election committe |
| Lists submitted | ||
| Specification | Number of | |
| lists | councils | |
| Lists submitted for province council | 5 | 1 |
| Lists submitted for county councils | 3 | 1 |
| Lists submitted for councils of cities holding county rights | 0 | 0 |
| Lists registered for communal councils | 4 | 2 |
| Totalling | 12 | 4 |
| Submitted candidates | |||||
| Specification | Number of candidates | Women | Women (%) | Men | Men (%) |
| Number of candidates submitted for the province council | 40 | 9 | 22,50% | 31 | 77,50% |
| Number of candidates submitted for county councils | 18 | 6 | 33,33% | 12 | 66,67% |
| Number of candidates submitted for councils of cities holding county rights | 0 | 0 | - | 0 | - |
| Number of candidates registered for communal councils | 26 | 14 | 53,85% | 12 | 46,15% |
| Number of candidates submitted for reeve, mayor and presidential elections | 1 | 0 | 0,00% | 1 | 100,00% |
| Totalling | 85 | 29 | 34,12% | 56 | 65,88% |
| Average age of submitted candidates | |||
| Specification | Average age | Average age of women | Average age of men |
| Average age of candidates submitted for the province council | 41 | 40 | 41 |
| Average age of candidates submitted for county councils | 47 | 43 | 49 |
| Average age of candidates for councils of cities holding county rights | - | - | - |
| Average age of candidates submitted for communal councils | 45 | 40 | 49 |
| Average age of candidates for reeve, mayor, president | 53 | - | 53 |
| Totalling | 43 | 40 | 44 |
| Submitted candidates for councils grouped by age | |||||
| Age | Number of candidates | Women | Women (%) | Men | Men (%) |
| 18-29 | 19 | 4 | 21,05% | 15 | 78,95% |
| 30-39 | 16 | 10 | 62,50% | 6 | 37,50% |
| 40-59 | 33 | 14 | 42,42% | 19 | 57,58% |
| 60+ | 16 | 1 | 6,25% | 15 | 93,75% |
| Totalling | 84 | 29 | 34,52% | 55 | 65,48% |
| Submitted candidates for reeve, mayor, president grouped by age | |||||
| Age | Number of candidates | Women | Women (%) | Men | Men (%) |
| 25-29 | 0 | 0 | - | 0 | - |
| 30-39 | 0 | 0 | - | 0 | - |
| 40-59 | 1 | 0 | 0,00% | 1 | 100,00% |
| 60+ | 0 | 0 | - | 0 | - |
| Totalling | 1 | 0 | 0,00% | 1 | 100,00% |
| The youngest and oldest submitted candidate for councils | ||
| Age | Institution | |
| Youngest | 19 | Sejmik Województwa Dolnośląskiego |
| Oldest | 72 | Sejmik Województwa Dolnośląskiego |
| The youngest and oldest submitted candidate for reeve, mayor, president | ||
| Age | Institution | |
| Youngest | 53 | Burmistrz Góry |
| Oldest | 53 | Burmistrz Góry |
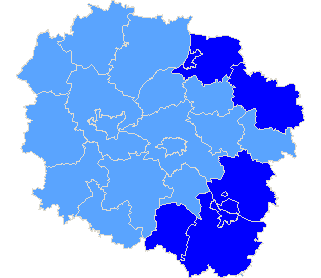
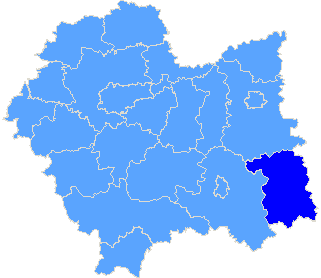
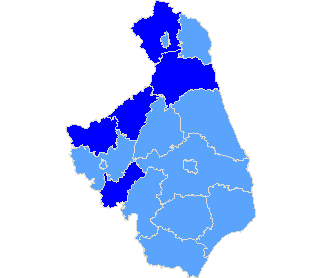
Province kujawsko-pomorskie
| Sejmik Województwa Kujawsko-Pomorskiego |
| Submitted candidates | ||||||
| Specification | Number of candidates | Women | Women (%) | Men | Men (%) | Status |
| Constituency no. 1 | 7 | 2 | 28,57% | 5 | 71,43% | Registered |
| Constituency no. 2 | 9 | 4 | 44,44% | 5 | 55,56% | Registered |
| Constituency no. 3 | 8 | 3 | 37,50% | 5 | 62,50% | Registered |
| Constituency no. 4 | 7 | 2 | 28,57% | 5 | 71,43% | Registered |
| Constituency no. 5 | 6 | 1 | 16,67% | 5 | 83,33% | Registered |
| Constituency no. 6 | 7 | 3 | 42,86% | 4 | 57,14% | Registered |
| Totalling | 44 | 15 | 34,09% | 29 | 65,91% | |
| Age of the candidates | |||||
| Specification | Average age | Average age of women | Average age of men | Oldest | Youngest |
| Constituency no. 1 | 64 | 59 | 66 | 74 | 52 |
| Constituency no. 2 | 42 | 48 | 37 | 59 | 25 |
| Constituency no. 3 | 44 | 51 | 40 | 75 | 20 |
| Constituency no. 4 | 48 | 42 | 50 | 62 | 37 |
| Constituency no. 5 | 57 | 40 | 61 | 69 | 40 |
| Constituency no. 6 | 43 | 38 | 47 | 59 | 25 |
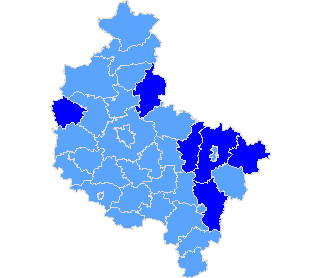
| Specification |
| m. Grudziądz |
| m. Włocławek |
| pow. brodnicki |
| pow. grudziądzki |
| pow. lipnowski |
| pow. radziejowski |
| pow. włocławski |
| The statistics of election committe |
| Lists submitted | ||
| Specification | Number of | |
| lists | councils | |
| Lists submitted for province council | 6 | 1 |
| Lists submitted for county councils | 16 | 4 |
| Lists submitted for councils of cities holding county rights | 9 | 2 |
| Lists registered for communal councils | 54 | 12 |
| Totalling | 85 | 19 |
| Submitted candidates | |||||
| Specification | Number of candidates | Women | Women (%) | Men | Men (%) |
| Number of candidates submitted for the province council | 44 | 15 | 34,09% | 29 | 65,91% |
| Number of candidates submitted for county councils | 95 | 30 | 31,58% | 65 | 68,42% |
| Number of candidates submitted for councils of cities holding county rights | 55 | 33 | 60,00% | 22 | 40,00% |
| Number of candidates registered for communal councils | 72 | 20 | 27,78% | 52 | 72,22% |
| Number of candidates submitted for reeve, mayor and presidential elections | 8 | 1 | 12,50% | 7 | 87,50% |
| Totalling | 274 | 99 | 36,13% | 175 | 63,87% |
| Average age of submitted candidates | |||
| Specification | Average age | Average age of women | Average age of men |
| Average age of candidates submitted for the province council | 49 | 47 | 50 |
| Average age of candidates submitted for county councils | 40 | 35 | 42 |
| Average age of candidates for councils of cities holding county rights | 42 | 43 | 40 |
| Average age of candidates submitted for communal councils | 41 | 38 | 43 |
| Average age of candidates for reeve, mayor, president | 44 | 32 | 46 |
| Totalling | 42 | 40 | 43 |
| Submitted candidates for councils grouped by age | |||||
| Age | Number of candidates | Women | Women (%) | Men | Men (%) |
| 18-29 | 60 | 22 | 36,67% | 38 | 63,33% |
| 30-39 | 51 | 22 | 43,14% | 29 | 56,86% |
| 40-59 | 126 | 49 | 38,89% | 77 | 61,11% |
| 60+ | 29 | 5 | 17,24% | 24 | 82,76% |
| Totalling | 266 | 98 | 36,84% | 168 | 63,16% |
| Submitted candidates for reeve, mayor, president grouped by age | |||||
| Age | Number of candidates | Women | Women (%) | Men | Men (%) |
| 25-29 | 1 | 0 | 0,00% | 1 | 100,00% |
| 30-39 | 2 | 1 | 50,00% | 1 | 50,00% |
| 40-59 | 4 | 0 | 0,00% | 4 | 100,00% |
| 60+ | 1 | 0 | 0,00% | 1 | 100,00% |
| Totalling | 8 | 1 | 12,50% | 7 | 87,50% |
| The youngest and oldest submitted candidate for councils | ||
| Age | Institution | |
| Youngest | 19 | Rada Miasta Włocławek |
| Oldest | 82 | Rada Miejska Grudziądza |
| The youngest and oldest submitted candidate for reeve, mayor, president | ||
| Age | Institution | |
| Youngest | 26 | Prezydent Miasta Grudziądza |
| Oldest | 63 | Wójt Gminy Kowal |
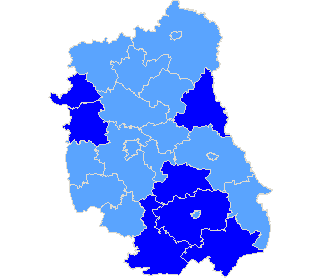
Province lubelskie
| Sejmik Województwa Lubelskiego |
| Submitted candidates | ||||||
| Specification | Number of candidates | Women | Women (%) | Men | Men (%) | Status |
| Constituency no. 1 | 10 | 1 | 10,00% | 9 | 90,00% | Registered |
| Constituency no. 2 | 15 | 8 | 53,33% | 7 | 46,67% | Registered |
| Constituency no. 3 | 12 | 2 | 16,67% | 10 | 83,33% | Registered |
| Constituency no. 4 | 11 | 4 | 36,36% | 7 | 63,64% | Registered |
| Constituency no. 5 | 14 | 3 | 21,43% | 11 | 78,57% | Registered |
| Totalling | 62 | 18 | 29,03% | 44 | 70,97% | |
| Age of the candidates | |||||
| Specification | Average age | Average age of women | Average age of men | Oldest | Youngest |
| Constituency no. 1 | 39 | 29 | 40 | 59 | 25 |
| Constituency no. 2 | 38 | 28 | 50 | 65 | 20 |
| Constituency no. 3 | 50 | 52 | 50 | 63 | 25 |
| Constituency no. 4 | 39 | 38 | 39 | 59 | 22 |
| Constituency no. 5 | 37 | 29 | 39 | 60 | 20 |
| Specification |
| pow. biłgorajski |
| pow. krasnostawski |
| pow. puławski |
| pow. rycki |
| pow. tomaszowski |
| pow. włodawski |
| pow. zamojski |
| The statistics of election committe |
| Lists submitted | ||
| Specification | Number of | |
| lists | councils | |
| Lists submitted for province council | 5 | 1 |
| Lists submitted for county councils | 9 | 2 |
| Lists submitted for councils of cities holding county rights | 0 | 0 |
| Lists registered for communal councils | 37 | 13 |
| Totalling | 51 | 16 |
| Submitted candidates | |||||
| Specification | Number of candidates | Women | Women (%) | Men | Men (%) |
| Number of candidates submitted for the province council | 62 | 18 | 29,03% | 44 | 70,97% |
| Number of candidates submitted for county councils | 66 | 12 | 18,18% | 54 | 81,82% |
| Number of candidates submitted for councils of cities holding county rights | 0 | 0 | - | 0 | - |
| Number of candidates registered for communal councils | 40 | 21 | 52,50% | 19 | 47,50% |
| Number of candidates submitted for reeve, mayor and presidential elections | 1 | 0 | 0,00% | 1 | 100,00% |
| Totalling | 169 | 51 | 30,18% | 118 | 69,82% |
| Average age of submitted candidates | |||
| Specification | Average age | Average age of women | Average age of men |
| Average age of candidates submitted for the province council | 41 | 33 | 44 |
| Average age of candidates submitted for county councils | 48 | 44 | 48 |
| Average age of candidates for councils of cities holding county rights | - | - | - |
| Average age of candidates submitted for communal councils | 43 | 39 | 47 |
| Average age of candidates for reeve, mayor, president | 49 | - | 49 |
| Totalling | 44 | 38 | 46 |
| Submitted candidates for councils grouped by age | |||||
| Age | Number of candidates | Women | Women (%) | Men | Men (%) |
| 18-29 | 30 | 13 | 43,33% | 17 | 56,67% |
| 30-39 | 35 | 15 | 42,86% | 20 | 57,14% |
| 40-59 | 85 | 22 | 25,88% | 63 | 74,12% |
| 60+ | 18 | 1 | 5,56% | 17 | 94,44% |
| Totalling | 168 | 51 | 30,36% | 117 | 69,64% |
| Submitted candidates for reeve, mayor, president grouped by age | |||||
| Age | Number of candidates | Women | Women (%) | Men | Men (%) |
| 25-29 | 0 | 0 | - | 0 | - |
| 30-39 | 0 | 0 | - | 0 | - |
| 40-59 | 1 | 0 | 0,00% | 1 | 100,00% |
| 60+ | 0 | 0 | - | 0 | - |
| Totalling | 1 | 0 | 0,00% | 1 | 100,00% |
| The youngest and oldest submitted candidate for councils | ||
| Age | Institution | |
| Youngest | 19 | Rada Powiatu w Tomaszowie Lubelskim |
| Oldest | 75 | Rada Miejska w Łaszczowie |
| The youngest and oldest submitted candidate for reeve, mayor, president | ||
| Age | Institution | |
| Youngest | 49 | Wójt Gminy Gorzków |
| Oldest | 49 | Wójt Gminy Gorzków |
Province łódzkie
| Sejmik Województwa Łódzkiego |
| Submitted candidates | ||||||
| Specification | Number of candidates | Women | Women (%) | Men | Men (%) | Status |
| Constituency no. 1 | 7 | 2 | 28,57% | 5 | 71,43% | Registered |
| Constituency no. 2 | 8 | 4 | 50,00% | 4 | 50,00% | Registered |
| Constituency no. 3 | 11 | 1 | 9,09% | 10 | 90,91% | Registered |
| Constituency no. 4 | 9 | 4 | 44,44% | 5 | 55,56% | Registered |
| Constituency no. 5 | 12 | 5 | 41,67% | 7 | 58,33% | Registered |
| Constituency no. 6 | 9 | 4 | 44,44% | 5 | 55,56% | Registered |
| Totalling | 56 | 20 | 35,71% | 36 | 64,29% | |
| Age of the candidates | |||||
| Specification | Average age | Average age of women | Average age of men | Oldest | Youngest |
| Constituency no. 1 | 45 | 57 | 40 | 80 | 22 |
| Constituency no. 2 | 52 | 46 | 58 | 69 | 27 |
| Constituency no. 3 | 34 | 28 | 35 | 47 | 19 |
| Constituency no. 4 | 42 | 36 | 47 | 71 | 19 |
| Constituency no. 5 | 30 | 29 | 32 | 53 | 18 |
| Constituency no. 6 | 33 | 29 | 37 | 61 | 18 |
| Specification |
| m. Łódź |
| pow. bełchatowski |
| pow. łaski |
| pow. łęczycki |
| pow. pajęczański |
| pow. piotrkowski |
| pow. poddębicki |
| pow. sieradzki |
| pow. wieluński |
| pow. wieruszowski |
| pow. zgierski |
| The statistics of election committe |
| Lists submitted | ||
| Specification | Number of | |
| lists | councils | |
| Lists submitted for province council | 6 | 1 |
| Lists submitted for county councils | 11 | 4 |
| Lists submitted for councils of cities holding county rights | 8 | 1 |
| Lists registered for communal councils | 87 | 22 |
| Totalling | 112 | 28 |
| Submitted candidates | |||||
| Specification | Number of candidates | Women | Women (%) | Men | Men (%) |
| Number of candidates submitted for the province council | 56 | 20 | 35,71% | 36 | 64,29% |
| Number of candidates submitted for county councils | 64 | 18 | 28,13% | 46 | 71,88% |
| Number of candidates submitted for councils of cities holding county rights | 64 | 26 | 40,63% | 38 | 59,38% |
| Number of candidates registered for communal councils | 105 | 33 | 31,43% | 72 | 68,57% |
| Number of candidates submitted for reeve, mayor and presidential elections | 5 | 0 | 0,00% | 5 | 100,00% |
| Totalling | 294 | 97 | 32,99% | 197 | 67,01% |
| Average age of submitted candidates | |||
| Specification | Average age | Average age of women | Average age of men |
| Average age of candidates submitted for the province council | 38 | 37 | 39 |
| Average age of candidates submitted for county councils | 43 | 36 | 46 |
| Average age of candidates for councils of cities holding county rights | 48 | 46 | 49 |
| Average age of candidates submitted for communal councils | 40 | 39 | 41 |
| Average age of candidates for reeve, mayor, president | 48 | - | 48 |
| Totalling | 42 | 39 | 43 |
| Submitted candidates for councils grouped by age | |||||
| Age | Number of candidates | Women | Women (%) | Men | Men (%) |
| 18-29 | 65 | 22 | 33,85% | 43 | 66,15% |
| 30-39 | 58 | 30 | 51,72% | 28 | 48,28% |
| 40-59 | 124 | 38 | 30,65% | 86 | 69,35% |
| 60+ | 42 | 7 | 16,67% | 35 | 83,33% |
| Totalling | 289 | 97 | 33,56% | 192 | 66,44% |
| Submitted candidates for reeve, mayor, president grouped by age | |||||
| Age | Number of candidates | Women | Women (%) | Men | Men (%) |
| 25-29 | 0 | 0 | - | 0 | - |
| 30-39 | 1 | 0 | 0,00% | 1 | 100,00% |
| 40-59 | 3 | 0 | 0,00% | 3 | 100,00% |
| 60+ | 1 | 0 | 0,00% | 1 | 100,00% |
| Totalling | 5 | 0 | 0,00% | 5 | 100,00% |
| The youngest and oldest submitted candidate for councils | ||
| Age | Institution | |
| Youngest | 18 | Sejmik Województwa Łódzkiego |
| Oldest | 80 | Sejmik Województwa Łódzkiego |
| The youngest and oldest submitted candidate for reeve, mayor, president | ||
| Age | Institution | |
| Youngest | 35 | Wójt Gminy Daszyna |
| Oldest | 60 | Prezydent Miasta Łodzi |
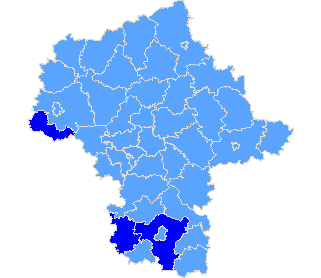
Province małopolskie
| Specification |
| pow. gorlicki |
| The statistics of election committe |
| Lists submitted | ||
| Specification | Number of | |
| lists | councils | |
| Lists submitted for province council | 0 | 0 |
| Lists submitted for county councils | 0 | 0 |
| Lists submitted for councils of cities holding county rights | 0 | 0 |
| Lists registered for communal councils | 1 | 1 |
| Totalling | 1 | 1 |
| Submitted candidates | |||||
| Specification | Number of candidates | Women | Women (%) | Men | Men (%) |
| Number of candidates submitted for the province council | 0 | 0 | - | 0 | - |
| Number of candidates submitted for county councils | 0 | 0 | - | 0 | - |
| Number of candidates submitted for councils of cities holding county rights | 0 | 0 | - | 0 | - |
| Number of candidates registered for communal councils | 1 | 0 | 0,00% | 1 | 100,00% |
| Number of candidates submitted for reeve, mayor and presidential elections | 0 | 0 | - | 0 | - |
| Totalling | 1 | 0 | 0,00% | 1 | 100,00% |
| Average age of submitted candidates | |||
| Specification | Average age | Average age of women | Average age of men |
| Average age of candidates submitted for the province council | - | - | - |
| Average age of candidates submitted for county councils | - | - | - |
| Average age of candidates for councils of cities holding county rights | - | - | - |
| Average age of candidates submitted for communal councils | 53 | - | 53 |
| Average age of candidates for reeve, mayor, president | - | - | - |
| Totalling | 53 | - | 53 |
| Submitted candidates for councils grouped by age | |||||
| Age | Number of candidates | Women | Women (%) | Men | Men (%) |
| 18-29 | 0 | 0 | - | 0 | - |
| 30-39 | 0 | 0 | - | 0 | - |
| 40-59 | 1 | 0 | 0,00% | 1 | 100,00% |
| 60+ | 0 | 0 | - | 0 | - |
| Totalling | 1 | 0 | 0,00% | 1 | 100,00% |
| Submitted candidates for reeve, mayor, president grouped by age | |||||
| Age | Number of candidates | Women | Women (%) | Men | Men (%) |
| 25-29 | 0 | 0 | - | 0 | - |
| 30-39 | 0 | 0 | - | 0 | - |
| 40-59 | 0 | 0 | - | 0 | - |
| 60+ | 0 | 0 | - | 0 | - |
| Totalling | 0 | 0 | - | 0 | - |
| The youngest and oldest submitted candidate for councils | ||
| Age | Institution | |
| Youngest | 53 | Rada Gminy Uście Gorlickie |
| Oldest | 53 | Rada Gminy Uście Gorlickie |
Province mazowieckie
| Sejmik Województwa Mazowieckiego |
| Submitted candidates | ||||||
| Specification | Number of candidates | Women | Women (%) | Men | Men (%) | Status |
| Constituency no. 4 | 9 | 5 | 55,56% | 4 | 44,44% | Registered |
| Constituency no. 5 | 9 | 2 | 22,22% | 7 | 77,78% | Registered |
| Constituency no. 6 | 9 | 4 | 44,44% | 5 | 55,56% | Registered |
| Constituency no. 7 | 10 | 3 | 30,00% | 7 | 70,00% | Registered |
| Totalling | 37 | 14 | 37,84% | 23 | 62,16% | |
| Age of the candidates | |||||
| Specification | Average age | Average age of women | Average age of men | Oldest | Youngest |
| Constituency no. 4 | 35 | 42 | 26 | 54 | 26 |
| Constituency no. 5 | 40 | 30 | 43 | 62 | 24 |
| Constituency no. 6 | 36 | 27 | 44 | 50 | 20 |
| Constituency no. 7 | 52 | 42 | 57 | 66 | 23 |
| Specification |
| pow. gostyniński |
| pow. przysuski |
| pow. radomski |
| The statistics of election committe |
| Lists submitted | ||
| Specification | Number of | |
| lists | councils | |
| Lists submitted for province council | 4 | 1 |
| Lists submitted for county councils | 0 | 0 |
| Lists submitted for councils of cities holding county rights | 0 | 0 |
| Lists submitted for districts councils of the cap. city of Warsaw | 0 | 0 |
| Lists registered for communal councils | 13 | 4 |
| Totalling | 17 | 5 |
| Submitted candidates | |||||
| Specification | Number of candidates | Women | Women (%) | Men | Men (%) |
| Number of candidates submitted for the province council | 37 | 14 | 37,84% | 23 | 62,16% |
| Number of candidates submitted for county councils | 0 | 0 | - | 0 | - |
| Number of candidates submitted for councils of cities holding county rights | 0 | 0 | - | 0 | - |
| Number of candidates submitted for districts councils of the cap. city of Warsaw | 0 | 0 | - | 0 | - |
| Number of candidates registered for communal councils | 14 | 6 | 42,86% | 8 | 57,14% |
| Number of candidates submitted for reeve, mayor and presidential elections | 0 | 0 | - | 0 | - |
| Totalling | 51 | 20 | 39,22% | 31 | 60,78% |
| Average age of submitted candidates | |||
| Specification | Average age | Average age of women | Average age of men |
| Average age of candidates submitted for the province council | 41 | 36 | 45 |
| Average age of candidates submitted for county councils | - | - | - |
| Average age of candidates for councils of cities holding county rights | - | - | - |
| Average age of candidates for districts councils of the cap. city of Warsaw | - | - | - |
| Average age of candidates submitted for communal councils | 44 | 38 | 48 |
| Average age of candidates for reeve, mayor, president | - | - | - |
| Totalling | 41 | 36 | 45 |
| Submitted candidates for councils grouped by age | |||||
| Age | Number of candidates | Women | Women (%) | Men | Men (%) |
| 18-29 | 12 | 6 | 50,00% | 6 | 50,00% |
| 30-39 | 9 | 6 | 66,67% | 3 | 33,33% |
| 40-59 | 26 | 8 | 30,77% | 18 | 69,23% |
| 60+ | 4 | 0 | 0,00% | 4 | 100,00% |
| Totalling | 51 | 20 | 39,22% | 31 | 60,78% |
| Submitted candidates for reeve, mayor, president grouped by age | |||||
| Age | Number of candidates | Women | Women (%) | Men | Men (%) |
| 25-29 | 0 | 0 | - | 0 | - |
| 30-39 | 0 | 0 | - | 0 | - |
| 40-59 | 0 | 0 | - | 0 | - |
| 60+ | 0 | 0 | - | 0 | - |
| Totalling | 0 | 0 | - | 0 | - |
| The youngest and oldest submitted candidate for councils | ||
| Age | Institution | |
| Youngest | 20 | Sejmik Województwa Mazowieckiego |
| Oldest | 66 | Sejmik Województwa Mazowieckiego |
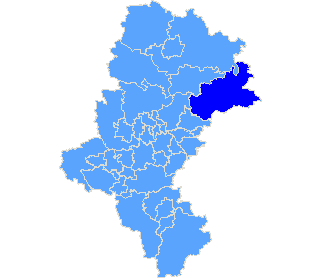
Province opolskie
| Sejmik Województwa Opolskiego |
| Submitted candidates | ||||||
| Specification | Number of candidates | Women | Women (%) | Men | Men (%) | Status |
| Constituency no. 5 | 5 | 0 | 0,00% | 5 | 100,00% | Registered |
| Totalling | 5 | 0 | 0,00% | 5 | 100,00% | |
| Age of the candidates | |||||
| Specification | Average age | Average age of women | Average age of men | Oldest | Youngest |
| Constituency no. 5 | 53 | - | 53 | 67 | 38 |
| Specification |
| pow. kluczborski |
| pow. oleski |
| The statistics of election committe |
| Lists submitted | ||
| Specification | Number of | |
| lists | councils | |
| Lists submitted for province council | 1 | 1 |
| Lists submitted for county councils | 0 | 0 |
| Lists submitted for councils of cities holding county rights | 0 | 0 |
| Lists registered for communal councils | 10 | 2 |
| Totalling | 11 | 3 |
| Submitted candidates | |||||
| Specification | Number of candidates | Women | Women (%) | Men | Men (%) |
| Number of candidates submitted for the province council | 5 | 0 | 0,00% | 5 | 100,00% |
| Number of candidates submitted for county councils | 0 | 0 | - | 0 | - |
| Number of candidates submitted for councils of cities holding county rights | 0 | 0 | - | 0 | - |
| Number of candidates registered for communal councils | 12 | 6 | 50,00% | 6 | 50,00% |
| Number of candidates submitted for reeve, mayor and presidential elections | 1 | 0 | 0,00% | 1 | 100,00% |
| Totalling | 18 | 6 | 33,33% | 12 | 66,67% |
| Average age of submitted candidates | |||
| Specification | Average age | Average age of women | Average age of men |
| Average age of candidates submitted for the province council | 53 | - | 53 |
| Average age of candidates submitted for county councils | - | - | - |
| Average age of candidates for councils of cities holding county rights | - | - | - |
| Average age of candidates submitted for communal councils | 35 | 36 | 35 |
| Average age of candidates for reeve, mayor, president | 58 | - | 58 |
| Totalling | 41 | 36 | 44 |
| Submitted candidates for councils grouped by age | |||||
| Age | Number of candidates | Women | Women (%) | Men | Men (%) |
| 18-29 | 5 | 3 | 60,00% | 2 | 40,00% |
| 30-39 | 5 | 1 | 20,00% | 4 | 80,00% |
| 40-59 | 6 | 2 | 33,33% | 4 | 66,67% |
| 60+ | 1 | 0 | 0,00% | 1 | 100,00% |
| Totalling | 17 | 6 | 35,29% | 11 | 64,71% |
| Submitted candidates for reeve, mayor, president grouped by age | |||||
| Age | Number of candidates | Women | Women (%) | Men | Men (%) |
| 25-29 | 0 | 0 | - | 0 | - |
| 30-39 | 0 | 0 | - | 0 | - |
| 40-59 | 1 | 0 | 0,00% | 1 | 100,00% |
| 60+ | 0 | 0 | - | 0 | - |
| Totalling | 1 | 0 | 0,00% | 1 | 100,00% |
| The youngest and oldest submitted candidate for councils | ||
| Age | Institution | |
| Youngest | 21 | Rada Miejska w Praszce |
| Oldest | 72 | Sejmik Województwa Opolskiego |
| The youngest and oldest submitted candidate for reeve, mayor, president | ||
| Age | Institution | |
| Youngest | 58 | Burmistrz Miasta i Gminy Praszka |
| Oldest | 58 | Burmistrz Miasta i Gminy Praszka |
Province podkarpackie
| Sejmik Województwa Podkarpackiego |
| Submitted candidates | ||||||
| Specification | Number of candidates | Women | Women (%) | Men | Men (%) | Status |
| Constituency no. 1 | 6 | 1 | 16,67% | 5 | 83,33% | Registered |
| Constituency no. 2 | 12 | 4 | 33,33% | 8 | 66,67% | Registered |
| Constituency no. 3 | 6 | 3 | 50,00% | 3 | 50,00% | Registered |
| Constituency no. 4 | 7 | 6 | 85,71% | 1 | 14,29% | Registered |
| Constituency no. 5 | 8 | 0 | 0,00% | 8 | 100,00% | Registered |
| Totalling | 39 | 14 | 35,90% | 25 | 64,10% | |
| Age of the candidates | |||||
| Specification | Average age | Average age of women | Average age of men | Oldest | Youngest |
| Constituency no. 1 | 35 | 27 | 37 | 54 | 21 |
| Constituency no. 2 | 38 | 46 | 34 | 64 | 21 |
| Constituency no. 3 | 58 | 47 | 69 | 76 | 37 |
| Constituency no. 4 | 43 | 47 | 23 | 74 | 23 |
| Constituency no. 5 | 45 | - | 45 | 61 | 26 |
| Specification |
| pow. mielecki |
| pow. ropczycko-sędziszowski |
| The statistics of election committe |
| Lists submitted | ||
| Specification | Number of | |
| lists | councils | |
| Lists submitted for province council | 5 | 1 |
| Lists submitted for county councils | 4 | 1 |
| Lists submitted for councils of cities holding county rights | 0 | 0 |
| Lists registered for communal councils | 1 | 1 |
| Totalling | 10 | 3 |
| Submitted candidates | |||||
| Specification | Number of candidates | Women | Women (%) | Men | Men (%) |
| Number of candidates submitted for the province council | 39 | 14 | 35,90% | 25 | 64,10% |
| Number of candidates submitted for county councils | 22 | 7 | 31,82% | 15 | 68,18% |
| Number of candidates submitted for councils of cities holding county rights | 0 | 0 | - | 0 | - |
| Number of candidates registered for communal councils | 1 | 1 | 100,00% | 0 | 0,00% |
| Number of candidates submitted for reeve, mayor and presidential elections | 0 | 0 | - | 0 | - |
| Totalling | 62 | 22 | 35,48% | 40 | 64,52% |
| Average age of submitted candidates | |||
| Specification | Average age | Average age of women | Average age of men |
| Average age of candidates submitted for the province council | 43 | 45 | 42 |
| Average age of candidates submitted for county councils | 28 | 22 | 31 |
| Average age of candidates for councils of cities holding county rights | - | - | - |
| Average age of candidates submitted for communal councils | 57 | 57 | - |
| Average age of candidates for reeve, mayor, president | - | - | - |
| Totalling | 37 | 38 | 37 |
| Submitted candidates for councils grouped by age | |||||
| Age | Number of candidates | Women | Women (%) | Men | Men (%) |
| 18-29 | 28 | 9 | 32,14% | 19 | 67,86% |
| 30-39 | 10 | 3 | 30,00% | 7 | 70,00% |
| 40-59 | 16 | 8 | 50,00% | 8 | 50,00% |
| 60+ | 8 | 2 | 25,00% | 6 | 75,00% |
| Totalling | 62 | 22 | 35,48% | 40 | 64,52% |
| Submitted candidates for reeve, mayor, president grouped by age | |||||
| Age | Number of candidates | Women | Women (%) | Men | Men (%) |
| 25-29 | 0 | 0 | - | 0 | - |
| 30-39 | 0 | 0 | - | 0 | - |
| 40-59 | 0 | 0 | - | 0 | - |
| 60+ | 0 | 0 | - | 0 | - |
| Totalling | 0 | 0 | - | 0 | - |
| The youngest and oldest submitted candidate for councils | ||
| Age | Institution | |
| Youngest | 20 | Rada Powiatu Mieleckiego |
| Oldest | 76 | Sejmik Województwa Podkarpackiego |
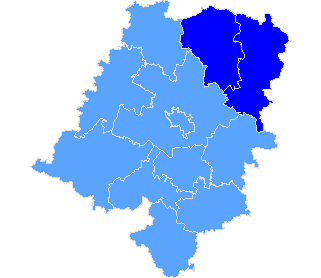
Province podlaskie
| Sejmik Województwa Podlaskiego |
| Submitted candidates | ||||||
| Specification | Number of candidates | Women | Women (%) | Men | Men (%) | Status |
| Constituency no. 1 | 6 | 0 | 0,00% | 6 | 100,00% | Registered |
| Constituency no. 2 | 10 | 1 | 10,00% | 9 | 90,00% | Registered |
| Constituency no. 3 | 10 | 0 | 0,00% | 10 | 100,00% | Registered |
| Constituency no. 4 | 7 | 2 | 28,57% | 5 | 71,43% | Registered |
| Constituency no. 5 | 8 | 1 | 12,50% | 7 | 87,50% | Registered |
| Totalling | 41 | 4 | 9,76% | 37 | 90,24% | |
| Age of the candidates | |||||
| Specification | Average age | Average age of women | Average age of men | Oldest | Youngest |
| Constituency no. 1 | 49 | - | 49 | 60 | 36 |
| Constituency no. 2 | 49 | 51 | 49 | 74 | 25 |
| Constituency no. 3 | 40 | - | 40 | 71 | 26 |
| Constituency no. 4 | 41 | 47 | 39 | 58 | 21 |
| Constituency no. 5 | 39 | 26 | 40 | 57 | 21 |
| Specification |
| pow. augustowski |
| pow. grajewski |
| pow. kolneński |
| pow. suwalski |
| pow. zambrowski |
| The statistics of election committe |
| Lists submitted | ||
| Specification | Number of | |
| lists | councils | |
| Lists submitted for province council | 5 | 1 |
| Lists submitted for county councils | 1 | 1 |
| Lists submitted for councils of cities holding county rights | 0 | 0 |
| Lists registered for communal councils | 24 | 8 |
| Totalling | 30 | 10 |
| Submitted candidates | |||||
| Specification | Number of candidates | Women | Women (%) | Men | Men (%) |
| Number of candidates submitted for the province council | 41 | 4 | 9,76% | 37 | 90,24% |
| Number of candidates submitted for county councils | 3 | 0 | 0,00% | 3 | 100,00% |
| Number of candidates submitted for councils of cities holding county rights | 0 | 0 | - | 0 | - |
| Number of candidates registered for communal councils | 30 | 8 | 26,67% | 22 | 73,33% |
| Number of candidates submitted for reeve, mayor and presidential elections | 2 | 0 | 0,00% | 2 | 100,00% |
| Totalling | 76 | 12 | 15,79% | 64 | 84,21% |
| Average age of submitted candidates | |||
| Specification | Average age | Average age of women | Average age of men |
| Average age of candidates submitted for the province council | 43 | 43 | 43 |
| Average age of candidates submitted for county councils | 51 | - | 51 |
| Average age of candidates for councils of cities holding county rights | - | - | - |
| Average age of candidates submitted for communal councils | 46 | 44 | 47 |
| Average age of candidates for reeve, mayor, president | 55 | - | 55 |
| Totalling | 44 | 43 | 45 |
| Submitted candidates for councils grouped by age | |||||
| Age | Number of candidates | Women | Women (%) | Men | Men (%) |
| 18-29 | 7 | 1 | 14,29% | 6 | 85,71% |
| 30-39 | 19 | 3 | 15,79% | 16 | 84,21% |
| 40-59 | 43 | 8 | 18,60% | 35 | 81,40% |
| 60+ | 5 | 0 | 0,00% | 5 | 100,00% |
| Totalling | 74 | 12 | 16,22% | 62 | 83,78% |
| Submitted candidates for reeve, mayor, president grouped by age | |||||
| Age | Number of candidates | Women | Women (%) | Men | Men (%) |
| 25-29 | 0 | 0 | - | 0 | - |
| 30-39 | 0 | 0 | - | 0 | - |
| 40-59 | 2 | 0 | 0,00% | 2 | 100,00% |
| 60+ | 0 | 0 | - | 0 | - |
| Totalling | 2 | 0 | 0,00% | 2 | 100,00% |
| The youngest and oldest submitted candidate for councils | ||
| Age | Institution | |
| Youngest | 21 | Sejmik Województwa Podlaskiego |
| Oldest | 74 | Sejmik Województwa Podlaskiego |
| The youngest and oldest submitted candidate for reeve, mayor, president | ||
| Age | Institution | |
| Youngest | 53 | Wójt Gminy Bakałarzewo |
| Oldest | 58 | Wójt Gminy Kołaki Kościelne |
| Sejmik Województwa Pomorskiego |
| Submitted candidates | ||||||
| Specification | Number of candidates | Women | Women (%) | Men | Men (%) | Status |
| Constituency no. 1 | 10 | 6 | 60,00% | 4 | 40,00% | Registered |
| Constituency no. 2 | 9 | 2 | 22,22% | 7 | 77,78% | Registered |
| Constituency no. 3 | 7 | 5 | 71,43% | 2 | 28,57% | Registered |
| Constituency no. 4 | 12 | 6 | 50,00% | 6 | 50,00% | Registered |
| Constituency no. 5 | 8 | 2 | 25,00% | 6 | 75,00% | Registered |
| Totalling | 46 | 21 | 45,65% | 25 | 54,35% | |
| Age of the candidates | |||||
| Specification | Average age | Average age of women | Average age of men | Oldest | Youngest |
| Constituency no. 1 | 36 | 37 | 34 | 59 | 21 |
| Constituency no. 2 | 46 | 64 | 40 | 75 | 18 |
| Constituency no. 3 | 35 | 35 | 35 | 55 | 19 |
| Constituency no. 4 | 38 | 36 | 41 | 63 | 19 |
| Constituency no. 5 | 30 | 43 | 25 | 50 | 19 |
| Specification |
| The statistics of election committe |
| Lists submitted | ||
| Specification | Number of | |
| lists | councils | |
| Lists submitted for province council | 5 | 1 |
| Lists submitted for county councils | 0 | 0 |
| Lists submitted for councils of cities holding county rights | 0 | 0 |
| Lists registered for communal councils | 0 | 0 |
| Totalling | 5 | 1 |
| Submitted candidates | |||||
| Specification | Number of candidates | Women | Women (%) | Men | Men (%) |
| Number of candidates submitted for the province council | 46 | 21 | 45,65% | 25 | 54,35% |
| Number of candidates submitted for county councils | 0 | 0 | - | 0 | - |
| Number of candidates submitted for councils of cities holding county rights | 0 | 0 | - | 0 | - |
| Number of candidates registered for communal councils | 0 | 0 | - | 0 | - |
| Number of candidates submitted for reeve, mayor and presidential elections | 0 | 0 | - | 0 | - |
| Totalling | 46 | 21 | 45,65% | 25 | 54,35% |
| Average age of submitted candidates | |||
| Specification | Average age | Average age of women | Average age of men |
| Average age of candidates submitted for the province council | 37 | 39 | 35 |
| Average age of candidates submitted for county councils | - | - | - |
| Average age of candidates for councils of cities holding county rights | - | - | - |
| Average age of candidates submitted for communal councils | - | - | - |
| Average age of candidates for reeve, mayor, president | - | - | - |
| Totalling | 37 | 39 | 35 |
| Submitted candidates for councils grouped by age | |||||
| Age | Number of candidates | Women | Women (%) | Men | Men (%) |
| 18-29 | 18 | 6 | 33,33% | 12 | 66,67% |
| 30-39 | 9 | 5 | 55,56% | 4 | 44,44% |
| 40-59 | 17 | 9 | 52,94% | 8 | 47,06% |
| 60+ | 2 | 1 | 50,00% | 1 | 50,00% |
| Totalling | 46 | 21 | 45,65% | 25 | 54,35% |
| Submitted candidates for reeve, mayor, president grouped by age | |||||
| Age | Number of candidates | Women | Women (%) | Men | Men (%) |
| 25-29 | 0 | 0 | - | 0 | - |
| 30-39 | 0 | 0 | - | 0 | - |
| 40-59 | 0 | 0 | - | 0 | - |
| 60+ | 0 | 0 | - | 0 | - |
| Totalling | 0 | 0 | - | 0 | - |
| The youngest and oldest submitted candidate for councils | ||
| Age | Institution | |
| Youngest | 18 | Sejmik Województwa Pomorskiego |
| Oldest | 75 | Sejmik Województwa Pomorskiego |
Province śląskie
| Sejmik Województwa Śląskiego |
| Submitted candidates | ||||||
| Specification | Number of candidates | Women | Women (%) | Men | Men (%) | Status |
| Constituency no. 1 | 5 | 3 | 60,00% | 2 | 40,00% | Registered |
| Constituency no. 2 | 9 | 1 | 11,11% | 8 | 88,89% | Registered |
| Constituency no. 4 | 9 | 3 | 33,33% | 6 | 66,67% | Registered |
| Constituency no. 5 | 6 | 0 | 0,00% | 6 | 100,00% | Registered |
| Constituency no. 6 | 6 | 2 | 33,33% | 4 | 66,67% | Registered |
| Constituency no. 7 | 7 | 4 | 57,14% | 3 | 42,86% | Registered |
| Totalling | 42 | 13 | 30,95% | 29 | 69,05% | |
| Age of the candidates | |||||
| Specification | Average age | Average age of women | Average age of men | Oldest | Youngest |
| Constituency no. 1 | 36 | 42 | 27 | 59 | 27 |
| Constituency no. 2 | 48 | 50 | 48 | 64 | 24 |
| Constituency no. 4 | 48 | 53 | 46 | 64 | 21 |
| Constituency no. 5 | 46 | - | 46 | 61 | 24 |
| Constituency no. 6 | 35 | 32 | 37 | 59 | 23 |
| Constituency no. 7 | 34 | 37 | 31 | 50 | 18 |
| Specification |
| pow. zawierciański |
| The statistics of election committe |
| Lists submitted | ||
| Specification | Number of | |
| lists | councils | |
| Lists submitted for province council | 6 | 1 |
| Lists submitted for county councils | 0 | 0 |
| Lists submitted for councils of cities holding county rights | 0 | 0 |
| Lists registered for communal councils | 1 | 1 |
| Totalling | 7 | 2 |
| Submitted candidates | |||||
| Specification | Number of candidates | Women | Women (%) | Men | Men (%) |
| Number of candidates submitted for the province council | 42 | 13 | 30,95% | 29 | 69,05% |
| Number of candidates submitted for county councils | 0 | 0 | - | 0 | - |
| Number of candidates submitted for councils of cities holding county rights | 0 | 0 | - | 0 | - |
| Number of candidates registered for communal councils | 1 | 0 | 0,00% | 1 | 100,00% |
| Number of candidates submitted for reeve, mayor and presidential elections | 0 | 0 | - | 0 | - |
| Totalling | 43 | 13 | 30,23% | 30 | 69,77% |
| Average age of submitted candidates | |||
| Specification | Average age | Average age of women | Average age of men |
| Average age of candidates submitted for the province council | 42 | 42 | 42 |
| Average age of candidates submitted for county councils | - | - | - |
| Average age of candidates for councils of cities holding county rights | - | - | - |
| Average age of candidates submitted for communal councils | 35 | - | 35 |
| Average age of candidates for reeve, mayor, president | - | - | - |
| Totalling | 41 | 42 | 41 |
| Submitted candidates for councils grouped by age | |||||
| Age | Number of candidates | Women | Women (%) | Men | Men (%) |
| 18-29 | 12 | 4 | 33,33% | 8 | 66,67% |
| 30-39 | 7 | 1 | 14,29% | 6 | 85,71% |
| 40-59 | 19 | 7 | 36,84% | 12 | 63,16% |
| 60+ | 5 | 1 | 20,00% | 4 | 80,00% |
| Totalling | 43 | 13 | 30,23% | 30 | 69,77% |
| Submitted candidates for reeve, mayor, president grouped by age | |||||
| Age | Number of candidates | Women | Women (%) | Men | Men (%) |
| 25-29 | 0 | 0 | - | 0 | - |
| 30-39 | 0 | 0 | - | 0 | - |
| 40-59 | 0 | 0 | - | 0 | - |
| 60+ | 0 | 0 | - | 0 | - |
| Totalling | 0 | 0 | - | 0 | - |
| The youngest and oldest submitted candidate for councils | ||
| Age | Institution | |
| Youngest | 18 | Sejmik Województwa Śląskiego |
| Oldest | 64 | Sejmik Województwa Śląskiego |
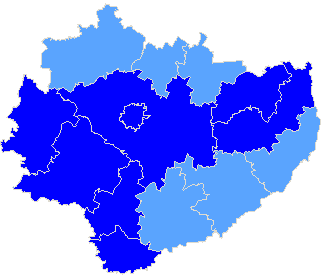
Province świętokrzyskie
| Sejmik Województwa Świętokrzyskiego |
| Submitted candidates | ||||||
| Specification | Number of candidates | Women | Women (%) | Men | Men (%) | Status |
| Constituency no. 1 | 10 | 6 | 60,00% | 4 | 40,00% | Registered |
| Constituency no. 2 | 6 | 2 | 33,33% | 4 | 66,67% | Registered |
| Constituency no. 3 | 8 | 2 | 25,00% | 6 | 75,00% | Registered |
| Constituency no. 4 | 11 | 3 | 27,27% | 8 | 72,73% | Registered |
| Totalling | 35 | 13 | 37,14% | 22 | 62,86% | |
| Age of the candidates | |||||
| Specification | Average age | Average age of women | Average age of men | Oldest | Youngest |
| Constituency no. 1 | 28 | 28 | 29 | 44 | 19 |
| Constituency no. 2 | 40 | 34 | 43 | 58 | 19 |
| Constituency no. 3 | 50 | 41 | 53 | 62 | 25 |
| Constituency no. 4 | 40 | 36 | 42 | 58 | 27 |
| Specification |
| m. Kielce |
| pow. jędrzejowski |
| pow. kazimierski |
| pow. kielecki |
| pow. opatowski |
| pow. ostrowiecki |
| pow. pińczowski |
| pow. włoszczowski |
| The statistics of election committe |
| Lists submitted | ||
| Specification | Number of | |
| lists | councils | |
| Lists submitted for province council | 4 | 1 |
| Lists submitted for county councils | 4 | 3 |
| Lists submitted for councils of cities holding county rights | 2 | 1 |
| Lists registered for communal councils | 17 | 8 |
| Totalling | 27 | 13 |
| Submitted candidates | |||||
| Specification | Number of candidates | Women | Women (%) | Men | Men (%) |
| Number of candidates submitted for the province council | 35 | 13 | 37,14% | 22 | 62,86% |
| Number of candidates submitted for county councils | 15 | 5 | 33,33% | 10 | 66,67% |
| Number of candidates submitted for councils of cities holding county rights | 10 | 4 | 40,00% | 6 | 60,00% |
| Number of candidates registered for communal councils | 18 | 6 | 33,33% | 12 | 66,67% |
| Number of candidates submitted for reeve, mayor and presidential elections | 0 | 0 | - | 0 | - |
| Totalling | 78 | 28 | 35,90% | 50 | 64,10% |
| Average age of submitted candidates | |||
| Specification | Average age | Average age of women | Average age of men |
| Average age of candidates submitted for the province council | 39 | 33 | 43 |
| Average age of candidates submitted for county councils | 50 | 53 | 49 |
| Average age of candidates for councils of cities holding county rights | 53 | 39 | 62 |
| Average age of candidates submitted for communal councils | 46 | 44 | 48 |
| Average age of candidates for reeve, mayor, president | - | - | - |
| Totalling | 44 | 39 | 47 |
| Submitted candidates for councils grouped by age | |||||
| Age | Number of candidates | Women | Women (%) | Men | Men (%) |
| 18-29 | 14 | 8 | 57,14% | 6 | 42,86% |
| 30-39 | 16 | 9 | 56,25% | 7 | 43,75% |
| 40-59 | 34 | 6 | 17,65% | 28 | 82,35% |
| 60+ | 14 | 5 | 35,71% | 9 | 64,29% |
| Totalling | 78 | 28 | 35,90% | 50 | 64,10% |
| Submitted candidates for reeve, mayor, president grouped by age | |||||
| Age | Number of candidates | Women | Women (%) | Men | Men (%) |
| 25-29 | 0 | 0 | - | 0 | - |
| 30-39 | 0 | 0 | - | 0 | - |
| 40-59 | 0 | 0 | - | 0 | - |
| 60+ | 0 | 0 | - | 0 | - |
| Totalling | 0 | 0 | - | 0 | - |
| The youngest and oldest submitted candidate for councils | ||
| Age | Institution | |
| Youngest | 19 | Sejmik Województwa Świętokrzyskiego |
| Oldest | 75 | Rada Powiatu Włoszczowskiego |
Province warmińsko-mazurskie
| Sejmik Województwa Warmińsko-Mazurskiego |
| Submitted candidates | ||||||
| Specification | Number of candidates | Women | Women (%) | Men | Men (%) | Status |
| Constituency no. 1 | 7 | 2 | 28,57% | 5 | 71,43% | Registered |
| Constituency no. 2 | 10 | 1 | 10,00% | 9 | 90,00% | Registered |
| Constituency no. 3 | 7 | 6 | 85,71% | 1 | 14,29% | Registered |
| Constituency no. 4 | 7 | 1 | 14,29% | 6 | 85,71% | Registered |
| Constituency no. 5 | 6 | 4 | 66,67% | 2 | 33,33% | Registered |
| Totalling | 37 | 14 | 37,84% | 23 | 62,16% | |
| Age of the candidates | |||||
| Specification | Average age | Average age of women | Average age of men | Oldest | Youngest |
| Constituency no. 1 | 51 | 52 | 51 | 57 | 43 |
| Constituency no. 2 | 46 | 33 | 47 | 59 | 33 |
| Constituency no. 3 | 38 | 34 | 59 | 59 | 21 |
| Constituency no. 4 | 40 | 58 | 37 | 67 | 22 |
| Constituency no. 5 | 49 | 43 | 61 | 81 | 26 |
| Specification |
| pow. elbląski |
| pow. iławski |
| pow. kętrzyński |
| pow. nowomiejski |
| The statistics of election committe |
| Lists submitted | ||
| Specification | Number of | |
| lists | councils | |
| Lists submitted for province council | 5 | 1 |
| Lists submitted for county councils | 8 | 3 |
| Lists submitted for councils of cities holding county rights | 0 | 0 |
| Lists registered for communal councils | 30 | 10 |
| Totalling | 43 | 14 |
| Submitted candidates | |||||
| Specification | Number of candidates | Women | Women (%) | Men | Men (%) |
| Number of candidates submitted for the province council | 37 | 14 | 37,84% | 23 | 62,16% |
| Number of candidates submitted for county councils | 51 | 4 | 7,84% | 47 | 92,16% |
| Number of candidates submitted for councils of cities holding county rights | 0 | 0 | - | 0 | - |
| Number of candidates registered for communal councils | 39 | 15 | 38,46% | 24 | 61,54% |
| Number of candidates submitted for reeve, mayor and presidential elections | 1 | 0 | 0,00% | 1 | 100,00% |
| Totalling | 128 | 33 | 25,78% | 95 | 74,22% |
| Average age of submitted candidates | |||
| Specification | Average age | Average age of women | Average age of men |
| Average age of candidates submitted for the province council | 45 | 41 | 47 |
| Average age of candidates submitted for county councils | 45 | 47 | 45 |
| Average age of candidates for councils of cities holding county rights | - | - | - |
| Average age of candidates submitted for communal councils | 45 | 39 | 49 |
| Average age of candidates for reeve, mayor, president | 49 | - | 49 |
| Totalling | 45 | 40 | 46 |
| Submitted candidates for councils grouped by age | |||||
| Age | Number of candidates | Women | Women (%) | Men | Men (%) |
| 18-29 | 18 | 8 | 44,44% | 10 | 55,56% |
| 30-39 | 23 | 5 | 21,74% | 18 | 78,26% |
| 40-59 | 72 | 19 | 26,39% | 53 | 73,61% |
| 60+ | 14 | 1 | 7,14% | 13 | 92,86% |
| Totalling | 127 | 33 | 25,98% | 94 | 74,02% |
| Submitted candidates for reeve, mayor, president grouped by age | |||||
| Age | Number of candidates | Women | Women (%) | Men | Men (%) |
| 25-29 | 0 | 0 | - | 0 | - |
| 30-39 | 0 | 0 | - | 0 | - |
| 40-59 | 1 | 0 | 0,00% | 1 | 100,00% |
| 60+ | 0 | 0 | - | 0 | - |
| Totalling | 1 | 0 | 0,00% | 1 | 100,00% |
| The youngest and oldest submitted candidate for councils | ||
| Age | Institution | |
| Youngest | 20 | Rada Powiatu w Nowym Mieście Lubawskim |
| Oldest | 81 | Sejmik Województwa Warmińsko-Mazurskiego |
| The youngest and oldest submitted candidate for reeve, mayor, president | ||
| Age | Institution | |
| Youngest | 49 | Wójt Gminy Biskupiec |
| Oldest | 49 | Wójt Gminy Biskupiec |
Province wielkopolskie
| Sejmik Województwa Wielkopolskiego |
| Submitted candidates | ||||||
| Specification | Number of candidates | Women | Women (%) | Men | Men (%) | Status |
| Constituency no. 5 | 6 | 1 | 16,67% | 5 | 83,33% | Registered |
| Totalling | 6 | 1 | 16,67% | 5 | 83,33% | |
| Age of the candidates | |||||
| Specification | Average age | Average age of women | Average age of men | Oldest | Youngest |
| Constituency no. 5 | 45 | 54 | 44 | 66 | 23 |
| Specification |
| pow. kaliski |
| pow. kolski |
| pow. koniński |
| pow. międzychodzki |
| pow. słupecki |
| pow. wągrowiecki |
| The statistics of election committe |
| Lists submitted | ||
| Specification | Number of | |
| lists | councils | |
| Lists submitted for province council | 1 | 1 |
| Lists submitted for county councils | 0 | 0 |
| Lists submitted for councils of cities holding county rights | 0 | 0 |
| Lists registered for communal councils | 20 | 11 |
| Totalling | 21 | 12 |
| Submitted candidates | |||||
| Specification | Number of candidates | Women | Women (%) | Men | Men (%) |
| Number of candidates submitted for the province council | 6 | 1 | 16,67% | 5 | 83,33% |
| Number of candidates submitted for county councils | 0 | 0 | - | 0 | - |
| Number of candidates submitted for councils of cities holding county rights | 0 | 0 | - | 0 | - |
| Number of candidates registered for communal councils | 23 | 8 | 34,78% | 15 | 65,22% |
| Number of candidates submitted for reeve, mayor and presidential elections | 1 | 0 | 0,00% | 1 | 100,00% |
| Totalling | 30 | 9 | 30,00% | 21 | 70,00% |
| Average age of submitted candidates | |||
| Specification | Average age | Average age of women | Average age of men |
| Average age of candidates submitted for the province council | 45 | 54 | 44 |
| Average age of candidates submitted for county councils | - | - | - |
| Average age of candidates for councils of cities holding county rights | - | - | - |
| Average age of candidates submitted for communal councils | 47 | 46 | 48 |
| Average age of candidates for reeve, mayor, president | 67 | - | 67 |
| Totalling | 47 | 46 | 47 |
| Submitted candidates for councils grouped by age | |||||
| Age | Number of candidates | Women | Women (%) | Men | Men (%) |
| 18-29 | 3 | 1 | 33,33% | 2 | 66,67% |
| 30-39 | 6 | 2 | 33,33% | 4 | 66,67% |
| 40-59 | 15 | 4 | 26,67% | 11 | 73,33% |
| 60+ | 5 | 2 | 40,00% | 3 | 60,00% |
| Totalling | 29 | 9 | 31,03% | 20 | 68,97% |
| Submitted candidates for reeve, mayor, president grouped by age | |||||
| Age | Number of candidates | Women | Women (%) | Men | Men (%) |
| 25-29 | 0 | 0 | - | 0 | - |
| 30-39 | 0 | 0 | - | 0 | - |
| 40-59 | 0 | 0 | - | 0 | - |
| 60+ | 1 | 0 | 0,00% | 1 | 100,00% |
| Totalling | 1 | 0 | 0,00% | 1 | 100,00% |
| The youngest and oldest submitted candidate for councils | ||
| Age | Institution | |
| Youngest | 22 | Rada Gminy Mieścisko |
| Oldest | 67 | Rada Gminy Mieścisko |
| The youngest and oldest submitted candidate for reeve, mayor, president | ||
| Age | Institution | |
| Youngest | 67 | Wójt Gminy Mieścisko |
| Oldest | 67 | Wójt Gminy Mieścisko |
Province zachodniopomorskie
| Sejmik Województwa Zachodniopomorskiego |
| Submitted candidates | ||||||
| Specification | Number of candidates | Women | Women (%) | Men | Men (%) | Status |
| Constituency no. 1 | 6 | 3 | 50,00% | 3 | 50,00% | Registered |
| Constituency no. 5 | 8 | 2 | 25,00% | 6 | 75,00% | Registered |
| Totalling | 14 | 5 | 35,71% | 9 | 64,29% | |
| Age of the candidates | |||||
| Specification | Average age | Average age of women | Average age of men | Oldest | Youngest |
| Constituency no. 1 | 48 | 40 | 56 | 84 | 22 |
| Constituency no. 5 | 42 | 20 | 49 | 59 | 20 |
| Specification |
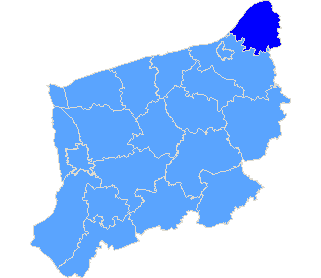
| pow. sławieński |
| The statistics of election committe |
| Lists submitted | ||
| Specification | Number of | |
| lists | councils | |
| Lists submitted for province council | 2 | 1 |
| Lists submitted for county councils | 0 | 0 |
| Lists submitted for councils of cities holding county rights | 0 | 0 |
| Lists registered for communal councils | 1 | 1 |
| Totalling | 3 | 2 |
| Submitted candidates | |||||
| Specification | Number of candidates | Women | Women (%) | Men | Men (%) |
| Number of candidates submitted for the province council | 14 | 5 | 35,71% | 9 | 64,29% |
| Number of candidates submitted for county councils | 0 | 0 | - | 0 | - |
| Number of candidates submitted for councils of cities holding county rights | 0 | 0 | - | 0 | - |
| Number of candidates registered for communal councils | 1 | 0 | 0,00% | 1 | 100,00% |
| Number of candidates submitted for reeve, mayor and presidential elections | 0 | 0 | - | 0 | - |
| Totalling | 15 | 5 | 33,33% | 10 | 66,67% |
| Average age of submitted candidates | |||
| Specification | Average age | Average age of women | Average age of men |
| Average age of candidates submitted for the province council | 44 | 32 | 51 |
| Average age of candidates submitted for county councils | - | - | - |
| Average age of candidates for councils of cities holding county rights | - | - | - |
| Average age of candidates submitted for communal councils | 54 | - | 54 |
| Average age of candidates for reeve, mayor, president | - | - | - |
| Totalling | 44 | 32 | 51 |
| Submitted candidates for councils grouped by age | |||||
| Age | Number of candidates | Women | Women (%) | Men | Men (%) |
| 18-29 | 5 | 4 | 80,00% | 1 | 20,00% |
| 30-39 | 2 | 0 | 0,00% | 2 | 100,00% |
| 40-59 | 5 | 0 | 0,00% | 5 | 100,00% |
| 60+ | 3 | 1 | 33,33% | 2 | 66,67% |
| Totalling | 15 | 5 | 33,33% | 10 | 66,67% |
| Submitted candidates for reeve, mayor, president grouped by age | |||||
| Age | Number of candidates | Women | Women (%) | Men | Men (%) |
| 25-29 | 0 | 0 | - | 0 | - |
| 30-39 | 0 | 0 | - | 0 | - |
| 40-59 | 0 | 0 | - | 0 | - |
| 60+ | 0 | 0 | - | 0 | - |
| Totalling | 0 | 0 | - | 0 | - |
| The youngest and oldest submitted candidate for councils | ||
| Age | Institution | |
| Youngest | 20 | Sejmik Województwa Zachodniopomorskiego |
| Oldest | 84 | Sejmik Województwa Zachodniopomorskiego |
