

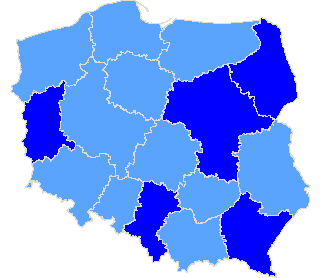
Rzeczpospolita Polska
| The statistics of election committe |
| Lists submitted | ||
| Specification | Number of | |
| lists | councils | |
| Lists submitted for provinces councils | 7 | 1 |
| Lists submitted for county councils | 1 | 1 |
| Lists submitted for councils of cities holding county rights | 1 | 1 |
| Lists submitted for districts councils of the cap. city of Warsaw | 0 | 0 |
| Lists registered for communal councils | 14 | 6 |
| Totalling | 23 | 9 |
| Submitted candidates | |||||
| Specification | Number of candidates | Women | Women (%) | Men | Men (%) |
| Number of candidates submitted for the province council | 49 | 20 | 40,82% | 29 | 59,18% |
| Number of candidates submitted for county councils | 3 | 3 | 100,00% | 0 | 0,00% |
| Number of candidates submitted for councils of cities holding county rights | 5 | 2 | 40,00% | 3 | 60,00% |
| Number of candidates submitted for districts councils of the cap. city of Warsaw | 0 | 0 | - | 0 | - |
| Number of candidates registered for communal councils | 18 | 4 | 22,22% | 14 | 77,78% |
| Number of candidates submitted for reeve, mayor and presidential elections | 1 | 0 | 0,00% | 1 | 100,00% |
| Totalling | 76 | 29 | 38,16% | 47 | 61,84% |
| Average age of submitted candidates | |||
| Specification | Average age | Average age of women | Average age of men |
| Average age of candidates submitted for the province council | 48 | 51 | 46 |
| Average age of candidates submitted for county councils | 41 | 41 | - |
| Average age of candidates for councils of cities holding county rights | 47 | 49 | 45 |
| Average age of candidates submitted for communal councils | 42 | 38 | 43 |
| Average age of candidates for reeve, mayor, president | 49 | - | 49 |
| Totalling | 46 | 48 | 45 |
| Submitted candidates for councils grouped by age | |||||
| Age | Number of candidates | Women | Women (%) | Men | Men (%) |
| 18-29 | 17 | 6 | 35,29% | 11 | 64,71% |
| 30-39 | 16 | 6 | 37,50% | 10 | 62,50% |
| 40-59 | 25 | 9 | 36,00% | 16 | 64,00% |
| 60+ | 17 | 8 | 47,06% | 9 | 52,94% |
| Totalling | 75 | 29 | 38,67% | 46 | 61,33% |
| Submitted candidates for reeve, mayor, president grouped by age | |||||
| Age | Number of candidates | Women | Women (%) | Men | Men (%) |
| 25-29 | 0 | 0 | - | 0 | - |
| 30-39 | 0 | 0 | - | 0 | - |
| 40-59 | 1 | 0 | 0,00% | 1 | 100,00% |
| 60+ | 0 | 0 | - | 0 | - |
| Totalling | 1 | 0 | 0,00% | 1 | 100,00% |
| The youngest and oldest submitted candidate for councils | ||
| Age | Institution | |
| Youngest | 19 | Rada Miasta Żagań |
| Oldest | 97 | Sejmik Województwa Mazowieckiego |
| The youngest and oldest submitted candidate for reeve, mayor, president | ||
| Age | Institution | |
| Youngest | 49 | Wójt Gminy Milejczyce |
| Oldest | 49 | Wójt Gminy Milejczyce |
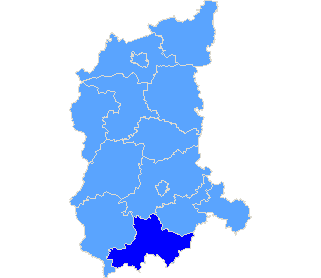
Province lubuskie
| Specification |
| pow. żagański |
| The statistics of election committe |
| Lists submitted | ||
| Specification | Number of | |
| lists | councils | |
| Lists submitted for province council | 0 | 0 |
| Lists submitted for county councils | 0 | 0 |
| Lists submitted for councils of cities holding county rights | 0 | 0 |
| Lists registered for communal councils | 1 | 1 |
| Totalling | 1 | 1 |
| Submitted candidates | |||||
| Specification | Number of candidates | Women | Women (%) | Men | Men (%) |
| Number of candidates submitted for the province council | 0 | 0 | - | 0 | - |
| Number of candidates submitted for county councils | 0 | 0 | - | 0 | - |
| Number of candidates submitted for councils of cities holding county rights | 0 | 0 | - | 0 | - |
| Number of candidates registered for communal councils | 5 | 1 | 20,00% | 4 | 80,00% |
| Number of candidates submitted for reeve, mayor and presidential elections | 0 | 0 | - | 0 | - |
| Totalling | 5 | 1 | 20,00% | 4 | 80,00% |
| Average age of submitted candidates | |||
| Specification | Average age | Average age of women | Average age of men |
| Average age of candidates submitted for the province council | - | - | - |
| Average age of candidates submitted for county councils | - | - | - |
| Average age of candidates for councils of cities holding county rights | - | - | - |
| Average age of candidates submitted for communal councils | 41 | 19 | 46 |
| Average age of candidates for reeve, mayor, president | - | - | - |
| Totalling | 41 | 19 | 46 |
| Submitted candidates for councils grouped by age | |||||
| Age | Number of candidates | Women | Women (%) | Men | Men (%) |
| 18-29 | 2 | 1 | 50,00% | 1 | 50,00% |
| 30-39 | 1 | 0 | 0,00% | 1 | 100,00% |
| 40-59 | 1 | 0 | 0,00% | 1 | 100,00% |
| 60+ | 1 | 0 | 0,00% | 1 | 100,00% |
| Totalling | 5 | 1 | 20,00% | 4 | 80,00% |
| Submitted candidates for reeve, mayor, president grouped by age | |||||
| Age | Number of candidates | Women | Women (%) | Men | Men (%) |
| 25-29 | 0 | 0 | - | 0 | - |
| 30-39 | 0 | 0 | - | 0 | - |
| 40-59 | 0 | 0 | - | 0 | - |
| 60+ | 0 | 0 | - | 0 | - |
| Totalling | 0 | 0 | - | 0 | - |
| The youngest and oldest submitted candidate for councils | ||
| Age | Institution | |
| Youngest | 19 | Rada Miasta Żagań |
| Oldest | 69 | Rada Miasta Żagań |
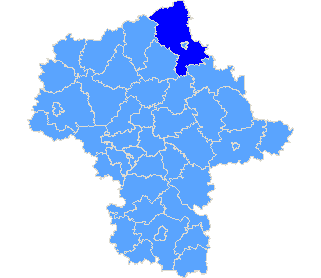
Province mazowieckie
| Sejmik Województwa Mazowieckiego |
| Submitted candidates | ||||||
| Specification | Number of candidates | Women | Women (%) | Men | Men (%) | Status |
| Constituency no. 1 | 5 | 3 | 60,00% | 2 | 40,00% | Registered |
| Constituency no. 2 | 6 | 2 | 33,33% | 4 | 66,67% | Registered |
| Constituency no. 3 | 5 | 3 | 60,00% | 2 | 40,00% | Registered |
| Constituency no. 4 | 9 | 4 | 44,44% | 5 | 55,56% | Registered |
| Constituency no. 5 | 7 | 3 | 42,86% | 4 | 57,14% | Registered |
| Constituency no. 6 | 9 | 2 | 22,22% | 7 | 77,78% | Registered |
| Constituency no. 7 | 8 | 3 | 37,50% | 5 | 62,50% | Registered |
| Totalling | 49 | 20 | 40,82% | 29 | 59,18% | |
| Age of the candidates | |||||
| Specification | Average age | Average age of women | Average age of men | Oldest | Youngest |
| Constituency no. 1 | 54 | 59 | 47 | 79 | 32 |
| Constituency no. 2 | 47 | 41 | 50 | 71 | 26 |
| Constituency no. 3 | 52 | 59 | 41 | 67 | 24 |
| Constituency no. 4 | 46 | 49 | 44 | 72 | 25 |
| Constituency no. 5 | 39 | 38 | 39 | 77 | 21 |
| Constituency no. 6 | 48 | 47 | 48 | 80 | 19 |
| Constituency no. 7 | 54 | 58 | 51 | 97 | 25 |
| Specification |
| pow. ostrołęcki |
| The statistics of election committe |
| Lists submitted | ||
| Specification | Number of | |
| lists | councils | |
| Lists submitted for province council | 7 | 1 |
| Lists submitted for county councils | 0 | 0 |
| Lists submitted for councils of cities holding county rights | 0 | 0 |
| Lists submitted for districts councils of the cap. city of Warsaw | 0 | 0 |
| Lists registered for communal councils | 1 | 1 |
| Totalling | 8 | 2 |
| Submitted candidates | |||||
| Specification | Number of candidates | Women | Women (%) | Men | Men (%) |
| Number of candidates submitted for the province council | 49 | 20 | 40,82% | 29 | 59,18% |
| Number of candidates submitted for county councils | 0 | 0 | - | 0 | - |
| Number of candidates submitted for councils of cities holding county rights | 0 | 0 | - | 0 | - |
| Number of candidates submitted for districts councils of the cap. city of Warsaw | 0 | 0 | - | 0 | - |
| Number of candidates registered for communal councils | 1 | 0 | 0,00% | 1 | 100,00% |
| Number of candidates submitted for reeve, mayor and presidential elections | 0 | 0 | - | 0 | - |
| Totalling | 50 | 20 | 40,00% | 30 | 60,00% |
| Average age of submitted candidates | |||
| Specification | Average age | Average age of women | Average age of men |
| Average age of candidates submitted for the province council | 48 | 51 | 46 |
| Average age of candidates submitted for county councils | - | - | - |
| Average age of candidates for councils of cities holding county rights | - | - | - |
| Average age of candidates for districts councils of the cap. city of Warsaw | - | - | - |
| Average age of candidates submitted for communal councils | 58 | - | 58 |
| Average age of candidates for reeve, mayor, president | - | - | - |
| Totalling | 48 | 51 | 46 |
| Submitted candidates for councils grouped by age | |||||
| Age | Number of candidates | Women | Women (%) | Men | Men (%) |
| 18-29 | 10 | 3 | 30,00% | 7 | 70,00% |
| 30-39 | 11 | 4 | 36,36% | 7 | 63,64% |
| 40-59 | 16 | 7 | 43,75% | 9 | 56,25% |
| 60+ | 13 | 6 | 46,15% | 7 | 53,85% |
| Totalling | 50 | 20 | 40,00% | 30 | 60,00% |
| Submitted candidates for reeve, mayor, president grouped by age | |||||
| Age | Number of candidates | Women | Women (%) | Men | Men (%) |
| 25-29 | 0 | 0 | - | 0 | - |
| 30-39 | 0 | 0 | - | 0 | - |
| 40-59 | 0 | 0 | - | 0 | - |
| 60+ | 0 | 0 | - | 0 | - |
| Totalling | 0 | 0 | - | 0 | - |
| The youngest and oldest submitted candidate for councils | ||
| Age | Institution | |
| Youngest | 19 | Sejmik Województwa Mazowieckiego |
| Oldest | 97 | Sejmik Województwa Mazowieckiego |
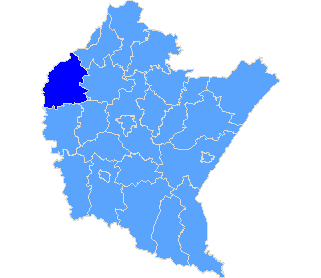
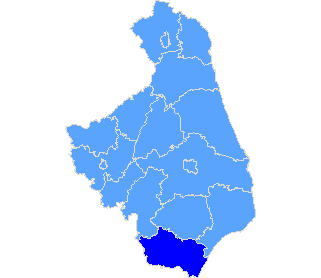
Province podkarpackie
| Specification |
| pow. mielecki |
| The statistics of election committe |
| Lists submitted | ||
| Specification | Number of | |
| lists | councils | |
| Lists submitted for province council | 0 | 0 |
| Lists submitted for county councils | 0 | 0 |
| Lists submitted for councils of cities holding county rights | 0 | 0 |
| Lists registered for communal councils | 4 | 1 |
| Totalling | 4 | 1 |
| Submitted candidates | |||||
| Specification | Number of candidates | Women | Women (%) | Men | Men (%) |
| Number of candidates submitted for the province council | 0 | 0 | - | 0 | - |
| Number of candidates submitted for county councils | 0 | 0 | - | 0 | - |
| Number of candidates submitted for councils of cities holding county rights | 0 | 0 | - | 0 | - |
| Number of candidates registered for communal councils | 4 | 0 | 0,00% | 4 | 100,00% |
| Number of candidates submitted for reeve, mayor and presidential elections | 0 | 0 | - | 0 | - |
| Totalling | 4 | 0 | 0,00% | 4 | 100,00% |
| Average age of submitted candidates | |||
| Specification | Average age | Average age of women | Average age of men |
| Average age of candidates submitted for the province council | - | - | - |
| Average age of candidates submitted for county councils | - | - | - |
| Average age of candidates for councils of cities holding county rights | - | - | - |
| Average age of candidates submitted for communal councils | 49 | - | 49 |
| Average age of candidates for reeve, mayor, president | - | - | - |
| Totalling | 49 | - | 49 |
| Submitted candidates for councils grouped by age | |||||
| Age | Number of candidates | Women | Women (%) | Men | Men (%) |
| 18-29 | 0 | 0 | - | 0 | - |
| 30-39 | 1 | 0 | 0,00% | 1 | 100,00% |
| 40-59 | 2 | 0 | 0,00% | 2 | 100,00% |
| 60+ | 1 | 0 | 0,00% | 1 | 100,00% |
| Totalling | 4 | 0 | 0,00% | 4 | 100,00% |
| Submitted candidates for reeve, mayor, president grouped by age | |||||
| Age | Number of candidates | Women | Women (%) | Men | Men (%) |
| 25-29 | 0 | 0 | - | 0 | - |
| 30-39 | 0 | 0 | - | 0 | - |
| 40-59 | 0 | 0 | - | 0 | - |
| 60+ | 0 | 0 | - | 0 | - |
| Totalling | 0 | 0 | - | 0 | - |
| The youngest and oldest submitted candidate for councils | ||
| Age | Institution | |
| Youngest | 39 | Rada Gminy w Czerminie |
| Oldest | 66 | Rada Gminy w Czerminie |
Province podlaskie
| Specification |
| pow. siemiatycki |
| The statistics of election committe |
| Lists submitted | ||
| Specification | Number of | |
| lists | councils | |
| Lists submitted for province council | 0 | 0 |
| Lists submitted for county councils | 1 | 1 |
| Lists submitted for councils of cities holding county rights | 0 | 0 |
| Lists registered for communal councils | 7 | 2 |
| Totalling | 8 | 3 |
| Submitted candidates | |||||
| Specification | Number of candidates | Women | Women (%) | Men | Men (%) |
| Number of candidates submitted for the province council | 0 | 0 | - | 0 | - |
| Number of candidates submitted for county councils | 3 | 3 | 100,00% | 0 | 0,00% |
| Number of candidates submitted for councils of cities holding county rights | 0 | 0 | - | 0 | - |
| Number of candidates registered for communal councils | 7 | 2 | 28,57% | 5 | 71,43% |
| Number of candidates submitted for reeve, mayor and presidential elections | 1 | 0 | 0,00% | 1 | 100,00% |
| Totalling | 11 | 5 | 45,45% | 6 | 54,55% |
| Average age of submitted candidates | |||
| Specification | Average age | Average age of women | Average age of men |
| Average age of candidates submitted for the province council | - | - | - |
| Average age of candidates submitted for county councils | 41 | 41 | - |
| Average age of candidates for councils of cities holding county rights | - | - | - |
| Average age of candidates submitted for communal councils | 33 | 32 | 34 |
| Average age of candidates for reeve, mayor, president | 49 | - | 49 |
| Totalling | 36 | 37 | 36 |
| Submitted candidates for councils grouped by age | |||||
| Age | Number of candidates | Women | Women (%) | Men | Men (%) |
| 18-29 | 4 | 1 | 25,00% | 3 | 75,00% |
| 30-39 | 2 | 2 | 100,00% | 0 | 0,00% |
| 40-59 | 4 | 2 | 50,00% | 2 | 50,00% |
| 60+ | 0 | 0 | - | 0 | - |
| Totalling | 10 | 5 | 50,00% | 5 | 50,00% |
| Submitted candidates for reeve, mayor, president grouped by age | |||||
| Age | Number of candidates | Women | Women (%) | Men | Men (%) |
| 25-29 | 0 | 0 | - | 0 | - |
| 30-39 | 0 | 0 | - | 0 | - |
| 40-59 | 1 | 0 | 0,00% | 1 | 100,00% |
| 60+ | 0 | 0 | - | 0 | - |
| Totalling | 1 | 0 | 0,00% | 1 | 100,00% |
| The youngest and oldest submitted candidate for councils | ||
| Age | Institution | |
| Youngest | 19 | Rada Gminy Milejczyce |
| Oldest | 55 | Rada Gminy Siemiatycze |
| The youngest and oldest submitted candidate for reeve, mayor, president | ||
| Age | Institution | |
| Youngest | 49 | Wójt Gminy Milejczyce |
| Oldest | 49 | Wójt Gminy Milejczyce |
Province śląskie
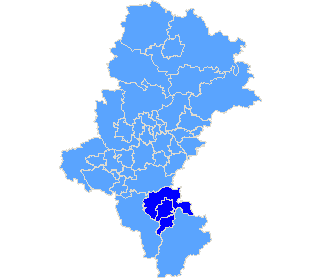
| Specification |
| m. Bielsko-Biała |
| pow. bielski |
| The statistics of election committe |
| Lists submitted | ||
| Specification | Number of | |
| lists | councils | |
| Lists submitted for province council | 0 | 0 |
| Lists submitted for county councils | 0 | 0 |
| Lists submitted for councils of cities holding county rights | 1 | 1 |
| Lists registered for communal councils | 1 | 1 |
| Totalling | 2 | 2 |
| Submitted candidates | |||||
| Specification | Number of candidates | Women | Women (%) | Men | Men (%) |
| Number of candidates submitted for the province council | 0 | 0 | - | 0 | - |
| Number of candidates submitted for county councils | 0 | 0 | - | 0 | - |
| Number of candidates submitted for councils of cities holding county rights | 5 | 2 | 40,00% | 3 | 60,00% |
| Number of candidates registered for communal councils | 1 | 1 | 100,00% | 0 | 0,00% |
| Number of candidates submitted for reeve, mayor and presidential elections | 0 | 0 | - | 0 | - |
| Totalling | 6 | 3 | 50,00% | 3 | 50,00% |
| Average age of submitted candidates | |||
| Specification | Average age | Average age of women | Average age of men |
| Average age of candidates submitted for the province council | - | - | - |
| Average age of candidates submitted for county councils | - | - | - |
| Average age of candidates for councils of cities holding county rights | 47 | 49 | 45 |
| Average age of candidates submitted for communal councils | 72 | 72 | - |
| Average age of candidates for reeve, mayor, president | - | - | - |
| Totalling | 51 | 56 | 45 |
| Submitted candidates for councils grouped by age | |||||
| Age | Number of candidates | Women | Women (%) | Men | Men (%) |
| 18-29 | 1 | 1 | 100,00% | 0 | 0,00% |
| 30-39 | 1 | 0 | 0,00% | 1 | 100,00% |
| 40-59 | 2 | 0 | 0,00% | 2 | 100,00% |
| 60+ | 2 | 2 | 100,00% | 0 | 0,00% |
| Totalling | 6 | 3 | 50,00% | 3 | 50,00% |
| Submitted candidates for reeve, mayor, president grouped by age | |||||
| Age | Number of candidates | Women | Women (%) | Men | Men (%) |
| 25-29 | 0 | 0 | - | 0 | - |
| 30-39 | 0 | 0 | - | 0 | - |
| 40-59 | 0 | 0 | - | 0 | - |
| 60+ | 0 | 0 | - | 0 | - |
| Totalling | 0 | 0 | - | 0 | - |
| The youngest and oldest submitted candidate for councils | ||
| Age | Institution | |
| Youngest | 22 | Rada Miejska w Bielsku-Białej |
| Oldest | 76 | Rada Miejska w Bielsku-Białej |
