

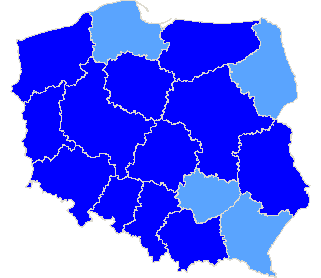
Rzeczpospolita Polska
| The statistics of election committe |
| Lists submitted | ||
| Specification | Number of | |
| lists | councils | |
| Lists submitted for provinces councils | 33 | 9 |
| Lists submitted for county councils | 9 | 3 |
| Lists submitted for councils of cities holding county rights | 20 | 4 |
| Lists submitted for districts councils of the cap. city of Warsaw | 0 | 0 |
| Lists registered for communal councils | 46 | 9 |
| Totalling | 108 | 25 |
| Submitted candidates | |||||
| Specification | Number of candidates | Women | Women (%) | Men | Men (%) |
| Number of candidates submitted for the province council | 266 | 97 | 36,47% | 169 | 63,53% |
| Number of candidates submitted for county councils | 41 | 12 | 29,27% | 29 | 70,73% |
| Number of candidates submitted for councils of cities holding county rights | 134 | 48 | 35,82% | 86 | 64,18% |
| Number of candidates submitted for districts councils of the cap. city of Warsaw | 0 | 0 | - | 0 | - |
| Number of candidates registered for communal councils | 50 | 20 | 40,00% | 30 | 60,00% |
| Number of candidates submitted for reeve, mayor and presidential elections | 6 | 0 | 0,00% | 6 | 100,00% |
| Totalling | 497 | 177 | 35,61% | 320 | 64,39% |
| Average age of submitted candidates | |||
| Specification | Average age | Average age of women | Average age of men |
| Average age of candidates submitted for the province council | 44 | 41 | 45 |
| Average age of candidates submitted for county councils | 44 | 43 | 45 |
| Average age of candidates for councils of cities holding county rights | 46 | 44 | 47 |
| Average age of candidates submitted for communal councils | 44 | 39 | 48 |
| Average age of candidates for reeve, mayor, president | 47 | - | 47 |
| Totalling | 44 | 41 | 45 |
| Submitted candidates for councils grouped by age | |||||
| Age | Number of candidates | Women | Women (%) | Men | Men (%) |
| 18-29 | 108 | 45 | 41,67% | 63 | 58,33% |
| 30-39 | 92 | 38 | 41,30% | 54 | 58,70% |
| 40-59 | 191 | 71 | 37,17% | 120 | 62,83% |
| 60+ | 100 | 23 | 23,00% | 77 | 77,00% |
| Totalling | 491 | 177 | 36,05% | 314 | 63,95% |
| Submitted candidates for reeve, mayor, president grouped by age | |||||
| Age | Number of candidates | Women | Women (%) | Men | Men (%) |
| 25-29 | 0 | 0 | - | 0 | - |
| 30-39 | 2 | 0 | 0,00% | 2 | 100,00% |
| 40-59 | 3 | 0 | 0,00% | 3 | 100,00% |
| 60+ | 1 | 0 | 0,00% | 1 | 100,00% |
| Totalling | 6 | 0 | 0,00% | 6 | 100,00% |
| The youngest and oldest submitted candidate for councils | ||
| Age | Institution | |
| Youngest | 18 | Rada Miasta Rybnika |
| Oldest | 83 | Rada m.st. Warszawy |
| The youngest and oldest submitted candidate for reeve, mayor, president | ||
| Age | Institution | |
| Youngest | 32 | Prezydent Miasta Torunia |
| Oldest | 63 | Wójt Gminy Brzeźnio |
| Sejmik Województwa Dolnośląskiego |
| Submitted candidates | ||||||
| Specification | Number of candidates | Women | Women (%) | Men | Men (%) | Status |
| Constituency no. 1 | 8 | 4 | 50,00% | 4 | 50,00% | Registered |
| Constituency no. 2 | 10 | 6 | 60,00% | 4 | 40,00% | Registered |
| Constituency no. 3 | 11 | 2 | 18,18% | 9 | 81,82% | Registered |
| Constituency no. 4 | 6 | 3 | 50,00% | 3 | 50,00% | Registered |
| Constituency no. 5 | 6 | 3 | 50,00% | 3 | 50,00% | Registered |
| Totalling | 41 | 18 | 43,90% | 23 | 56,10% | |
| Age of the candidates | |||||
| Specification | Average age | Average age of women | Average age of men | Oldest | Youngest |
| Constituency no. 1 | 55 | 62 | 48 | 72 | 32 |
| Constituency no. 2 | 45 | 45 | 45 | 64 | 24 |
| Constituency no. 3 | 52 | 57 | 51 | 68 | 27 |
| Constituency no. 4 | 49 | 47 | 52 | 75 | 30 |
| Constituency no. 5 | 57 | 52 | 62 | 68 | 35 |
| Specification |
| The statistics of election committe |
| Lists submitted | ||
| Specification | Number of | |
| lists | councils | |
| Lists submitted for province council | 5 | 1 |
| Lists submitted for county councils | 0 | 0 |
| Lists submitted for councils of cities holding county rights | 0 | 0 |
| Lists registered for communal councils | 0 | 0 |
| Totalling | 5 | 1 |
| Submitted candidates | |||||
| Specification | Number of candidates | Women | Women (%) | Men | Men (%) |
| Number of candidates submitted for the province council | 41 | 18 | 43,90% | 23 | 56,10% |
| Number of candidates submitted for county councils | 0 | 0 | - | 0 | - |
| Number of candidates submitted for councils of cities holding county rights | 0 | 0 | - | 0 | - |
| Number of candidates registered for communal councils | 0 | 0 | - | 0 | - |
| Number of candidates submitted for reeve, mayor and presidential elections | 0 | 0 | - | 0 | - |
| Totalling | 41 | 18 | 43,90% | 23 | 56,10% |
| Average age of submitted candidates | |||
| Specification | Average age | Average age of women | Average age of men |
| Average age of candidates submitted for the province council | 51 | 52 | 51 |
| Average age of candidates submitted for county councils | - | - | - |
| Average age of candidates for councils of cities holding county rights | - | - | - |
| Average age of candidates submitted for communal councils | - | - | - |
| Average age of candidates for reeve, mayor, president | - | - | - |
| Totalling | 51 | 52 | 51 |
| Submitted candidates for councils grouped by age | |||||
| Age | Number of candidates | Women | Women (%) | Men | Men (%) |
| 18-29 | 2 | 0 | 0,00% | 2 | 100,00% |
| 30-39 | 8 | 5 | 62,50% | 3 | 37,50% |
| 40-59 | 20 | 8 | 40,00% | 12 | 60,00% |
| 60+ | 11 | 5 | 45,45% | 6 | 54,55% |
| Totalling | 41 | 18 | 43,90% | 23 | 56,10% |
| Submitted candidates for reeve, mayor, president grouped by age | |||||
| Age | Number of candidates | Women | Women (%) | Men | Men (%) |
| 25-29 | 0 | 0 | - | 0 | - |
| 30-39 | 0 | 0 | - | 0 | - |
| 40-59 | 0 | 0 | - | 0 | - |
| 60+ | 0 | 0 | - | 0 | - |
| Totalling | 0 | 0 | - | 0 | - |
| The youngest and oldest submitted candidate for councils | ||
| Age | Institution | |
| Youngest | 24 | Sejmik Województwa Dolnośląskiego |
| Oldest | 75 | Sejmik Województwa Dolnośląskiego |
Province kujawsko-pomorskie
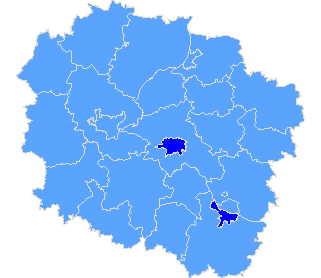
| Sejmik Województwa Kujawsko-Pomorskiego |
| Submitted candidates | ||||||
| Specification | Number of candidates | Women | Women (%) | Men | Men (%) | Status |
| Constituency no. 1 | 9 | 1 | 11,11% | 8 | 88,89% | Registered |
| Constituency no. 2 | 7 | 3 | 42,86% | 4 | 57,14% | Registered |
| Constituency no. 3 | 9 | 2 | 22,22% | 7 | 77,78% | Registered |
| Constituency no. 4 | 9 | 2 | 22,22% | 7 | 77,78% | Registered |
| Constituency no. 5 | 8 | 0 | 0,00% | 8 | 100,00% | Registered |
| Constituency no. 6 | 10 | 3 | 30,00% | 7 | 70,00% | Registered |
| Totalling | 52 | 11 | 21,15% | 41 | 78,85% | |
| Age of the candidates | |||||
| Specification | Average age | Average age of women | Average age of men | Oldest | Youngest |
| Constituency no. 1 | 56 | 35 | 58 | 73 | 31 |
| Constituency no. 2 | 55 | 56 | 55 | 64 | 41 |
| Constituency no. 3 | 54 | 52 | 54 | 73 | 33 |
| Constituency no. 4 | 57 | 46 | 60 | 65 | 39 |
| Constituency no. 5 | 52 | - | 52 | 68 | 19 |
| Constituency no. 6 | 52 | 49 | 54 | 68 | 38 |
| Specification |
| m. Toruń |
| m. Włocławek |
| The statistics of election committe |
| Lists submitted | ||
| Specification | Number of | |
| lists | councils | |
| Lists submitted for province council | 6 | 1 |
| Lists submitted for county councils | 0 | 0 |
| Lists submitted for councils of cities holding county rights | 7 | 2 |
| Lists registered for communal councils | 0 | 0 |
| Totalling | 13 | 3 |
| Submitted candidates | |||||
| Specification | Number of candidates | Women | Women (%) | Men | Men (%) |
| Number of candidates submitted for the province council | 52 | 11 | 21,15% | 41 | 78,85% |
| Number of candidates submitted for county councils | 0 | 0 | - | 0 | - |
| Number of candidates submitted for councils of cities holding county rights | 58 | 17 | 29,31% | 41 | 70,69% |
| Number of candidates registered for communal councils | 0 | 0 | - | 0 | - |
| Number of candidates submitted for reeve, mayor and presidential elections | 2 | 0 | 0,00% | 2 | 100,00% |
| Totalling | 112 | 28 | 25,00% | 84 | 75,00% |
| Average age of submitted candidates | |||
| Specification | Average age | Average age of women | Average age of men |
| Average age of candidates submitted for the province council | 54 | 49 | 55 |
| Average age of candidates submitted for county councils | - | - | - |
| Average age of candidates for councils of cities holding county rights | 50 | 47 | 52 |
| Average age of candidates submitted for communal councils | - | - | - |
| Average age of candidates for reeve, mayor, president | 43 | - | 43 |
| Totalling | 51 | 47 | 53 |
| Submitted candidates for councils grouped by age | |||||
| Age | Number of candidates | Women | Women (%) | Men | Men (%) |
| 18-29 | 10 | 4 | 40,00% | 6 | 60,00% |
| 30-39 | 14 | 3 | 21,43% | 11 | 78,57% |
| 40-59 | 47 | 15 | 31,91% | 32 | 68,09% |
| 60+ | 39 | 6 | 15,38% | 33 | 84,62% |
| Totalling | 110 | 28 | 25,45% | 82 | 74,55% |
| Submitted candidates for reeve, mayor, president grouped by age | |||||
| Age | Number of candidates | Women | Women (%) | Men | Men (%) |
| 25-29 | 0 | 0 | - | 0 | - |
| 30-39 | 1 | 0 | 0,00% | 1 | 100,00% |
| 40-59 | 1 | 0 | 0,00% | 1 | 100,00% |
| 60+ | 0 | 0 | - | 0 | - |
| Totalling | 2 | 0 | 0,00% | 2 | 100,00% |
| The youngest and oldest submitted candidate for councils | ||
| Age | Institution | |
| Youngest | 19 | Sejmik Województwa Kujawsko-Pomorskiego |
| Oldest | 77 | Rada Miasta Torunia |
| The youngest and oldest submitted candidate for reeve, mayor, president | ||
| Age | Institution | |
| Youngest | 32 | Prezydent Miasta Torunia |
| Oldest | 55 | Prezydent Miasta Włocławek |
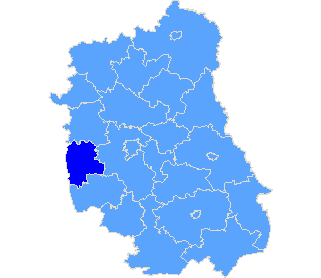
Province lubelskie
| Sejmik Województwa Lubelskiego |
| Submitted candidates | ||||||
| Specification | Number of candidates | Women | Women (%) | Men | Men (%) | Status |
| Constituency no. 1 | 9 | 2 | 22,22% | 7 | 77,78% | Registered |
| Constituency no. 2 | 11 | 6 | 54,55% | 5 | 45,45% | Registered |
| Constituency no. 3 | 6 | 1 | 16,67% | 5 | 83,33% | Registered |
| Constituency no. 4 | 7 | 1 | 14,29% | 6 | 85,71% | Registered |
| Constituency no. 5 | 8 | 3 | 37,50% | 5 | 62,50% | Registered |
| Totalling | 41 | 13 | 31,71% | 28 | 68,29% | |
| Age of the candidates | |||||
| Specification | Average age | Average age of women | Average age of men | Oldest | Youngest |
| Constituency no. 1 | 39 | 27 | 43 | 65 | 24 |
| Constituency no. 2 | 30 | 27 | 34 | 60 | 20 |
| Constituency no. 3 | 46 | 52 | 45 | 63 | 24 |
| Constituency no. 4 | 30 | 36 | 30 | 39 | 24 |
| Constituency no. 5 | 28 | 29 | 27 | 38 | 24 |
| Specification |
| pow. opolski |
| The statistics of election committe |
| Lists submitted | ||
| Specification | Number of | |
| lists | councils | |
| Lists submitted for province council | 5 | 1 |
| Lists submitted for county councils | 0 | 0 |
| Lists submitted for councils of cities holding county rights | 0 | 0 |
| Lists registered for communal councils | 10 | 1 |
| Totalling | 15 | 2 |
| Submitted candidates | |||||
| Specification | Number of candidates | Women | Women (%) | Men | Men (%) |
| Number of candidates submitted for the province council | 41 | 13 | 31,71% | 28 | 68,29% |
| Number of candidates submitted for county councils | 0 | 0 | - | 0 | - |
| Number of candidates submitted for councils of cities holding county rights | 0 | 0 | - | 0 | - |
| Number of candidates registered for communal councils | 10 | 3 | 30,00% | 7 | 70,00% |
| Number of candidates submitted for reeve, mayor and presidential elections | 1 | 0 | 0,00% | 1 | 100,00% |
| Totalling | 52 | 16 | 30,77% | 36 | 69,23% |
| Average age of submitted candidates | |||
| Specification | Average age | Average age of women | Average age of men |
| Average age of candidates submitted for the province council | 34 | 30 | 36 |
| Average age of candidates submitted for county councils | - | - | - |
| Average age of candidates for councils of cities holding county rights | - | - | - |
| Average age of candidates submitted for communal councils | 43 | 37 | 46 |
| Average age of candidates for reeve, mayor, president | 37 | - | 37 |
| Totalling | 35 | 31 | 37 |
| Submitted candidates for councils grouped by age | |||||
| Age | Number of candidates | Women | Women (%) | Men | Men (%) |
| 18-29 | 24 | 10 | 41,67% | 14 | 58,33% |
| 30-39 | 12 | 3 | 25,00% | 9 | 75,00% |
| 40-59 | 9 | 3 | 33,33% | 6 | 66,67% |
| 60+ | 6 | 0 | 0,00% | 6 | 100,00% |
| Totalling | 51 | 16 | 31,37% | 35 | 68,63% |
| Submitted candidates for reeve, mayor, president grouped by age | |||||
| Age | Number of candidates | Women | Women (%) | Men | Men (%) |
| 25-29 | 0 | 0 | - | 0 | - |
| 30-39 | 1 | 0 | 0,00% | 1 | 100,00% |
| 40-59 | 0 | 0 | - | 0 | - |
| 60+ | 0 | 0 | - | 0 | - |
| Totalling | 1 | 0 | 0,00% | 1 | 100,00% |
| The youngest and oldest submitted candidate for councils | ||
| Age | Institution | |
| Youngest | 20 | Sejmik Województwa Lubelskiego |
| Oldest | 75 | Rada Miejska w Opolu Lubelskim |
| The youngest and oldest submitted candidate for reeve, mayor, president | ||
| Age | Institution | |
| Youngest | 37 | Burmistrz Opola Lubelskiego |
| Oldest | 37 | Burmistrz Opola Lubelskiego |
Province lubuskie
| Specification |
| pow. krośnieński |
| The statistics of election committe |
| Lists submitted | ||
| Specification | Number of | |
| lists | councils | |
| Lists submitted for province council | 0 | 0 |
| Lists submitted for county councils | 0 | 0 |
| Lists submitted for councils of cities holding county rights | 0 | 0 |
| Lists registered for communal councils | 4 | 1 |
| Totalling | 4 | 1 |
| Submitted candidates | |||||
| Specification | Number of candidates | Women | Women (%) | Men | Men (%) |
| Number of candidates submitted for the province council | 0 | 0 | - | 0 | - |
| Number of candidates submitted for county councils | 0 | 0 | - | 0 | - |
| Number of candidates submitted for councils of cities holding county rights | 0 | 0 | - | 0 | - |
| Number of candidates registered for communal councils | 6 | 4 | 66,67% | 2 | 33,33% |
| Number of candidates submitted for reeve, mayor and presidential elections | 0 | 0 | - | 0 | - |
| Totalling | 6 | 4 | 66,67% | 2 | 33,33% |
| Average age of submitted candidates | |||
| Specification | Average age | Average age of women | Average age of men |
| Average age of candidates submitted for the province council | - | - | - |
| Average age of candidates submitted for county councils | - | - | - |
| Average age of candidates for councils of cities holding county rights | - | - | - |
| Average age of candidates submitted for communal councils | 50 | 48 | 54 |
| Average age of candidates for reeve, mayor, president | - | - | - |
| Totalling | 50 | 48 | 54 |
| Submitted candidates for councils grouped by age | |||||
| Age | Number of candidates | Women | Women (%) | Men | Men (%) |
| 18-29 | 0 | 0 | - | 0 | - |
| 30-39 | 1 | 1 | 100,00% | 0 | 0,00% |
| 40-59 | 4 | 2 | 50,00% | 2 | 50,00% |
| 60+ | 1 | 1 | 100,00% | 0 | 0,00% |
| Totalling | 6 | 4 | 66,67% | 2 | 33,33% |
| Submitted candidates for reeve, mayor, president grouped by age | |||||
| Age | Number of candidates | Women | Women (%) | Men | Men (%) |
| 25-29 | 0 | 0 | - | 0 | - |
| 30-39 | 0 | 0 | - | 0 | - |
| 40-59 | 0 | 0 | - | 0 | - |
| 60+ | 0 | 0 | - | 0 | - |
| Totalling | 0 | 0 | - | 0 | - |
| The youngest and oldest submitted candidate for councils | ||
| Age | Institution | |
| Youngest | 30 | Rada Miejska w Gubinie |
| Oldest | 64 | Rada Miejska w Gubinie |
Province łódzkie
| Specification |
| pow. kutnowski |
| pow. sieradzki |
| The statistics of election committe |
| Lists submitted | ||
| Specification | Number of | |
| lists | councils | |
| Lists submitted for province council | 0 | 0 |
| Lists submitted for county councils | 1 | 1 |
| Lists submitted for councils of cities holding county rights | 0 | 0 |
| Lists registered for communal councils | 9 | 2 |
| Totalling | 10 | 3 |
| Submitted candidates | |||||
| Specification | Number of candidates | Women | Women (%) | Men | Men (%) |
| Number of candidates submitted for the province council | 0 | 0 | - | 0 | - |
| Number of candidates submitted for county councils | 3 | 1 | 33,33% | 2 | 66,67% |
| Number of candidates submitted for councils of cities holding county rights | 0 | 0 | - | 0 | - |
| Number of candidates registered for communal councils | 11 | 3 | 27,27% | 8 | 72,73% |
| Number of candidates submitted for reeve, mayor and presidential elections | 1 | 0 | 0,00% | 1 | 100,00% |
| Totalling | 15 | 4 | 26,67% | 11 | 73,33% |
| Average age of submitted candidates | |||
| Specification | Average age | Average age of women | Average age of men |
| Average age of candidates submitted for the province council | - | - | - |
| Average age of candidates submitted for county councils | 35 | 41 | 32 |
| Average age of candidates for councils of cities holding county rights | - | - | - |
| Average age of candidates submitted for communal councils | 49 | 38 | 53 |
| Average age of candidates for reeve, mayor, president | 63 | - | 63 |
| Totalling | 47 | 38 | 50 |
| Submitted candidates for councils grouped by age | |||||
| Age | Number of candidates | Women | Women (%) | Men | Men (%) |
| 18-29 | 2 | 0 | 0,00% | 2 | 100,00% |
| 30-39 | 2 | 2 | 100,00% | 0 | 0,00% |
| 40-59 | 7 | 2 | 28,57% | 5 | 71,43% |
| 60+ | 3 | 0 | 0,00% | 3 | 100,00% |
| Totalling | 14 | 4 | 28,57% | 10 | 71,43% |
| Submitted candidates for reeve, mayor, president grouped by age | |||||
| Age | Number of candidates | Women | Women (%) | Men | Men (%) |
| 25-29 | 0 | 0 | - | 0 | - |
| 30-39 | 0 | 0 | - | 0 | - |
| 40-59 | 0 | 0 | - | 0 | - |
| 60+ | 1 | 0 | 0,00% | 1 | 100,00% |
| Totalling | 1 | 0 | 0,00% | 1 | 100,00% |
| The youngest and oldest submitted candidate for councils | ||
| Age | Institution | |
| Youngest | 20 | Rada Powiatu Sieradzkiego |
| Oldest | 72 | Rada Miejska w Żychlinie |
| The youngest and oldest submitted candidate for reeve, mayor, president | ||
| Age | Institution | |
| Youngest | 63 | Wójt Gminy Brzeźnio |
| Oldest | 63 | Wójt Gminy Brzeźnio |
| Sejmik Województwa Małopolskiego |
| Submitted candidates | ||||||
| Specification | Number of candidates | Women | Women (%) | Men | Men (%) | Status |
| Constituency no. 2 | 6 | 4 | 66,67% | 2 | 33,33% | Registered |
| Constituency no. 3 | 9 | 5 | 55,56% | 4 | 44,44% | Registered |
| Constituency no. 4 | 14 | 2 | 14,29% | 12 | 85,71% | Registered |
| Constituency no. 5 | 5 | 3 | 60,00% | 2 | 40,00% | Registered |
| Constituency no. 6 | 12 | 4 | 33,33% | 8 | 66,67% | Registered |
| Totalling | 46 | 18 | 39,13% | 28 | 60,87% | |
| Age of the candidates | |||||
| Specification | Average age | Average age of women | Average age of men | Oldest | Youngest |
| Constituency no. 2 | 43 | 43 | 41 | 60 | 22 |
| Constituency no. 3 | 37 | 31 | 43 | 72 | 21 |
| Constituency no. 4 | 50 | 68 | 47 | 80 | 24 |
| Constituency no. 5 | 31 | 34 | 28 | 41 | 21 |
| Constituency no. 6 | 47 | 40 | 51 | 65 | 21 |
| Specification |
| The statistics of election committe |
| Lists submitted | ||
| Specification | Number of | |
| lists | councils | |
| Lists submitted for province council | 5 | 1 |
| Lists submitted for county councils | 0 | 0 |
| Lists submitted for councils of cities holding county rights | 0 | 0 |
| Lists registered for communal councils | 0 | 0 |
| Totalling | 5 | 1 |
| Submitted candidates | |||||
| Specification | Number of candidates | Women | Women (%) | Men | Men (%) |
| Number of candidates submitted for the province council | 46 | 18 | 39,13% | 28 | 60,87% |
| Number of candidates submitted for county councils | 0 | 0 | - | 0 | - |
| Number of candidates submitted for councils of cities holding county rights | 0 | 0 | - | 0 | - |
| Number of candidates registered for communal councils | 0 | 0 | - | 0 | - |
| Number of candidates submitted for reeve, mayor and presidential elections | 0 | 0 | - | 0 | - |
| Totalling | 46 | 18 | 39,13% | 28 | 60,87% |
| Average age of submitted candidates | |||
| Specification | Average age | Average age of women | Average age of men |
| Average age of candidates submitted for the province council | 44 | 40 | 46 |
| Average age of candidates submitted for county councils | - | - | - |
| Average age of candidates for councils of cities holding county rights | - | - | - |
| Average age of candidates submitted for communal councils | - | - | - |
| Average age of candidates for reeve, mayor, president | - | - | - |
| Totalling | 44 | 40 | 46 |
| Submitted candidates for councils grouped by age | |||||
| Age | Number of candidates | Women | Women (%) | Men | Men (%) |
| 18-29 | 13 | 5 | 38,46% | 8 | 61,54% |
| 30-39 | 7 | 4 | 57,14% | 3 | 42,86% |
| 40-59 | 16 | 8 | 50,00% | 8 | 50,00% |
| 60+ | 10 | 1 | 10,00% | 9 | 90,00% |
| Totalling | 46 | 18 | 39,13% | 28 | 60,87% |
| Submitted candidates for reeve, mayor, president grouped by age | |||||
| Age | Number of candidates | Women | Women (%) | Men | Men (%) |
| 25-29 | 0 | 0 | - | 0 | - |
| 30-39 | 0 | 0 | - | 0 | - |
| 40-59 | 0 | 0 | - | 0 | - |
| 60+ | 0 | 0 | - | 0 | - |
| Totalling | 0 | 0 | - | 0 | - |
| The youngest and oldest submitted candidate for councils | ||
| Age | Institution | |
| Youngest | 21 | Sejmik Województwa Małopolskiego |
| Oldest | 80 | Sejmik Województwa Małopolskiego |
Province mazowieckie
| Sejmik Województwa Mazowieckiego |
| Submitted candidates | ||||||
| Specification | Number of candidates | Women | Women (%) | Men | Men (%) | Status |
| Constituency no. 5 | 7 | 1 | 14,29% | 6 | 85,71% | Registered |
| Constituency no. 7 | 7 | 4 | 57,14% | 3 | 42,86% | Registered |
| Totalling | 14 | 5 | 35,71% | 9 | 64,29% | |
| Age of the candidates | |||||
| Specification | Average age | Average age of women | Average age of men | Oldest | Youngest |
| Constituency no. 5 | 39 | 45 | 38 | 60 | 20 |
| Constituency no. 7 | 36 | 31 | 42 | 48 | 20 |
| Specification |
| m. Warszawa |
| pow. lipski |
| The statistics of election committe |
| Lists submitted | ||
| Specification | Number of | |
| lists | councils | |
| Lists submitted for province council | 2 | 1 |
| Lists submitted for county councils | 3 | 1 |
| Lists submitted for councils of cities holding county rights | 9 | 1 |
| Lists submitted for districts councils of the cap. city of Warsaw | 0 | 0 |
| Lists registered for communal councils | 14 | 4 |
| Totalling | 28 | 7 |
| Submitted candidates | |||||
| Specification | Number of candidates | Women | Women (%) | Men | Men (%) |
| Number of candidates submitted for the province council | 14 | 5 | 35,71% | 9 | 64,29% |
| Number of candidates submitted for county councils | 11 | 5 | 45,45% | 6 | 54,55% |
| Number of candidates submitted for councils of cities holding county rights | 49 | 18 | 36,73% | 31 | 63,27% |
| Number of candidates submitted for districts councils of the cap. city of Warsaw | 0 | 0 | - | 0 | - |
| Number of candidates registered for communal councils | 14 | 5 | 35,71% | 9 | 64,29% |
| Number of candidates submitted for reeve, mayor and presidential elections | 0 | 0 | - | 0 | - |
| Totalling | 88 | 33 | 37,50% | 55 | 62,50% |
| Average age of submitted candidates | |||
| Specification | Average age | Average age of women | Average age of men |
| Average age of candidates submitted for the province council | 37 | 34 | 39 |
| Average age of candidates submitted for county councils | 46 | 45 | 47 |
| Average age of candidates for councils of cities holding county rights | 49 | 50 | 48 |
| Average age of candidates for districts councils of the cap. city of Warsaw | - | - | - |
| Average age of candidates submitted for communal councils | 45 | 37 | 50 |
| Average age of candidates for reeve, mayor, president | - | - | - |
| Totalling | 46 | 44 | 46 |
| Submitted candidates for councils grouped by age | |||||
| Age | Number of candidates | Women | Women (%) | Men | Men (%) |
| 18-29 | 14 | 6 | 42,86% | 8 | 57,14% |
| 30-39 | 17 | 6 | 35,29% | 11 | 64,71% |
| 40-59 | 39 | 16 | 41,03% | 23 | 58,97% |
| 60+ | 18 | 5 | 27,78% | 13 | 72,22% |
| Totalling | 88 | 33 | 37,50% | 55 | 62,50% |
| Submitted candidates for reeve, mayor, president grouped by age | |||||
| Age | Number of candidates | Women | Women (%) | Men | Men (%) |
| 25-29 | 0 | 0 | - | 0 | - |
| 30-39 | 0 | 0 | - | 0 | - |
| 40-59 | 0 | 0 | - | 0 | - |
| 60+ | 0 | 0 | - | 0 | - |
| Totalling | 0 | 0 | - | 0 | - |
| The youngest and oldest submitted candidate for councils | ||
| Age | Institution | |
| Youngest | 20 | Sejmik Województwa Mazowieckiego |
| Oldest | 83 | Rada m.st. Warszawy |
| Sejmik Województwa Opolskiego |
| Submitted candidates | ||||||
| Specification | Number of candidates | Women | Women (%) | Men | Men (%) | Status |
| Constituency no. 2 | 6 | 0 | 0,00% | 6 | 100,00% | Registered |
| Totalling | 6 | 0 | 0,00% | 6 | 100,00% | |
| Age of the candidates | |||||
| Specification | Average age | Average age of women | Average age of men | Oldest | Youngest |
| Constituency no. 2 | 51 | - | 51 | 72 | 24 |
| Specification |
| The statistics of election committe |
| Lists submitted | ||
| Specification | Number of | |
| lists | councils | |
| Lists submitted for province council | 1 | 1 |
| Lists submitted for county councils | 0 | 0 |
| Lists submitted for councils of cities holding county rights | 0 | 0 |
| Lists registered for communal councils | 0 | 0 |
| Totalling | 1 | 1 |
| Submitted candidates | |||||
| Specification | Number of candidates | Women | Women (%) | Men | Men (%) |
| Number of candidates submitted for the province council | 6 | 0 | 0,00% | 6 | 100,00% |
| Number of candidates submitted for county councils | 0 | 0 | - | 0 | - |
| Number of candidates submitted for councils of cities holding county rights | 0 | 0 | - | 0 | - |
| Number of candidates registered for communal councils | 0 | 0 | - | 0 | - |
| Number of candidates submitted for reeve, mayor and presidential elections | 0 | 0 | - | 0 | - |
| Totalling | 6 | 0 | 0,00% | 6 | 100,00% |
| Average age of submitted candidates | |||
| Specification | Average age | Average age of women | Average age of men |
| Average age of candidates submitted for the province council | 51 | - | 51 |
| Average age of candidates submitted for county councils | - | - | - |
| Average age of candidates for councils of cities holding county rights | - | - | - |
| Average age of candidates submitted for communal councils | - | - | - |
| Average age of candidates for reeve, mayor, president | - | - | - |
| Totalling | 51 | - | 51 |
| Submitted candidates for councils grouped by age | |||||
| Age | Number of candidates | Women | Women (%) | Men | Men (%) |
| 18-29 | 1 | 0 | 0,00% | 1 | 100,00% |
| 30-39 | 1 | 0 | 0,00% | 1 | 100,00% |
| 40-59 | 1 | 0 | 0,00% | 1 | 100,00% |
| 60+ | 3 | 0 | 0,00% | 3 | 100,00% |
| Totalling | 6 | 0 | 0,00% | 6 | 100,00% |
| Submitted candidates for reeve, mayor, president grouped by age | |||||
| Age | Number of candidates | Women | Women (%) | Men | Men (%) |
| 25-29 | 0 | 0 | - | 0 | - |
| 30-39 | 0 | 0 | - | 0 | - |
| 40-59 | 0 | 0 | - | 0 | - |
| 60+ | 0 | 0 | - | 0 | - |
| Totalling | 0 | 0 | - | 0 | - |
| The youngest and oldest submitted candidate for councils | ||
| Age | Institution | |
| Youngest | 24 | Sejmik Województwa Opolskiego |
| Oldest | 72 | Sejmik Województwa Opolskiego |
Province śląskie
| Sejmik Województwa Śląskiego |
| Submitted candidates | ||||||
| Specification | Number of candidates | Women | Women (%) | Men | Men (%) | Status |
| Constituency no. 4 | 10 | 6 | 60,00% | 4 | 40,00% | Registered |
| Constituency no. 5 | 10 | 2 | 20,00% | 8 | 80,00% | Registered |
| Constituency no. 6 | 7 | 2 | 28,57% | 5 | 71,43% | Registered |
| Totalling | 27 | 10 | 37,04% | 17 | 62,96% | |
| Age of the candidates | |||||
| Specification | Average age | Average age of women | Average age of men | Oldest | Youngest |
| Constituency no. 4 | 47 | 47 | 47 | 68 | 29 |
| Constituency no. 5 | 30 | 28 | 31 | 38 | 19 |
| Constituency no. 6 | 37 | 29 | 41 | 55 | 26 |
| Specification |
| m. Rybnik |
| The statistics of election committe |
| Lists submitted | ||
| Specification | Number of | |
| lists | councils | |
| Lists submitted for province council | 3 | 1 |
| Lists submitted for county councils | 0 | 0 |
| Lists submitted for councils of cities holding county rights | 4 | 1 |
| Lists registered for communal councils | 0 | 0 |
| Totalling | 7 | 2 |
| Submitted candidates | |||||
| Specification | Number of candidates | Women | Women (%) | Men | Men (%) |
| Number of candidates submitted for the province council | 27 | 10 | 37,04% | 17 | 62,96% |
| Number of candidates submitted for county councils | 0 | 0 | - | 0 | - |
| Number of candidates submitted for councils of cities holding county rights | 27 | 13 | 48,15% | 14 | 51,85% |
| Number of candidates registered for communal councils | 0 | 0 | - | 0 | - |
| Number of candidates submitted for reeve, mayor and presidential elections | 1 | 0 | 0,00% | 1 | 100,00% |
| Totalling | 55 | 23 | 41,82% | 32 | 58,18% |
| Average age of submitted candidates | |||
| Specification | Average age | Average age of women | Average age of men |
| Average age of candidates submitted for the province council | 38 | 39 | 37 |
| Average age of candidates submitted for county councils | - | - | - |
| Average age of candidates for councils of cities holding county rights | 33 | 32 | 33 |
| Average age of candidates submitted for communal councils | - | - | - |
| Average age of candidates for reeve, mayor, president | 42 | - | 42 |
| Totalling | 35 | 35 | 35 |
| Submitted candidates for councils grouped by age | |||||
| Age | Number of candidates | Women | Women (%) | Men | Men (%) |
| 18-29 | 25 | 13 | 52,00% | 12 | 48,00% |
| 30-39 | 11 | 2 | 18,18% | 9 | 81,82% |
| 40-59 | 16 | 7 | 43,75% | 9 | 56,25% |
| 60+ | 2 | 1 | 50,00% | 1 | 50,00% |
| Totalling | 54 | 23 | 42,59% | 31 | 57,41% |
| Submitted candidates for reeve, mayor, president grouped by age | |||||
| Age | Number of candidates | Women | Women (%) | Men | Men (%) |
| 25-29 | 0 | 0 | - | 0 | - |
| 30-39 | 0 | 0 | - | 0 | - |
| 40-59 | 1 | 0 | 0,00% | 1 | 100,00% |
| 60+ | 0 | 0 | - | 0 | - |
| Totalling | 1 | 0 | 0,00% | 1 | 100,00% |
| The youngest and oldest submitted candidate for councils | ||
| Age | Institution | |
| Youngest | 18 | Rada Miasta Rybnika |
| Oldest | 68 | Sejmik Województwa Śląskiego |
| The youngest and oldest submitted candidate for reeve, mayor, president | ||
| Age | Institution | |
| Youngest | 42 | Prezydent Miasta Rybnika |
| Oldest | 42 | Prezydent Miasta Rybnika |
| Sejmik Województwa Warmińsko-Mazurskiego |
| Submitted candidates | ||||||
| Specification | Number of candidates | Women | Women (%) | Men | Men (%) | Status |
| Constituency no. 5 | 5 | 1 | 20,00% | 4 | 80,00% | Registered |
| Totalling | 5 | 1 | 20,00% | 4 | 80,00% | |
| Age of the candidates | |||||
| Specification | Average age | Average age of women | Average age of men | Oldest | Youngest |
| Constituency no. 5 | 33 | 36 | 32 | 54 | 20 |
| Specification |
| The statistics of election committe |
| Lists submitted | ||
| Specification | Number of | |
| lists | councils | |
| Lists submitted for province council | 1 | 1 |
| Lists submitted for county councils | 0 | 0 |
| Lists submitted for councils of cities holding county rights | 0 | 0 |
| Lists registered for communal councils | 0 | 0 |
| Totalling | 1 | 1 |
| Submitted candidates | |||||
| Specification | Number of candidates | Women | Women (%) | Men | Men (%) |
| Number of candidates submitted for the province council | 5 | 1 | 20,00% | 4 | 80,00% |
| Number of candidates submitted for county councils | 0 | 0 | - | 0 | - |
| Number of candidates submitted for councils of cities holding county rights | 0 | 0 | - | 0 | - |
| Number of candidates registered for communal councils | 0 | 0 | - | 0 | - |
| Number of candidates submitted for reeve, mayor and presidential elections | 0 | 0 | - | 0 | - |
| Totalling | 5 | 1 | 20,00% | 4 | 80,00% |
| Average age of submitted candidates | |||
| Specification | Average age | Average age of women | Average age of men |
| Average age of candidates submitted for the province council | 33 | 36 | 32 |
| Average age of candidates submitted for county councils | - | - | - |
| Average age of candidates for councils of cities holding county rights | - | - | - |
| Average age of candidates submitted for communal councils | - | - | - |
| Average age of candidates for reeve, mayor, president | - | - | - |
| Totalling | 33 | 36 | 32 |
| Submitted candidates for councils grouped by age | |||||
| Age | Number of candidates | Women | Women (%) | Men | Men (%) |
| 18-29 | 2 | 0 | 0,00% | 2 | 100,00% |
| 30-39 | 2 | 1 | 50,00% | 1 | 50,00% |
| 40-59 | 1 | 0 | 0,00% | 1 | 100,00% |
| 60+ | 0 | 0 | - | 0 | - |
| Totalling | 5 | 1 | 20,00% | 4 | 80,00% |
| Submitted candidates for reeve, mayor, president grouped by age | |||||
| Age | Number of candidates | Women | Women (%) | Men | Men (%) |
| 25-29 | 0 | 0 | - | 0 | - |
| 30-39 | 0 | 0 | - | 0 | - |
| 40-59 | 0 | 0 | - | 0 | - |
| 60+ | 0 | 0 | - | 0 | - |
| Totalling | 0 | 0 | - | 0 | - |
| The youngest and oldest submitted candidate for councils | ||
| Age | Institution | |
| Youngest | 20 | Sejmik Województwa Warmińsko-Mazurskiego |
| Oldest | 54 | Sejmik Województwa Warmińsko-Mazurskiego |
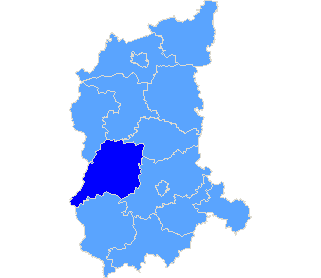
Province wielkopolskie
| Specification |
| pow. słupecki |
| The statistics of election committe |
| Lists submitted | ||
| Specification | Number of | |
| lists | councils | |
| Lists submitted for province council | 0 | 0 |
| Lists submitted for county councils | 5 | 1 |
| Lists submitted for councils of cities holding county rights | 0 | 0 |
| Lists registered for communal councils | 9 | 1 |
| Totalling | 14 | 2 |
| Submitted candidates | |||||
| Specification | Number of candidates | Women | Women (%) | Men | Men (%) |
| Number of candidates submitted for the province council | 0 | 0 | - | 0 | - |
| Number of candidates submitted for county councils | 27 | 6 | 22,22% | 21 | 77,78% |
| Number of candidates submitted for councils of cities holding county rights | 0 | 0 | - | 0 | - |
| Number of candidates registered for communal councils | 9 | 5 | 55,56% | 4 | 44,44% |
| Number of candidates submitted for reeve, mayor and presidential elections | 1 | 0 | 0,00% | 1 | 100,00% |
| Totalling | 37 | 11 | 29,73% | 26 | 70,27% |
| Average age of submitted candidates | |||
| Specification | Average age | Average age of women | Average age of men |
| Average age of candidates submitted for the province council | - | - | - |
| Average age of candidates submitted for county councils | 45 | 43 | 46 |
| Average age of candidates for councils of cities holding county rights | - | - | - |
| Average age of candidates submitted for communal councils | 37 | 37 | 36 |
| Average age of candidates for reeve, mayor, president | 55 | - | 55 |
| Totalling | 43 | 40 | 44 |
| Submitted candidates for councils grouped by age | |||||
| Age | Number of candidates | Women | Women (%) | Men | Men (%) |
| 18-29 | 7 | 2 | 28,57% | 5 | 71,43% |
| 30-39 | 7 | 4 | 57,14% | 3 | 42,86% |
| 40-59 | 18 | 4 | 22,22% | 14 | 77,78% |
| 60+ | 4 | 1 | 25,00% | 3 | 75,00% |
| Totalling | 36 | 11 | 30,56% | 25 | 69,44% |
| Submitted candidates for reeve, mayor, president grouped by age | |||||
| Age | Number of candidates | Women | Women (%) | Men | Men (%) |
| 25-29 | 0 | 0 | - | 0 | - |
| 30-39 | 0 | 0 | - | 0 | - |
| 40-59 | 1 | 0 | 0,00% | 1 | 100,00% |
| 60+ | 0 | 0 | - | 0 | - |
| Totalling | 1 | 0 | 0,00% | 1 | 100,00% |
| The youngest and oldest submitted candidate for councils | ||
| Age | Institution | |
| Youngest | 22 | Rada Powiatu Słupeckiego |
| Oldest | 63 | Rada Powiatu Słupeckiego |
| The youngest and oldest submitted candidate for reeve, mayor, president | ||
| Age | Institution | |
| Youngest | 55 | Burmistrz Miasta Słupcy |
| Oldest | 55 | Burmistrz Miasta Słupcy |
| Sejmik Województwa Zachodniopomorskiego |
| Submitted candidates | ||||||
| Specification | Number of candidates | Women | Women (%) | Men | Men (%) | Status |
| Constituency no. 1 | 8 | 5 | 62,50% | 3 | 37,50% | Registered |
| Constituency no. 2 | 5 | 3 | 60,00% | 2 | 40,00% | Registered |
| Constituency no. 3 | 6 | 4 | 66,67% | 2 | 33,33% | Registered |
| Constituency no. 4 | 5 | 3 | 60,00% | 2 | 40,00% | Registered |
| Constituency no. 5 | 10 | 6 | 60,00% | 4 | 40,00% | Registered |
| Totalling | 34 | 21 | 61,76% | 13 | 38,24% | |
| Age of the candidates | |||||
| Specification | Average age | Average age of women | Average age of men | Oldest | Youngest |
| Constituency no. 1 | 36 | 37 | 34 | 58 | 19 |
| Constituency no. 2 | 49 | 45 | 56 | 60 | 23 |
| Constituency no. 3 | 51 | 55 | 45 | 70 | 32 |
| Constituency no. 4 | 44 | 47 | 39 | 62 | 32 |
| Constituency no. 5 | 35 | 32 | 39 | 53 | 24 |
| Specification |
| The statistics of election committe |
| Lists submitted | ||
| Specification | Number of | |
| lists | councils | |
| Lists submitted for province council | 5 | 1 |
| Lists submitted for county councils | 0 | 0 |
| Lists submitted for councils of cities holding county rights | 0 | 0 |
| Lists registered for communal councils | 0 | 0 |
| Totalling | 5 | 1 |
| Submitted candidates | |||||
| Specification | Number of candidates | Women | Women (%) | Men | Men (%) |
| Number of candidates submitted for the province council | 34 | 21 | 61,76% | 13 | 38,24% |
| Number of candidates submitted for county councils | 0 | 0 | - | 0 | - |
| Number of candidates submitted for councils of cities holding county rights | 0 | 0 | - | 0 | - |
| Number of candidates registered for communal councils | 0 | 0 | - | 0 | - |
| Number of candidates submitted for reeve, mayor and presidential elections | 0 | 0 | - | 0 | - |
| Totalling | 34 | 21 | 61,76% | 13 | 38,24% |
| Average age of submitted candidates | |||
| Specification | Average age | Average age of women | Average age of men |
| Average age of candidates submitted for the province council | 41 | 41 | 41 |
| Average age of candidates submitted for county councils | - | - | - |
| Average age of candidates for councils of cities holding county rights | - | - | - |
| Average age of candidates submitted for communal councils | - | - | - |
| Average age of candidates for reeve, mayor, president | - | - | - |
| Totalling | 41 | 41 | 41 |
| Submitted candidates for councils grouped by age | |||||
| Age | Number of candidates | Women | Women (%) | Men | Men (%) |
| 18-29 | 8 | 5 | 62,50% | 3 | 37,50% |
| 30-39 | 10 | 7 | 70,00% | 3 | 30,00% |
| 40-59 | 13 | 6 | 46,15% | 7 | 53,85% |
| 60+ | 3 | 3 | 100,00% | 0 | 0,00% |
| Totalling | 34 | 21 | 61,76% | 13 | 38,24% |
| Submitted candidates for reeve, mayor, president grouped by age | |||||
| Age | Number of candidates | Women | Women (%) | Men | Men (%) |
| 25-29 | 0 | 0 | - | 0 | - |
| 30-39 | 0 | 0 | - | 0 | - |
| 40-59 | 0 | 0 | - | 0 | - |
| 60+ | 0 | 0 | - | 0 | - |
| Totalling | 0 | 0 | - | 0 | - |
| The youngest and oldest submitted candidate for councils | ||
| Age | Institution | |
| Youngest | 19 | Sejmik Województwa Zachodniopomorskiego |
| Oldest | 70 | Sejmik Województwa Zachodniopomorskiego |
