

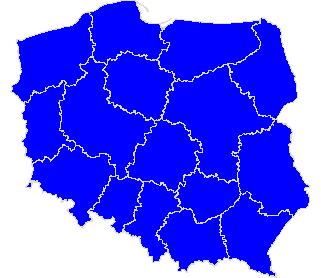
Rzeczpospolita Polska
| The statistics of election committe |
| Lists submitted | ||
| Specification | Number of | |
| lists | councils | |
| Lists submitted for provinces councils | 85 | 16 |
| Lists submitted for county councils | 3 | 2 |
| Lists submitted for councils of cities holding county rights | 4 | 1 |
| Lists submitted for districts councils of the cap. city of Warsaw | 0 | 0 |
| Lists registered for communal councils | 50 | 16 |
| Totalling | 142 | 35 |
| Submitted candidates | |||||
| Specification | Number of candidates | Women | Women (%) | Men | Men (%) |
| Number of candidates submitted for the province council | 630 | 253 | 40,16% | 377 | 59,84% |
| Number of candidates submitted for county councils | 23 | 14 | 60,87% | 9 | 39,13% |
| Number of candidates submitted for councils of cities holding county rights | 27 | 20 | 74,07% | 7 | 25,93% |
| Number of candidates submitted for districts councils of the cap. city of Warsaw | 0 | 0 | - | 0 | - |
| Number of candidates registered for communal councils | 104 | 45 | 43,27% | 59 | 56,73% |
| Number of candidates submitted for reeve, mayor and presidential elections | 5 | 0 | 0,00% | 5 | 100,00% |
| Totalling | 789 | 332 | 42,08% | 457 | 57,92% |
| Average age of submitted candidates | |||
| Specification | Average age | Average age of women | Average age of men |
| Average age of candidates submitted for the province council | 36 | 35 | 37 |
| Average age of candidates submitted for county councils | 36 | 30 | 46 |
| Average age of candidates for councils of cities holding county rights | 38 | 37 | 43 |
| Average age of candidates submitted for communal councils | 39 | 37 | 40 |
| Average age of candidates for reeve, mayor, president | 51 | - | 51 |
| Totalling | 36 | 35 | 37 |
| Submitted candidates for councils grouped by age | |||||
| Age | Number of candidates | Women | Women (%) | Men | Men (%) |
| 18-29 | 285 | 129 | 45,26% | 156 | 54,74% |
| 30-39 | 189 | 87 | 46,03% | 102 | 53,97% |
| 40-59 | 262 | 101 | 38,55% | 161 | 61,45% |
| 60+ | 48 | 15 | 31,25% | 33 | 68,75% |
| Totalling | 784 | 332 | 42,35% | 452 | 57,65% |
| Submitted candidates for reeve, mayor, president grouped by age | |||||
| Age | Number of candidates | Women | Women (%) | Men | Men (%) |
| 25-29 | 0 | 0 | - | 0 | - |
| 30-39 | 2 | 0 | 0,00% | 2 | 100,00% |
| 40-59 | 2 | 0 | 0,00% | 2 | 100,00% |
| 60+ | 1 | 0 | 0,00% | 1 | 100,00% |
| Totalling | 5 | 0 | 0,00% | 5 | 100,00% |
| The youngest and oldest submitted candidate for councils | ||
| Age | Institution | |
| Youngest | 18 | Sejmik Województwa Kujawsko-Pomorskiego |
| Oldest | 84 | Sejmik Województwa Zachodniopomorskiego |
| The youngest and oldest submitted candidate for reeve, mayor, president | ||
| Age | Institution | |
| Youngest | 37 | Burmistrz Korsz |
| Oldest | 71 | Prezydent Miasta Grudziądza |
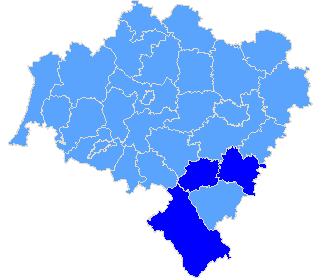
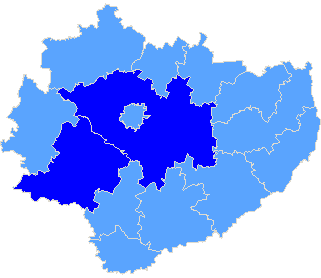
Province dolnośląskie
| Sejmik Województwa Dolnośląskiego |
| Submitted candidates | ||||||
| Specification | Number of candidates | Women | Women (%) | Men | Men (%) | Status |
| Constituency no. 1 | 6 | 3 | 50,00% | 3 | 50,00% | Registered |
| Constituency no. 2 | 6 | 2 | 33,33% | 4 | 66,67% | Registered |
| Constituency no. 3 | 7 | 3 | 42,86% | 4 | 57,14% | Registered |
| Constituency no. 4 | 7 | 4 | 57,14% | 3 | 42,86% | Registered |
| Constituency no. 5 | 6 | 3 | 50,00% | 3 | 50,00% | Registered |
| Totalling | 32 | 15 | 46,88% | 17 | 53,12% | |
| Age of the candidates | |||||
| Specification | Average age | Average age of women | Average age of men | Oldest | Youngest |
| Constituency no. 1 | 45 | 47 | 43 | 61 | 26 |
| Constituency no. 2 | 48 | 53 | 45 | 54 | 38 |
| Constituency no. 3 | 32 | 31 | 33 | 41 | 24 |
| Constituency no. 4 | 35 | 37 | 33 | 42 | 24 |
| Constituency no. 5 | 30 | 32 | 28 | 44 | 23 |
| Specification |
| pow. dzierżoniowski |
| pow. kłodzki |
| pow. strzeliński |
| The statistics of election committe |
| Lists submitted | ||
| Specification | Number of | |
| lists | councils | |
| Lists submitted for province council | 5 | 1 |
| Lists submitted for county councils | 0 | 0 |
| Lists submitted for councils of cities holding county rights | 0 | 0 |
| Lists registered for communal councils | 8 | 6 |
| Totalling | 13 | 7 |
| Submitted candidates | |||||
| Specification | Number of candidates | Women | Women (%) | Men | Men (%) |
| Number of candidates submitted for the province council | 32 | 15 | 46,88% | 17 | 53,13% |
| Number of candidates submitted for county councils | 0 | 0 | - | 0 | - |
| Number of candidates submitted for councils of cities holding county rights | 0 | 0 | - | 0 | - |
| Number of candidates registered for communal councils | 48 | 24 | 50,00% | 24 | 50,00% |
| Number of candidates submitted for reeve, mayor and presidential elections | 0 | 0 | - | 0 | - |
| Totalling | 80 | 39 | 48,75% | 41 | 51,25% |
| Average age of submitted candidates | |||
| Specification | Average age | Average age of women | Average age of men |
| Average age of candidates submitted for the province council | 38 | 39 | 37 |
| Average age of candidates submitted for county councils | - | - | - |
| Average age of candidates for councils of cities holding county rights | - | - | - |
| Average age of candidates submitted for communal councils | 39 | 37 | 40 |
| Average age of candidates for reeve, mayor, president | - | - | - |
| Totalling | 38 | 37 | 38 |
| Submitted candidates for councils grouped by age | |||||
| Age | Number of candidates | Women | Women (%) | Men | Men (%) |
| 18-29 | 19 | 10 | 52,63% | 9 | 47,37% |
| 30-39 | 28 | 13 | 46,43% | 15 | 53,57% |
| 40-59 | 26 | 13 | 50,00% | 13 | 50,00% |
| 60+ | 7 | 3 | 42,86% | 4 | 57,14% |
| Totalling | 80 | 39 | 48,75% | 41 | 51,25% |
| Submitted candidates for reeve, mayor, president grouped by age | |||||
| Age | Number of candidates | Women | Women (%) | Men | Men (%) |
| 25-29 | 0 | 0 | - | 0 | - |
| 30-39 | 0 | 0 | - | 0 | - |
| 40-59 | 0 | 0 | - | 0 | - |
| 60+ | 0 | 0 | - | 0 | - |
| Totalling | 0 | 0 | - | 0 | - |
| The youngest and oldest submitted candidate for councils | ||
| Age | Institution | |
| Youngest | 21 | Rada Miejska Strzelina |
| Oldest | 70 | Rada Miejska Strzelina |
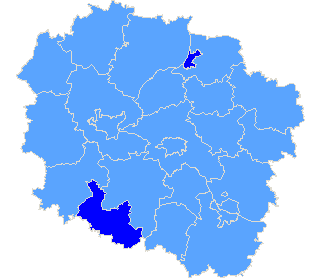
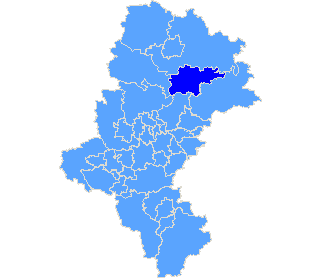
Province kujawsko-pomorskie
| Sejmik Województwa Kujawsko-Pomorskiego |
| Submitted candidates | ||||||
| Specification | Number of candidates | Women | Women (%) | Men | Men (%) | Status |
| Constituency no. 1 | 9 | 3 | 33,33% | 6 | 66,67% | Registered |
| Constituency no. 2 | 10 | 5 | 50,00% | 5 | 50,00% | Registered |
| Constituency no. 3 | 7 | 2 | 28,57% | 5 | 71,43% | Registered |
| Constituency no. 4 | 7 | 2 | 28,57% | 5 | 71,43% | Registered |
| Constituency no. 5 | 8 | 2 | 25,00% | 6 | 75,00% | Registered |
| Constituency no. 6 | 8 | 5 | 62,50% | 3 | 37,50% | Registered |
| Totalling | 49 | 19 | 38,78% | 30 | 61,22% | |
| Age of the candidates | |||||
| Specification | Average age | Average age of women | Average age of men | Oldest | Youngest |
| Constituency no. 1 | 37 | 35 | 38 | 66 | 19 |
| Constituency no. 2 | 35 | 25 | 45 | 61 | 18 |
| Constituency no. 3 | 38 | 38 | 38 | 58 | 18 |
| Constituency no. 4 | 36 | 43 | 34 | 61 | 18 |
| Constituency no. 5 | 38 | 25 | 43 | 67 | 23 |
| Constituency no. 6 | 26 | 29 | 21 | 36 | 19 |
| Specification |
| m. Grudziądz |
| pow. mogileński |
| The statistics of election committe |
| Lists submitted | ||
| Specification | Number of | |
| lists | councils | |
| Lists submitted for province council | 6 | 1 |
| Lists submitted for county councils | 2 | 1 |
| Lists submitted for councils of cities holding county rights | 4 | 1 |
| Lists registered for communal councils | 7 | 2 |
| Totalling | 19 | 5 |
| Submitted candidates | |||||
| Specification | Number of candidates | Women | Women (%) | Men | Men (%) |
| Number of candidates submitted for the province council | 49 | 19 | 38,78% | 30 | 61,22% |
| Number of candidates submitted for county councils | 18 | 14 | 77,78% | 4 | 22,22% |
| Number of candidates submitted for councils of cities holding county rights | 27 | 20 | 74,07% | 7 | 25,93% |
| Number of candidates registered for communal councils | 16 | 7 | 43,75% | 9 | 56,25% |
| Number of candidates submitted for reeve, mayor and presidential elections | 2 | 0 | 0,00% | 2 | 100,00% |
| Totalling | 112 | 60 | 53,57% | 52 | 46,43% |
| Average age of submitted candidates | |||
| Specification | Average age | Average age of women | Average age of men |
| Average age of candidates submitted for the province council | 35 | 31 | 38 |
| Average age of candidates submitted for county councils | 30 | 30 | 29 |
| Average age of candidates for councils of cities holding county rights | 38 | 37 | 43 |
| Average age of candidates submitted for communal councils | 48 | 45 | 51 |
| Average age of candidates for reeve, mayor, president | 65 | - | 65 |
| Totalling | 37 | 34 | 41 |
| Submitted candidates for councils grouped by age | |||||
| Age | Number of candidates | Women | Women (%) | Men | Men (%) |
| 18-29 | 48 | 27 | 56,25% | 21 | 43,75% |
| 30-39 | 21 | 17 | 80,95% | 4 | 19,05% |
| 40-59 | 30 | 15 | 50,00% | 15 | 50,00% |
| 60+ | 11 | 1 | 9,09% | 10 | 90,91% |
| Totalling | 110 | 60 | 54,55% | 50 | 45,45% |
| Submitted candidates for reeve, mayor, president grouped by age | |||||
| Age | Number of candidates | Women | Women (%) | Men | Men (%) |
| 25-29 | 0 | 0 | - | 0 | - |
| 30-39 | 0 | 0 | - | 0 | - |
| 40-59 | 1 | 0 | 0,00% | 1 | 100,00% |
| 60+ | 1 | 0 | 0,00% | 1 | 100,00% |
| Totalling | 2 | 0 | 0,00% | 2 | 100,00% |
| The youngest and oldest submitted candidate for councils | ||
| Age | Institution | |
| Youngest | 18 | Sejmik Województwa Kujawsko-Pomorskiego |
| Oldest | 71 | Rada Miejska Grudziądza |
| The youngest and oldest submitted candidate for reeve, mayor, president | ||
| Age | Institution | |
| Youngest | 59 | Wójt Gminy Jeziora Wielkie |
| Oldest | 71 | Prezydent Miasta Grudziądza |
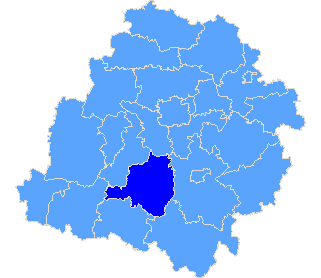
| Sejmik Województwa Lubelskiego |
| Submitted candidates | ||||||
| Specification | Number of candidates | Women | Women (%) | Men | Men (%) | Status |
| Constituency no. 1 | 9 | 0 | 0,00% | 9 | 100,00% | Registered |
| Constituency no. 2 | 11 | 4 | 36,36% | 7 | 63,64% | Registered |
| Constituency no. 3 | 8 | 3 | 37,50% | 5 | 62,50% | Registered |
| Constituency no. 4 | 7 | 1 | 14,29% | 6 | 85,71% | Registered |
| Constituency no. 5 | 8 | 3 | 37,50% | 5 | 62,50% | Registered |
| Totalling | 43 | 11 | 25,58% | 32 | 74,42% | |
| Age of the candidates | |||||
| Specification | Average age | Average age of women | Average age of men | Oldest | Youngest |
| Constituency no. 1 | 38 | - | 38 | 59 | 26 |
| Constituency no. 2 | 37 | 41 | 35 | 57 | 21 |
| Constituency no. 3 | 40 | 43 | 39 | 61 | 27 |
| Constituency no. 4 | 48 | 34 | 50 | 57 | 34 |
| Constituency no. 5 | 35 | 48 | 28 | 67 | 18 |
| Specification |
| The statistics of election committe |
| Lists submitted | ||
| Specification | Number of | |
| lists | councils | |
| Lists submitted for province council | 5 | 1 |
| Lists submitted for county councils | 0 | 0 |
| Lists submitted for councils of cities holding county rights | 0 | 0 |
| Lists registered for communal councils | 0 | 0 |
| Totalling | 5 | 1 |
| Submitted candidates | |||||
| Specification | Number of candidates | Women | Women (%) | Men | Men (%) |
| Number of candidates submitted for the province council | 43 | 11 | 25,58% | 32 | 74,42% |
| Number of candidates submitted for county councils | 0 | 0 | - | 0 | - |
| Number of candidates submitted for councils of cities holding county rights | 0 | 0 | - | 0 | - |
| Number of candidates registered for communal councils | 0 | 0 | - | 0 | - |
| Number of candidates submitted for reeve, mayor and presidential elections | 0 | 0 | - | 0 | - |
| Totalling | 43 | 11 | 25,58% | 32 | 74,42% |
| Average age of submitted candidates | |||
| Specification | Average age | Average age of women | Average age of men |
| Average age of candidates submitted for the province council | 39 | 43 | 38 |
| Average age of candidates submitted for county councils | - | - | - |
| Average age of candidates for councils of cities holding county rights | - | - | - |
| Average age of candidates submitted for communal councils | - | - | - |
| Average age of candidates for reeve, mayor, president | - | - | - |
| Totalling | 39 | 43 | 38 |
| Submitted candidates for councils grouped by age | |||||
| Age | Number of candidates | Women | Women (%) | Men | Men (%) |
| 18-29 | 12 | 1 | 8,33% | 11 | 91,67% |
| 30-39 | 8 | 3 | 37,50% | 5 | 62,50% |
| 40-59 | 21 | 6 | 28,57% | 15 | 71,43% |
| 60+ | 2 | 1 | 50,00% | 1 | 50,00% |
| Totalling | 43 | 11 | 25,58% | 32 | 74,42% |
| Submitted candidates for reeve, mayor, president grouped by age | |||||
| Age | Number of candidates | Women | Women (%) | Men | Men (%) |
| 25-29 | 0 | 0 | - | 0 | - |
| 30-39 | 0 | 0 | - | 0 | - |
| 40-59 | 0 | 0 | - | 0 | - |
| 60+ | 0 | 0 | - | 0 | - |
| Totalling | 0 | 0 | - | 0 | - |
| The youngest and oldest submitted candidate for councils | ||
| Age | Institution | |
| Youngest | 18 | Sejmik Województwa Lubelskiego |
| Oldest | 67 | Sejmik Województwa Lubelskiego |
| Sejmik Województwa Lubuskiego |
| Submitted candidates | ||||||
| Specification | Number of candidates | Women | Women (%) | Men | Men (%) | Status |
| Constituency no. 1 | 7 | 5 | 71,43% | 2 | 28,57% | Registered |
| Constituency no. 2 | 6 | 1 | 16,67% | 5 | 83,33% | Registered |
| Constituency no. 3 | 7 | 3 | 42,86% | 4 | 57,14% | Registered |
| Constituency no. 4 | 7 | 1 | 14,29% | 6 | 85,71% | Registered |
| Constituency no. 5 | 7 | 2 | 28,57% | 5 | 71,43% | Registered |
| Totalling | 34 | 12 | 35,29% | 22 | 64,71% | |
| Age of the candidates | |||||
| Specification | Average age | Average age of women | Average age of men | Oldest | Youngest |
| Constituency no. 1 | 41 | 42 | 39 | 64 | 26 |
| Constituency no. 2 | 42 | 22 | 46 | 60 | 22 |
| Constituency no. 3 | 46 | 39 | 51 | 72 | 20 |
| Constituency no. 4 | 33 | 25 | 35 | 47 | 25 |
| Constituency no. 5 | 34 | 27 | 37 | 48 | 25 |
| Specification |
| The statistics of election committe |
| Lists submitted | ||
| Specification | Number of | |
| lists | councils | |
| Lists submitted for province council | 5 | 1 |
| Lists submitted for county councils | 0 | 0 |
| Lists submitted for councils of cities holding county rights | 0 | 0 |
| Lists registered for communal councils | 0 | 0 |
| Totalling | 5 | 1 |
| Submitted candidates | |||||
| Specification | Number of candidates | Women | Women (%) | Men | Men (%) |
| Number of candidates submitted for the province council | 34 | 12 | 35,29% | 22 | 64,71% |
| Number of candidates submitted for county councils | 0 | 0 | - | 0 | - |
| Number of candidates submitted for councils of cities holding county rights | 0 | 0 | - | 0 | - |
| Number of candidates registered for communal councils | 0 | 0 | - | 0 | - |
| Number of candidates submitted for reeve, mayor and presidential elections | 0 | 0 | - | 0 | - |
| Totalling | 34 | 12 | 35,29% | 22 | 64,71% |
| Average age of submitted candidates | |||
| Specification | Average age | Average age of women | Average age of men |
| Average age of candidates submitted for the province council | 39 | 36 | 41 |
| Average age of candidates submitted for county councils | - | - | - |
| Average age of candidates for councils of cities holding county rights | - | - | - |
| Average age of candidates submitted for communal councils | - | - | - |
| Average age of candidates for reeve, mayor, president | - | - | - |
| Totalling | 39 | 36 | 41 |
| Submitted candidates for councils grouped by age | |||||
| Age | Number of candidates | Women | Women (%) | Men | Men (%) |
| 18-29 | 11 | 6 | 54,55% | 5 | 45,45% |
| 30-39 | 9 | 3 | 33,33% | 6 | 66,67% |
| 40-59 | 9 | 1 | 11,11% | 8 | 88,89% |
| 60+ | 5 | 2 | 40,00% | 3 | 60,00% |
| Totalling | 34 | 12 | 35,29% | 22 | 64,71% |
| Submitted candidates for reeve, mayor, president grouped by age | |||||
| Age | Number of candidates | Women | Women (%) | Men | Men (%) |
| 25-29 | 0 | 0 | - | 0 | - |
| 30-39 | 0 | 0 | - | 0 | - |
| 40-59 | 0 | 0 | - | 0 | - |
| 60+ | 0 | 0 | - | 0 | - |
| Totalling | 0 | 0 | - | 0 | - |
| The youngest and oldest submitted candidate for councils | ||
| Age | Institution | |
| Youngest | 20 | Sejmik Województwa Lubuskiego |
| Oldest | 72 | Sejmik Województwa Lubuskiego |
Province łódzkie
| Sejmik Województwa Łódzkiego |
| Submitted candidates | ||||||
| Specification | Number of candidates | Women | Women (%) | Men | Men (%) | Status |
| Constituency no. 2 | 5 | 1 | 20,00% | 4 | 80,00% | Registered |
| Constituency no. 3 | 5 | 1 | 20,00% | 4 | 80,00% | Registered |
| Constituency no. 4 | 5 | 4 | 80,00% | 1 | 20,00% | Registered |
| Constituency no. 5 | 5 | 1 | 20,00% | 4 | 80,00% | Registered |
| Constituency no. 6 | 5 | 2 | 40,00% | 3 | 60,00% | Registered |
| Totalling | 25 | 9 | 36,00% | 16 | 64,00% | |
| Age of the candidates | |||||
| Specification | Average age | Average age of women | Average age of men | Oldest | Youngest |
| Constituency no. 2 | 35 | 29 | 36 | 57 | 27 |
| Constituency no. 3 | 49 | 47 | 50 | 64 | 31 |
| Constituency no. 4 | 38 | 37 | 43 | 56 | 26 |
| Constituency no. 5 | 50 | 46 | 52 | 68 | 44 |
| Constituency no. 6 | 30 | 32 | 29 | 43 | 19 |
| Specification |
| pow. bełchatowski |
| The statistics of election committe |
| Lists submitted | ||
| Specification | Number of | |
| lists | councils | |
| Lists submitted for province council | 5 | 1 |
| Lists submitted for county councils | 0 | 0 |
| Lists submitted for councils of cities holding county rights | 0 | 0 |
| Lists registered for communal councils | 1 | 1 |
| Totalling | 6 | 2 |
| Submitted candidates | |||||
| Specification | Number of candidates | Women | Women (%) | Men | Men (%) |
| Number of candidates submitted for the province council | 25 | 9 | 36,00% | 16 | 64,00% |
| Number of candidates submitted for county councils | 0 | 0 | - | 0 | - |
| Number of candidates submitted for councils of cities holding county rights | 0 | 0 | - | 0 | - |
| Number of candidates registered for communal councils | 1 | 1 | 100,00% | 0 | 0,00% |
| Number of candidates submitted for reeve, mayor and presidential elections | 0 | 0 | - | 0 | - |
| Totalling | 26 | 10 | 38,46% | 16 | 61,54% |
| Average age of submitted candidates | |||
| Specification | Average age | Average age of women | Average age of men |
| Average age of candidates submitted for the province council | 41 | 37 | 43 |
| Average age of candidates submitted for county councils | - | - | - |
| Average age of candidates for councils of cities holding county rights | - | - | - |
| Average age of candidates submitted for communal councils | 33 | 33 | - |
| Average age of candidates for reeve, mayor, president | - | - | - |
| Totalling | 40 | 36 | 43 |
| Submitted candidates for councils grouped by age | |||||
| Age | Number of candidates | Women | Women (%) | Men | Men (%) |
| 18-29 | 8 | 4 | 50,00% | 4 | 50,00% |
| 30-39 | 5 | 3 | 60,00% | 2 | 40,00% |
| 40-59 | 10 | 3 | 30,00% | 7 | 70,00% |
| 60+ | 3 | 0 | 0,00% | 3 | 100,00% |
| Totalling | 26 | 10 | 38,46% | 16 | 61,54% |
| Submitted candidates for reeve, mayor, president grouped by age | |||||
| Age | Number of candidates | Women | Women (%) | Men | Men (%) |
| 25-29 | 0 | 0 | - | 0 | - |
| 30-39 | 0 | 0 | - | 0 | - |
| 40-59 | 0 | 0 | - | 0 | - |
| 60+ | 0 | 0 | - | 0 | - |
| Totalling | 0 | 0 | - | 0 | - |
| The youngest and oldest submitted candidate for councils | ||
| Age | Institution | |
| Youngest | 19 | Sejmik Województwa Łódzkiego |
| Oldest | 68 | Sejmik Województwa Łódzkiego |
| Sejmik Województwa Małopolskiego |
| Submitted candidates | ||||||
| Specification | Number of candidates | Women | Women (%) | Men | Men (%) | Status |
| Constituency no. 1 | 8 | 2 | 25,00% | 6 | 75,00% | Registered |
| Constituency no. 2 | 7 | 1 | 14,29% | 6 | 85,71% | Registered |
| Constituency no. 3 | 9 | 1 | 11,11% | 8 | 88,89% | Registered |
| Constituency no. 4 | 8 | 3 | 37,50% | 5 | 62,50% | Registered |
| Constituency no. 5 | 8 | 4 | 50,00% | 4 | 50,00% | Registered |
| Constituency no. 6 | 6 | 2 | 33,33% | 4 | 66,67% | Registered |
| Totalling | 46 | 13 | 28,26% | 33 | 71,74% | |
| Age of the candidates | |||||
| Specification | Average age | Average age of women | Average age of men | Oldest | Youngest |
| Constituency no. 1 | 32 | 35 | 32 | 38 | 22 |
| Constituency no. 2 | 36 | 55 | 33 | 55 | 27 |
| Constituency no. 3 | 29 | 20 | 30 | 53 | 20 |
| Constituency no. 4 | 37 | 47 | 31 | 72 | 20 |
| Constituency no. 5 | 24 | 27 | 21 | 38 | 18 |
| Constituency no. 6 | 42 | 45 | 41 | 56 | 20 |
| Specification |
| The statistics of election committe |
| Lists submitted | ||
| Specification | Number of | |
| lists | councils | |
| Lists submitted for province council | 6 | 1 |
| Lists submitted for county councils | 0 | 0 |
| Lists submitted for councils of cities holding county rights | 0 | 0 |
| Lists registered for communal councils | 0 | 0 |
| Totalling | 6 | 1 |
| Submitted candidates | |||||
| Specification | Number of candidates | Women | Women (%) | Men | Men (%) |
| Number of candidates submitted for the province council | 46 | 13 | 28,26% | 33 | 71,74% |
| Number of candidates submitted for county councils | 0 | 0 | - | 0 | - |
| Number of candidates submitted for councils of cities holding county rights | 0 | 0 | - | 0 | - |
| Number of candidates registered for communal councils | 0 | 0 | - | 0 | - |
| Number of candidates submitted for reeve, mayor and presidential elections | 0 | 0 | - | 0 | - |
| Totalling | 46 | 13 | 28,26% | 33 | 71,74% |
| Average age of submitted candidates | |||
| Specification | Average age | Average age of women | Average age of men |
| Average age of candidates submitted for the province council | 33 | 37 | 31 |
| Average age of candidates submitted for county councils | - | - | - |
| Average age of candidates for councils of cities holding county rights | - | - | - |
| Average age of candidates submitted for communal councils | - | - | - |
| Average age of candidates for reeve, mayor, president | - | - | - |
| Totalling | 33 | 37 | 31 |
| Submitted candidates for councils grouped by age | |||||
| Age | Number of candidates | Women | Women (%) | Men | Men (%) |
| 18-29 | 21 | 5 | 23,81% | 16 | 76,19% |
| 30-39 | 14 | 3 | 21,43% | 11 | 78,57% |
| 40-59 | 10 | 4 | 40,00% | 6 | 60,00% |
| 60+ | 1 | 1 | 100,00% | 0 | 0,00% |
| Totalling | 46 | 13 | 28,26% | 33 | 71,74% |
| Submitted candidates for reeve, mayor, president grouped by age | |||||
| Age | Number of candidates | Women | Women (%) | Men | Men (%) |
| 25-29 | 0 | 0 | - | 0 | - |
| 30-39 | 0 | 0 | - | 0 | - |
| 40-59 | 0 | 0 | - | 0 | - |
| 60+ | 0 | 0 | - | 0 | - |
| Totalling | 0 | 0 | - | 0 | - |
| The youngest and oldest submitted candidate for councils | ||
| Age | Institution | |
| Youngest | 18 | Sejmik Województwa Małopolskiego |
| Oldest | 72 | Sejmik Województwa Małopolskiego |
Province mazowieckie
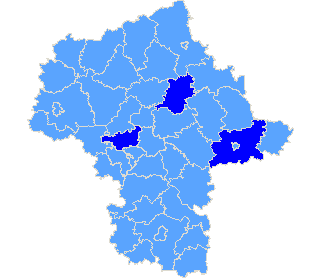
| Sejmik Województwa Mazowieckiego |
| Submitted candidates | ||||||
| Specification | Number of candidates | Women | Women (%) | Men | Men (%) | Status |
| Constituency no. 1 | 7 | 2 | 28,57% | 5 | 71,43% | Registered |
| Constituency no. 2 | 7 | 3 | 42,86% | 4 | 57,14% | Registered |
| Constituency no. 3 | 7 | 2 | 28,57% | 5 | 71,43% | Registered |
| Constituency no. 4 | 7 | 4 | 57,14% | 3 | 42,86% | Registered |
| Constituency no. 5 | 7 | 5 | 71,43% | 2 | 28,57% | Registered |
| Constituency no. 6 | 9 | 5 | 55,56% | 4 | 44,44% | Registered |
| Constituency no. 7 | 7 | 3 | 42,86% | 4 | 57,14% | Registered |
| Totalling | 51 | 24 | 47,06% | 27 | 52,94% | |
| Age of the candidates | |||||
| Specification | Average age | Average age of women | Average age of men | Oldest | Youngest |
| Constituency no. 1 | 47 | 53 | 45 | 63 | 24 |
| Constituency no. 2 | 33 | 26 | 39 | 56 | 22 |
| Constituency no. 3 | 37 | 45 | 34 | 63 | 25 |
| Constituency no. 4 | 26 | 28 | 25 | 37 | 24 |
| Constituency no. 5 | 37 | 38 | 33 | 53 | 19 |
| Constituency no. 6 | 32 | 29 | 36 | 51 | 22 |
| Constituency no. 7 | 36 | 38 | 34 | 56 | 24 |
| Specification |
| pow. siedlecki |
| pow. warszawski zachodni |
| pow. wyszkowski |
| The statistics of election committe |
| Lists submitted | ||
| Specification | Number of | |
| lists | councils | |
| Lists submitted for province council | 7 | 1 |
| Lists submitted for county councils | 0 | 0 |
| Lists submitted for councils of cities holding county rights | 0 | 0 |
| Lists submitted for districts councils of the cap. city of Warsaw | 0 | 0 |
| Lists registered for communal councils | 12 | 3 |
| Totalling | 19 | 4 |
| Submitted candidates | |||||
| Specification | Number of candidates | Women | Women (%) | Men | Men (%) |
| Number of candidates submitted for the province council | 51 | 24 | 47,06% | 27 | 52,94% |
| Number of candidates submitted for county councils | 0 | 0 | - | 0 | - |
| Number of candidates submitted for councils of cities holding county rights | 0 | 0 | - | 0 | - |
| Number of candidates submitted for districts councils of the cap. city of Warsaw | 0 | 0 | - | 0 | - |
| Number of candidates registered for communal councils | 15 | 4 | 26,67% | 11 | 73,33% |
| Number of candidates submitted for reeve, mayor and presidential elections | 1 | 0 | 0,00% | 1 | 100,00% |
| Totalling | 67 | 28 | 41,79% | 39 | 58,21% |
| Average age of submitted candidates | |||
| Specification | Average age | Average age of women | Average age of men |
| Average age of candidates submitted for the province council | 35 | 35 | 36 |
| Average age of candidates submitted for county councils | - | - | - |
| Average age of candidates for councils of cities holding county rights | - | - | - |
| Average age of candidates for districts councils of the cap. city of Warsaw | - | - | - |
| Average age of candidates submitted for communal councils | 37 | 31 | 40 |
| Average age of candidates for reeve, mayor, president | 51 | - | 51 |
| Totalling | 35 | 34 | 37 |
| Submitted candidates for councils grouped by age | |||||
| Age | Number of candidates | Women | Women (%) | Men | Men (%) |
| 18-29 | 31 | 16 | 51,61% | 15 | 48,39% |
| 30-39 | 10 | 4 | 40,00% | 6 | 60,00% |
| 40-59 | 23 | 7 | 30,43% | 16 | 69,57% |
| 60+ | 2 | 1 | 50,00% | 1 | 50,00% |
| Totalling | 66 | 28 | 42,42% | 38 | 57,58% |
| Submitted candidates for reeve, mayor, president grouped by age | |||||
| Age | Number of candidates | Women | Women (%) | Men | Men (%) |
| 25-29 | 0 | 0 | - | 0 | - |
| 30-39 | 0 | 0 | - | 0 | - |
| 40-59 | 1 | 0 | 0,00% | 1 | 100,00% |
| 60+ | 0 | 0 | - | 0 | - |
| Totalling | 1 | 0 | 0,00% | 1 | 100,00% |
| The youngest and oldest submitted candidate for councils | ||
| Age | Institution | |
| Youngest | 19 | Sejmik Województwa Mazowieckiego |
| Oldest | 63 | Sejmik Województwa Mazowieckiego |
| The youngest and oldest submitted candidate for reeve, mayor, president | ||
| Age | Institution | |
| Youngest | 51 | Wójt Gminy Somianka |
| Oldest | 51 | Wójt Gminy Somianka |
| Sejmik Województwa Opolskiego |
| Submitted candidates | ||||||
| Specification | Number of candidates | Women | Women (%) | Men | Men (%) | Status |
| Constituency no. 1 | 9 | 6 | 66,67% | 3 | 33,33% | Registered |
| Constituency no. 2 | 8 | 4 | 50,00% | 4 | 50,00% | Registered |
| Constituency no. 3 | 8 | 7 | 87,50% | 1 | 12,50% | Registered |
| Constituency no. 4 | 8 | 4 | 50,00% | 4 | 50,00% | Registered |
| Constituency no. 5 | 8 | 4 | 50,00% | 4 | 50,00% | Registered |
| Totalling | 41 | 25 | 60,98% | 16 | 39,02% | |
| Age of the candidates | |||||
| Specification | Average age | Average age of women | Average age of men | Oldest | Youngest |
| Constituency no. 1 | 29 | 32 | 24 | 56 | 20 |
| Constituency no. 2 | 34 | 41 | 26 | 55 | 23 |
| Constituency no. 3 | 28 | 28 | 26 | 41 | 18 |
| Constituency no. 4 | 38 | 42 | 35 | 60 | 23 |
| Constituency no. 5 | 28 | 28 | 28 | 41 | 20 |
| Specification |
| The statistics of election committe |
| Lists submitted | ||
| Specification | Number of | |
| lists | councils | |
| Lists submitted for province council | 5 | 1 |
| Lists submitted for county councils | 0 | 0 |
| Lists submitted for councils of cities holding county rights | 0 | 0 |
| Lists registered for communal councils | 0 | 0 |
| Totalling | 5 | 1 |
| Submitted candidates | |||||
| Specification | Number of candidates | Women | Women (%) | Men | Men (%) |
| Number of candidates submitted for the province council | 41 | 25 | 60,98% | 16 | 39,02% |
| Number of candidates submitted for county councils | 0 | 0 | - | 0 | - |
| Number of candidates submitted for councils of cities holding county rights | 0 | 0 | - | 0 | - |
| Number of candidates registered for communal councils | 0 | 0 | - | 0 | - |
| Number of candidates submitted for reeve, mayor and presidential elections | 0 | 0 | - | 0 | - |
| Totalling | 41 | 25 | 60,98% | 16 | 39,02% |
| Average age of submitted candidates | |||
| Specification | Average age | Average age of women | Average age of men |
| Average age of candidates submitted for the province council | 31 | 33 | 28 |
| Average age of candidates submitted for county councils | - | - | - |
| Average age of candidates for councils of cities holding county rights | - | - | - |
| Average age of candidates submitted for communal councils | - | - | - |
| Average age of candidates for reeve, mayor, president | - | - | - |
| Totalling | 31 | 33 | 28 |
| Submitted candidates for councils grouped by age | |||||
| Age | Number of candidates | Women | Women (%) | Men | Men (%) |
| 18-29 | 23 | 11 | 47,83% | 12 | 52,17% |
| 30-39 | 10 | 8 | 80,00% | 2 | 20,00% |
| 40-59 | 6 | 5 | 83,33% | 1 | 16,67% |
| 60+ | 2 | 1 | 50,00% | 1 | 50,00% |
| Totalling | 41 | 25 | 60,98% | 16 | 39,02% |
| Submitted candidates for reeve, mayor, president grouped by age | |||||
| Age | Number of candidates | Women | Women (%) | Men | Men (%) |
| 25-29 | 0 | 0 | - | 0 | - |
| 30-39 | 0 | 0 | - | 0 | - |
| 40-59 | 0 | 0 | - | 0 | - |
| 60+ | 0 | 0 | - | 0 | - |
| Totalling | 0 | 0 | - | 0 | - |
| The youngest and oldest submitted candidate for councils | ||
| Age | Institution | |
| Youngest | 18 | Sejmik Województwa Opolskiego |
| Oldest | 60 | Sejmik Województwa Opolskiego |
| Sejmik Województwa Podkarpackiego |
| Submitted candidates | ||||||
| Specification | Number of candidates | Women | Women (%) | Men | Men (%) | Status |
| Constituency no. 1 | 7 | 2 | 28,57% | 5 | 71,43% | Registered |
| Constituency no. 2 | 6 | 1 | 16,67% | 5 | 83,33% | Registered |
| Constituency no. 3 | 7 | 2 | 28,57% | 5 | 71,43% | Registered |
| Constituency no. 4 | 7 | 3 | 42,86% | 4 | 57,14% | Registered |
| Constituency no. 5 | 6 | 1 | 16,67% | 5 | 83,33% | Registered |
| Totalling | 33 | 9 | 27,27% | 24 | 72,73% | |
| Age of the candidates | |||||
| Specification | Average age | Average age of women | Average age of men | Oldest | Youngest |
| Constituency no. 1 | 42 | 51 | 39 | 52 | 30 |
| Constituency no. 2 | 42 | 42 | 42 | 52 | 27 |
| Constituency no. 3 | 39 | 47 | 37 | 54 | 28 |
| Constituency no. 4 | 40 | 36 | 43 | 54 | 25 |
| Constituency no. 5 | 39 | 42 | 39 | 49 | 29 |
| Specification |
| The statistics of election committe |
| Lists submitted | ||
| Specification | Number of | |
| lists | councils | |
| Lists submitted for province council | 5 | 1 |
| Lists submitted for county councils | 0 | 0 |
| Lists submitted for councils of cities holding county rights | 0 | 0 |
| Lists registered for communal councils | 0 | 0 |
| Totalling | 5 | 1 |
| Submitted candidates | |||||
| Specification | Number of candidates | Women | Women (%) | Men | Men (%) |
| Number of candidates submitted for the province council | 33 | 9 | 27,27% | 24 | 72,73% |
| Number of candidates submitted for county councils | 0 | 0 | - | 0 | - |
| Number of candidates submitted for councils of cities holding county rights | 0 | 0 | - | 0 | - |
| Number of candidates registered for communal councils | 0 | 0 | - | 0 | - |
| Number of candidates submitted for reeve, mayor and presidential elections | 0 | 0 | - | 0 | - |
| Totalling | 33 | 9 | 27,27% | 24 | 72,73% |
| Average age of submitted candidates | |||
| Specification | Average age | Average age of women | Average age of men |
| Average age of candidates submitted for the province council | 40 | 43 | 40 |
| Average age of candidates submitted for county councils | - | - | - |
| Average age of candidates for councils of cities holding county rights | - | - | - |
| Average age of candidates submitted for communal councils | - | - | - |
| Average age of candidates for reeve, mayor, president | - | - | - |
| Totalling | 40 | 43 | 40 |
| Submitted candidates for councils grouped by age | |||||
| Age | Number of candidates | Women | Women (%) | Men | Men (%) |
| 18-29 | 6 | 1 | 16,67% | 5 | 83,33% |
| 30-39 | 8 | 1 | 12,50% | 7 | 87,50% |
| 40-59 | 19 | 7 | 36,84% | 12 | 63,16% |
| 60+ | 0 | 0 | - | 0 | - |
| Totalling | 33 | 9 | 27,27% | 24 | 72,73% |
| Submitted candidates for reeve, mayor, president grouped by age | |||||
| Age | Number of candidates | Women | Women (%) | Men | Men (%) |
| 25-29 | 0 | 0 | - | 0 | - |
| 30-39 | 0 | 0 | - | 0 | - |
| 40-59 | 0 | 0 | - | 0 | - |
| 60+ | 0 | 0 | - | 0 | - |
| Totalling | 0 | 0 | - | 0 | - |
| The youngest and oldest submitted candidate for councils | ||
| Age | Institution | |
| Youngest | 25 | Sejmik Województwa Podkarpackiego |
| Oldest | 71 | Sejmik Województwa Podkarpackiego |
| Sejmik Województwa Podlaskiego |
| Submitted candidates | ||||||
| Specification | Number of candidates | Women | Women (%) | Men | Men (%) | Status |
| Constituency no. 2 | 6 | 2 | 33,33% | 4 | 66,67% | Registered |
| Constituency no. 3 | 6 | 0 | 0,00% | 6 | 100,00% | Registered |
| Constituency no. 4 | 7 | 1 | 14,29% | 6 | 85,71% | Registered |
| Constituency no. 5 | 7 | 2 | 28,57% | 5 | 71,43% | Registered |
| Totalling | 26 | 5 | 19,23% | 21 | 80,77% | |
| Age of the candidates | |||||
| Specification | Average age | Average age of women | Average age of men | Oldest | Youngest |
| Constituency no. 2 | 26 | 26 | 27 | 33 | 18 |
| Constituency no. 3 | 36 | - | 36 | 56 | 18 |
| Constituency no. 4 | 32 | 45 | 30 | 52 | 18 |
| Constituency no. 5 | 29 | 40 | 24 | 53 | 19 |
| Specification |
| The statistics of election committe |
| Lists submitted | ||
| Specification | Number of | |
| lists | councils | |
| Lists submitted for province council | 4 | 1 |
| Lists submitted for county councils | 0 | 0 |
| Lists submitted for councils of cities holding county rights | 0 | 0 |
| Lists registered for communal councils | 0 | 0 |
| Totalling | 4 | 1 |
| Submitted candidates | |||||
| Specification | Number of candidates | Women | Women (%) | Men | Men (%) |
| Number of candidates submitted for the province council | 26 | 5 | 19,23% | 21 | 80,77% |
| Number of candidates submitted for county councils | 0 | 0 | - | 0 | - |
| Number of candidates submitted for councils of cities holding county rights | 0 | 0 | - | 0 | - |
| Number of candidates registered for communal councils | 0 | 0 | - | 0 | - |
| Number of candidates submitted for reeve, mayor and presidential elections | 0 | 0 | - | 0 | - |
| Totalling | 26 | 5 | 19,23% | 21 | 80,77% |
| Average age of submitted candidates | |||
| Specification | Average age | Average age of women | Average age of men |
| Average age of candidates submitted for the province council | 31 | 35 | 30 |
| Average age of candidates submitted for county councils | - | - | - |
| Average age of candidates for councils of cities holding county rights | - | - | - |
| Average age of candidates submitted for communal councils | - | - | - |
| Average age of candidates for reeve, mayor, president | - | - | - |
| Totalling | 31 | 35 | 30 |
| Submitted candidates for councils grouped by age | |||||
| Age | Number of candidates | Women | Women (%) | Men | Men (%) |
| 18-29 | 14 | 2 | 14,29% | 12 | 85,71% |
| 30-39 | 6 | 1 | 16,67% | 5 | 83,33% |
| 40-59 | 6 | 2 | 33,33% | 4 | 66,67% |
| 60+ | 0 | 0 | - | 0 | - |
| Totalling | 26 | 5 | 19,23% | 21 | 80,77% |
| Submitted candidates for reeve, mayor, president grouped by age | |||||
| Age | Number of candidates | Women | Women (%) | Men | Men (%) |
| 25-29 | 0 | 0 | - | 0 | - |
| 30-39 | 0 | 0 | - | 0 | - |
| 40-59 | 0 | 0 | - | 0 | - |
| 60+ | 0 | 0 | - | 0 | - |
| Totalling | 0 | 0 | - | 0 | - |
| The youngest and oldest submitted candidate for councils | ||
| Age | Institution | |
| Youngest | 18 | Sejmik Województwa Podlaskiego |
| Oldest | 56 | Sejmik Województwa Podlaskiego |
| Sejmik Województwa Pomorskiego |
| Submitted candidates | ||||||
| Specification | Number of candidates | Women | Women (%) | Men | Men (%) | Status |
| Constituency no. 1 | 9 | 4 | 44,44% | 5 | 55,56% | Registered |
| Constituency no. 2 | 9 | 3 | 33,33% | 6 | 66,67% | Registered |
| Constituency no. 3 | 8 | 3 | 37,50% | 5 | 62,50% | Registered |
| Constituency no. 4 | 8 | 5 | 62,50% | 3 | 37,50% | Registered |
| Constituency no. 5 | 7 | 4 | 57,14% | 3 | 42,86% | Registered |
| Totalling | 41 | 19 | 46,34% | 22 | 53,66% | |
| Age of the candidates | |||||
| Specification | Average age | Average age of women | Average age of men | Oldest | Youngest |
| Constituency no. 1 | 37 | 37 | 37 | 52 | 18 |
| Constituency no. 2 | 46 | 43 | 48 | 56 | 27 |
| Constituency no. 3 | 49 | 39 | 56 | 63 | 26 |
| Constituency no. 4 | 33 | 30 | 39 | 69 | 18 |
| Constituency no. 5 | 37 | 40 | 32 | 66 | 21 |
| Specification |
| The statistics of election committe |
| Lists submitted | ||
| Specification | Number of | |
| lists | councils | |
| Lists submitted for province council | 5 | 1 |
| Lists submitted for county councils | 0 | 0 |
| Lists submitted for councils of cities holding county rights | 0 | 0 |
| Lists registered for communal councils | 0 | 0 |
| Totalling | 5 | 1 |
| Submitted candidates | |||||
| Specification | Number of candidates | Women | Women (%) | Men | Men (%) |
| Number of candidates submitted for the province council | 41 | 19 | 46,34% | 22 | 53,66% |
| Number of candidates submitted for county councils | 0 | 0 | - | 0 | - |
| Number of candidates submitted for councils of cities holding county rights | 0 | 0 | - | 0 | - |
| Number of candidates registered for communal councils | 0 | 0 | - | 0 | - |
| Number of candidates submitted for reeve, mayor and presidential elections | 0 | 0 | - | 0 | - |
| Totalling | 41 | 19 | 46,34% | 22 | 53,66% |
| Average age of submitted candidates | |||
| Specification | Average age | Average age of women | Average age of men |
| Average age of candidates submitted for the province council | 41 | 37 | 44 |
| Average age of candidates submitted for county councils | - | - | - |
| Average age of candidates for councils of cities holding county rights | - | - | - |
| Average age of candidates submitted for communal councils | - | - | - |
| Average age of candidates for reeve, mayor, president | - | - | - |
| Totalling | 41 | 37 | 44 |
| Submitted candidates for councils grouped by age | |||||
| Age | Number of candidates | Women | Women (%) | Men | Men (%) |
| 18-29 | 10 | 6 | 60,00% | 4 | 40,00% |
| 30-39 | 10 | 6 | 60,00% | 4 | 40,00% |
| 40-59 | 18 | 6 | 33,33% | 12 | 66,67% |
| 60+ | 3 | 1 | 33,33% | 2 | 66,67% |
| Totalling | 41 | 19 | 46,34% | 22 | 53,66% |
| Submitted candidates for reeve, mayor, president grouped by age | |||||
| Age | Number of candidates | Women | Women (%) | Men | Men (%) |
| 25-29 | 0 | 0 | - | 0 | - |
| 30-39 | 0 | 0 | - | 0 | - |
| 40-59 | 0 | 0 | - | 0 | - |
| 60+ | 0 | 0 | - | 0 | - |
| Totalling | 0 | 0 | - | 0 | - |
| The youngest and oldest submitted candidate for councils | ||
| Age | Institution | |
| Youngest | 18 | Sejmik Województwa Pomorskiego |
| Oldest | 69 | Sejmik Województwa Pomorskiego |
Province śląskie
| Sejmik Województwa Śląskiego |
| Submitted candidates | ||||||
| Specification | Number of candidates | Women | Women (%) | Men | Men (%) | Status |
| Constituency no. 1 | 9 | 1 | 11,11% | 8 | 88,89% | Registered |
| Constituency no. 2 | 10 | 5 | 50,00% | 5 | 50,00% | Registered |
| Constituency no. 3 | 10 | 3 | 30,00% | 7 | 70,00% | Registered |
| Constituency no. 4 | 10 | 3 | 30,00% | 7 | 70,00% | Registered |
| Constituency no. 5 | 10 | 2 | 20,00% | 8 | 80,00% | Registered |
| Constituency no. 6 | 10 | 3 | 30,00% | 7 | 70,00% | Registered |
| Constituency no. 7 | 10 | 5 | 50,00% | 5 | 50,00% | Registered |
| Totalling | 69 | 22 | 31,88% | 47 | 68,12% | |
| Age of the candidates | |||||
| Specification | Average age | Average age of women | Average age of men | Oldest | Youngest |
| Constituency no. 1 | 43 | 42 | 43 | 59 | 30 |
| Constituency no. 2 | 45 | 48 | 42 | 54 | 23 |
| Constituency no. 3 | 36 | 30 | 39 | 62 | 21 |
| Constituency no. 4 | 38 | 43 | 36 | 55 | 24 |
| Constituency no. 5 | 42 | 38 | 43 | 49 | 33 |
| Constituency no. 6 | 34 | 30 | 35 | 57 | 19 |
| Constituency no. 7 | 34 | 32 | 36 | 56 | 24 |
| Specification |
| pow. myszkowski |
| The statistics of election committe |
| Lists submitted | ||
| Specification | Number of | |
| lists | councils | |
| Lists submitted for province council | 7 | 1 |
| Lists submitted for county councils | 1 | 1 |
| Lists submitted for councils of cities holding county rights | 0 | 0 |
| Lists registered for communal councils | 1 | 1 |
| Totalling | 9 | 3 |
| Submitted candidates | |||||
| Specification | Number of candidates | Women | Women (%) | Men | Men (%) |
| Number of candidates submitted for the province council | 69 | 22 | 31,88% | 47 | 68,12% |
| Number of candidates submitted for county councils | 5 | 0 | 0,00% | 5 | 100,00% |
| Number of candidates submitted for councils of cities holding county rights | 0 | 0 | - | 0 | - |
| Number of candidates registered for communal councils | 1 | 0 | 0,00% | 1 | 100,00% |
| Number of candidates submitted for reeve, mayor and presidential elections | 0 | 0 | - | 0 | - |
| Totalling | 75 | 22 | 29,33% | 53 | 70,67% |
| Average age of submitted candidates | |||
| Specification | Average age | Average age of women | Average age of men |
| Average age of candidates submitted for the province council | 39 | 38 | 39 |
| Average age of candidates submitted for county councils | 60 | - | 60 |
| Average age of candidates for councils of cities holding county rights | - | - | - |
| Average age of candidates submitted for communal councils | 20 | - | 20 |
| Average age of candidates for reeve, mayor, president | - | - | - |
| Totalling | 40 | 38 | 40 |
| Submitted candidates for councils grouped by age | |||||
| Age | Number of candidates | Women | Women (%) | Men | Men (%) |
| 18-29 | 13 | 5 | 38,46% | 8 | 61,54% |
| 30-39 | 25 | 7 | 28,00% | 18 | 72,00% |
| 40-59 | 33 | 10 | 30,30% | 23 | 69,70% |
| 60+ | 4 | 0 | 0,00% | 4 | 100,00% |
| Totalling | 75 | 22 | 29,33% | 53 | 70,67% |
| Submitted candidates for reeve, mayor, president grouped by age | |||||
| Age | Number of candidates | Women | Women (%) | Men | Men (%) |
| 25-29 | 0 | 0 | - | 0 | - |
| 30-39 | 0 | 0 | - | 0 | - |
| 40-59 | 0 | 0 | - | 0 | - |
| 60+ | 0 | 0 | - | 0 | - |
| Totalling | 0 | 0 | - | 0 | - |
| The youngest and oldest submitted candidate for councils | ||
| Age | Institution | |
| Youngest | 19 | Sejmik Województwa Śląskiego |
| Oldest | 71 | Rada Powiatu w Myszkowie |
Province świętokrzyskie
| Sejmik Województwa Świętokrzyskiego |
| Submitted candidates | ||||||
| Specification | Number of candidates | Women | Women (%) | Men | Men (%) | Status |
| Constituency no. 1 | 7 | 3 | 42,86% | 4 | 57,14% | Registered |
| Constituency no. 2 | 9 | 1 | 11,11% | 8 | 88,89% | Registered |
| Constituency no. 3 | 9 | 4 | 44,44% | 5 | 55,56% | Registered |
| Constituency no. 4 | 8 | 4 | 50,00% | 4 | 50,00% | Registered |
| Totalling | 33 | 12 | 36,36% | 21 | 63,64% | |
| Age of the candidates | |||||
| Specification | Average age | Average age of women | Average age of men | Oldest | Youngest |
| Constituency no. 1 | 34 | 34 | 35 | 56 | 23 |
| Constituency no. 2 | 39 | 38 | 39 | 66 | 20 |
| Constituency no. 3 | 36 | 34 | 38 | 58 | 21 |
| Constituency no. 4 | 32 | 29 | 36 | 47 | 20 |
| Specification |
| pow. jędrzejowski |
| pow. kielecki |
| The statistics of election committe |
| Lists submitted | ||
| Specification | Number of | |
| lists | councils | |
| Lists submitted for province council | 4 | 1 |
| Lists submitted for county councils | 0 | 0 |
| Lists submitted for councils of cities holding county rights | 0 | 0 |
| Lists registered for communal councils | 15 | 2 |
| Totalling | 19 | 3 |
| Submitted candidates | |||||
| Specification | Number of candidates | Women | Women (%) | Men | Men (%) |
| Number of candidates submitted for the province council | 33 | 12 | 36,36% | 21 | 63,64% |
| Number of candidates submitted for county councils | 0 | 0 | - | 0 | - |
| Number of candidates submitted for councils of cities holding county rights | 0 | 0 | - | 0 | - |
| Number of candidates registered for communal councils | 16 | 4 | 25,00% | 12 | 75,00% |
| Number of candidates submitted for reeve, mayor and presidential elections | 1 | 0 | 0,00% | 1 | 100,00% |
| Totalling | 50 | 16 | 32,00% | 34 | 68,00% |
| Average age of submitted candidates | |||
| Specification | Average age | Average age of women | Average age of men |
| Average age of candidates submitted for the province council | 36 | 33 | 37 |
| Average age of candidates submitted for county councils | - | - | - |
| Average age of candidates for councils of cities holding county rights | - | - | - |
| Average age of candidates submitted for communal councils | 35 | 32 | 36 |
| Average age of candidates for reeve, mayor, president | 39 | - | 39 |
| Totalling | 35 | 32 | 36 |
| Submitted candidates for councils grouped by age | |||||
| Age | Number of candidates | Women | Women (%) | Men | Men (%) |
| 18-29 | 19 | 6 | 31,58% | 13 | 68,42% |
| 30-39 | 15 | 8 | 53,33% | 7 | 46,67% |
| 40-59 | 13 | 2 | 15,38% | 11 | 84,62% |
| 60+ | 2 | 0 | 0,00% | 2 | 100,00% |
| Totalling | 49 | 16 | 32,65% | 33 | 67,35% |
| Submitted candidates for reeve, mayor, president grouped by age | |||||
| Age | Number of candidates | Women | Women (%) | Men | Men (%) |
| 25-29 | 0 | 0 | - | 0 | - |
| 30-39 | 1 | 0 | 0,00% | 1 | 100,00% |
| 40-59 | 0 | 0 | - | 0 | - |
| 60+ | 0 | 0 | - | 0 | - |
| Totalling | 1 | 0 | 0,00% | 1 | 100,00% |
| The youngest and oldest submitted candidate for councils | ||
| Age | Institution | |
| Youngest | 20 | Sejmik Województwa Świętokrzyskiego |
| Oldest | 66 | Sejmik Województwa Świętokrzyskiego |
| The youngest and oldest submitted candidate for reeve, mayor, president | ||
| Age | Institution | |
| Youngest | 39 | Wójt Gminy Imielno |
| Oldest | 39 | Wójt Gminy Imielno |
Province warmińsko-mazurskie
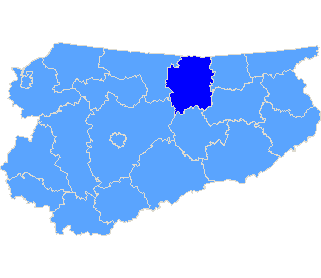
| Sejmik Województwa Warmińsko-Mazurskiego |
| Submitted candidates | ||||||
| Specification | Number of candidates | Women | Women (%) | Men | Men (%) | Status |
| Constituency no. 1 | 6 | 4 | 66,67% | 2 | 33,33% | Registered |
| Constituency no. 2 | 7 | 4 | 57,14% | 3 | 42,86% | Registered |
| Constituency no. 3 | 7 | 6 | 85,71% | 1 | 14,29% | Registered |
| Constituency no. 4 | 6 | 5 | 83,33% | 1 | 16,67% | Registered |
| Constituency no. 5 | 7 | 2 | 28,57% | 5 | 71,43% | Registered |
| Totalling | 33 | 21 | 63,64% | 12 | 36,36% | |
| Age of the candidates | |||||
| Specification | Average age | Average age of women | Average age of men | Oldest | Youngest |
| Constituency no. 1 | 29 | 24 | 40 | 55 | 18 |
| Constituency no. 2 | 31 | 34 | 26 | 48 | 23 |
| Constituency no. 3 | 30 | 29 | 39 | 40 | 22 |
| Constituency no. 4 | 42 | 43 | 37 | 53 | 23 |
| Constituency no. 5 | 33 | 24 | 37 | 47 | 20 |
| Specification |
| pow. kętrzyński |
| The statistics of election committe |
| Lists submitted | ||
| Specification | Number of | |
| lists | councils | |
| Lists submitted for province council | 5 | 1 |
| Lists submitted for county councils | 0 | 0 |
| Lists submitted for councils of cities holding county rights | 0 | 0 |
| Lists registered for communal councils | 6 | 1 |
| Totalling | 11 | 2 |
| Submitted candidates | |||||
| Specification | Number of candidates | Women | Women (%) | Men | Men (%) |
| Number of candidates submitted for the province council | 33 | 21 | 63,64% | 12 | 36,36% |
| Number of candidates submitted for county councils | 0 | 0 | - | 0 | - |
| Number of candidates submitted for councils of cities holding county rights | 0 | 0 | - | 0 | - |
| Number of candidates registered for communal councils | 7 | 5 | 71,43% | 2 | 28,57% |
| Number of candidates submitted for reeve, mayor and presidential elections | 1 | 0 | 0,00% | 1 | 100,00% |
| Totalling | 41 | 26 | 63,41% | 15 | 36,59% |
| Average age of submitted candidates | |||
| Specification | Average age | Average age of women | Average age of men |
| Average age of candidates submitted for the province council | 33 | 32 | 35 |
| Average age of candidates submitted for county councils | - | - | - |
| Average age of candidates for councils of cities holding county rights | - | - | - |
| Average age of candidates submitted for communal councils | 42 | 44 | 37 |
| Average age of candidates for reeve, mayor, president | 37 | - | 37 |
| Totalling | 34 | 34 | 35 |
| Submitted candidates for councils grouped by age | |||||
| Age | Number of candidates | Women | Women (%) | Men | Men (%) |
| 18-29 | 17 | 12 | 70,59% | 5 | 29,41% |
| 30-39 | 9 | 5 | 55,56% | 4 | 44,44% |
| 40-59 | 13 | 8 | 61,54% | 5 | 38,46% |
| 60+ | 1 | 1 | 100,00% | 0 | 0,00% |
| Totalling | 40 | 26 | 65,00% | 14 | 35,00% |
| Submitted candidates for reeve, mayor, president grouped by age | |||||
| Age | Number of candidates | Women | Women (%) | Men | Men (%) |
| 25-29 | 0 | 0 | - | 0 | - |
| 30-39 | 1 | 0 | 0,00% | 1 | 100,00% |
| 40-59 | 0 | 0 | - | 0 | - |
| 60+ | 0 | 0 | - | 0 | - |
| Totalling | 1 | 0 | 0,00% | 1 | 100,00% |
| The youngest and oldest submitted candidate for councils | ||
| Age | Institution | |
| Youngest | 18 | Sejmik Województwa Warmińsko-Mazurskiego |
| Oldest | 64 | Rada Miejska w Korszach |
| The youngest and oldest submitted candidate for reeve, mayor, president | ||
| Age | Institution | |
| Youngest | 37 | Burmistrz Korsz |
| Oldest | 37 | Burmistrz Korsz |
| Sejmik Województwa Wielkopolskiego |
| Submitted candidates | ||||||
| Specification | Number of candidates | Women | Women (%) | Men | Men (%) | Status |
| Constituency no. 1 | 7 | 4 | 57,14% | 3 | 42,86% | Registered |
| Constituency no. 2 | 7 | 3 | 42,86% | 4 | 57,14% | Registered |
| Constituency no. 3 | 7 | 3 | 42,86% | 4 | 57,14% | Registered |
| Constituency no. 4 | 7 | 4 | 57,14% | 3 | 42,86% | Registered |
| Constituency no. 5 | 7 | 4 | 57,14% | 3 | 42,86% | Registered |
| Constituency no. 6 | 6 | 2 | 33,33% | 4 | 66,67% | Registered |
| Totalling | 41 | 20 | 48,78% | 21 | 51,22% | |
| Age of the candidates | |||||
| Specification | Average age | Average age of women | Average age of men | Oldest | Youngest |
| Constituency no. 1 | 38 | 30 | 50 | 56 | 25 |
| Constituency no. 2 | 42 | 41 | 43 | 63 | 19 |
| Constituency no. 3 | 40 | 40 | 40 | 63 | 21 |
| Constituency no. 4 | 28 | 30 | 25 | 53 | 21 |
| Constituency no. 5 | 34 | 29 | 41 | 50 | 22 |
| Constituency no. 6 | 30 | 33 | 29 | 43 | 22 |
| Specification |
| The statistics of election committe |
| Lists submitted | ||
| Specification | Number of | |
| lists | councils | |
| Lists submitted for province council | 6 | 1 |
| Lists submitted for county councils | 0 | 0 |
| Lists submitted for councils of cities holding county rights | 0 | 0 |
| Lists registered for communal councils | 0 | 0 |
| Totalling | 6 | 1 |
| Submitted candidates | |||||
| Specification | Number of candidates | Women | Women (%) | Men | Men (%) |
| Number of candidates submitted for the province council | 41 | 20 | 48,78% | 21 | 51,22% |
| Number of candidates submitted for county councils | 0 | 0 | - | 0 | - |
| Number of candidates submitted for councils of cities holding county rights | 0 | 0 | - | 0 | - |
| Number of candidates registered for communal councils | 0 | 0 | - | 0 | - |
| Number of candidates submitted for reeve, mayor and presidential elections | 0 | 0 | - | 0 | - |
| Totalling | 41 | 20 | 48,78% | 21 | 51,22% |
| Average age of submitted candidates | |||
| Specification | Average age | Average age of women | Average age of men |
| Average age of candidates submitted for the province council | 35 | 33 | 38 |
| Average age of candidates submitted for county councils | - | - | - |
| Average age of candidates for councils of cities holding county rights | - | - | - |
| Average age of candidates submitted for communal councils | - | - | - |
| Average age of candidates for reeve, mayor, president | - | - | - |
| Totalling | 35 | 33 | 38 |
| Submitted candidates for councils grouped by age | |||||
| Age | Number of candidates | Women | Women (%) | Men | Men (%) |
| 18-29 | 19 | 11 | 57,89% | 8 | 42,11% |
| 30-39 | 7 | 3 | 42,86% | 4 | 57,14% |
| 40-59 | 12 | 5 | 41,67% | 7 | 58,33% |
| 60+ | 3 | 1 | 33,33% | 2 | 66,67% |
| Totalling | 41 | 20 | 48,78% | 21 | 51,22% |
| Submitted candidates for reeve, mayor, president grouped by age | |||||
| Age | Number of candidates | Women | Women (%) | Men | Men (%) |
| 25-29 | 0 | 0 | - | 0 | - |
| 30-39 | 0 | 0 | - | 0 | - |
| 40-59 | 0 | 0 | - | 0 | - |
| 60+ | 0 | 0 | - | 0 | - |
| Totalling | 0 | 0 | - | 0 | - |
| The youngest and oldest submitted candidate for councils | ||
| Age | Institution | |
| Youngest | 19 | Sejmik Województwa Wielkopolskiego |
| Oldest | 63 | Sejmik Województwa Wielkopolskiego |
| Sejmik Województwa Zachodniopomorskiego |
| Submitted candidates | ||||||
| Specification | Number of candidates | Women | Women (%) | Men | Men (%) | Status |
| Constituency no. 1 | 7 | 6 | 85,71% | 1 | 14,29% | Registered |
| Constituency no. 2 | 6 | 4 | 66,67% | 2 | 33,33% | Registered |
| Constituency no. 3 | 6 | 3 | 50,00% | 3 | 50,00% | Registered |
| Constituency no. 4 | 6 | 1 | 16,67% | 5 | 83,33% | Registered |
| Constituency no. 5 | 8 | 3 | 37,50% | 5 | 62,50% | Registered |
| Totalling | 33 | 17 | 51,52% | 16 | 48,48% | |
| Age of the candidates | |||||
| Specification | Average age | Average age of women | Average age of men | Oldest | Youngest |
| Constituency no. 1 | 34 | 32 | 48 | 48 | 23 |
| Constituency no. 2 | 42 | 49 | 28 | 60 | 22 |
| Constituency no. 3 | 29 | 26 | 33 | 40 | 20 |
| Constituency no. 4 | 42 | 84 | 34 | 84 | 20 |
| Constituency no. 5 | 43 | 51 | 38 | 57 | 21 |
| Specification |
| The statistics of election committe |
| Lists submitted | ||
| Specification | Number of | |
| lists | councils | |
| Lists submitted for province council | 5 | 1 |
| Lists submitted for county councils | 0 | 0 |
| Lists submitted for councils of cities holding county rights | 0 | 0 |
| Lists registered for communal councils | 0 | 0 |
| Totalling | 5 | 1 |
| Submitted candidates | |||||
| Specification | Number of candidates | Women | Women (%) | Men | Men (%) |
| Number of candidates submitted for the province council | 33 | 17 | 51,52% | 16 | 48,48% |
| Number of candidates submitted for county councils | 0 | 0 | - | 0 | - |
| Number of candidates submitted for councils of cities holding county rights | 0 | 0 | - | 0 | - |
| Number of candidates registered for communal councils | 0 | 0 | - | 0 | - |
| Number of candidates submitted for reeve, mayor and presidential elections | 0 | 0 | - | 0 | - |
| Totalling | 33 | 17 | 51,52% | 16 | 48,48% |
| Average age of submitted candidates | |||
| Specification | Average age | Average age of women | Average age of men |
| Average age of candidates submitted for the province council | 38 | 41 | 35 |
| Average age of candidates submitted for county councils | - | - | - |
| Average age of candidates for councils of cities holding county rights | - | - | - |
| Average age of candidates submitted for communal councils | - | - | - |
| Average age of candidates for reeve, mayor, president | - | - | - |
| Totalling | 38 | 41 | 35 |
| Submitted candidates for councils grouped by age | |||||
| Age | Number of candidates | Women | Women (%) | Men | Men (%) |
| 18-29 | 14 | 6 | 42,86% | 8 | 57,14% |
| 30-39 | 4 | 2 | 50,00% | 2 | 50,00% |
| 40-59 | 13 | 7 | 53,85% | 6 | 46,15% |
| 60+ | 2 | 2 | 100,00% | 0 | 0,00% |
| Totalling | 33 | 17 | 51,52% | 16 | 48,48% |
| Submitted candidates for reeve, mayor, president grouped by age | |||||
| Age | Number of candidates | Women | Women (%) | Men | Men (%) |
| 25-29 | 0 | 0 | - | 0 | - |
| 30-39 | 0 | 0 | - | 0 | - |
| 40-59 | 0 | 0 | - | 0 | - |
| 60+ | 0 | 0 | - | 0 | - |
| Totalling | 0 | 0 | - | 0 | - |
| The youngest and oldest submitted candidate for councils | ||
| Age | Institution | |
| Youngest | 20 | Sejmik Województwa Zachodniopomorskiego |
| Oldest | 84 | Sejmik Województwa Zachodniopomorskiego |
