

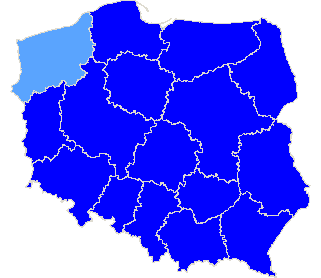
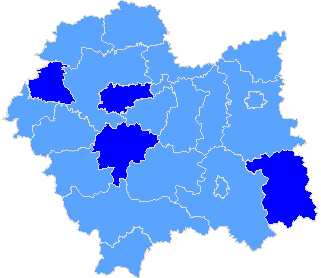
Rzeczpospolita Polska
| The statistics of election committe |
| Lists submitted | ||
| Specification | Number of | |
| lists | councils | |
| Lists submitted for provinces councils | 46 | 13 |
| Lists submitted for county councils | 1 | 1 |
| Lists submitted for councils of cities holding county rights | 28 | 6 |
| Lists submitted for districts councils of the cap. city of Warsaw | 0 | 0 |
| Lists registered for communal councils | 17 | 15 |
| Totalling | 92 | 35 |
| Submitted candidates | |||||
| Specification | Number of candidates | Women | Women (%) | Men | Men (%) |
| Number of candidates submitted for the province council | 314 | 50 | 15,92% | 264 | 84,08% |
| Number of candidates submitted for county councils | 4 | 0 | 0,00% | 4 | 100,00% |
| Number of candidates submitted for councils of cities holding county rights | 208 | 65 | 31,25% | 143 | 68,75% |
| Number of candidates submitted for districts councils of the cap. city of Warsaw | 0 | 0 | - | 0 | - |
| Number of candidates registered for communal councils | 30 | 2 | 6,67% | 28 | 93,33% |
| Number of candidates submitted for reeve, mayor and presidential elections | 3 | 0 | 0,00% | 3 | 100,00% |
| Totalling | 559 | 117 | 20,93% | 442 | 79,07% |
| Average age of submitted candidates | |||
| Specification | Average age | Average age of women | Average age of men |
| Average age of candidates submitted for the province council | 35 | 41 | 34 |
| Average age of candidates submitted for county councils | 43 | - | 43 |
| Average age of candidates for councils of cities holding county rights | 37 | 40 | 36 |
| Average age of candidates submitted for communal councils | 27 | 24 | 27 |
| Average age of candidates for reeve, mayor, president | 59 | - | 59 |
| Totalling | 35 | 40 | 34 |
| Submitted candidates for councils grouped by age | |||||
| Age | Number of candidates | Women | Women (%) | Men | Men (%) |
| 18-29 | 237 | 36 | 15,19% | 201 | 84,81% |
| 30-39 | 117 | 24 | 20,51% | 93 | 79,49% |
| 40-59 | 167 | 41 | 24,55% | 126 | 75,45% |
| 60+ | 35 | 16 | 45,71% | 19 | 54,29% |
| Totalling | 556 | 117 | 21,04% | 439 | 78,96% |
| Submitted candidates for reeve, mayor, president grouped by age | |||||
| Age | Number of candidates | Women | Women (%) | Men | Men (%) |
| 25-29 | 0 | 0 | - | 0 | - |
| 30-39 | 0 | 0 | - | 0 | - |
| 40-59 | 2 | 0 | 0,00% | 2 | 100,00% |
| 60+ | 1 | 0 | 0,00% | 1 | 100,00% |
| Totalling | 3 | 0 | 0,00% | 3 | 100,00% |
| The youngest and oldest submitted candidate for councils | ||
| Age | Institution | |
| Youngest | 18 | Sejmik Województwa Mazowieckiego |
| Oldest | 87 | Rada Miasta Szczecin |
| The youngest and oldest submitted candidate for reeve, mayor, president | ||
| Age | Institution | |
| Youngest | 54 | Prezydent Miasta Krakowa |
| Oldest | 68 | Prezydent m.st. Warszawy |
| Sejmik Województwa Dolnośląskiego |
| Submitted candidates | ||||||
| Specification | Number of candidates | Women | Women (%) | Men | Men (%) | Status |
| Constituency no. 1 | 5 | 0 | 0,00% | 5 | 100,00% | Registered |
| Constituency no. 2 | 6 | 0 | 0,00% | 6 | 100,00% | Registered |
| Constituency no. 3 | 6 | 0 | 0,00% | 6 | 100,00% | Registered |
| Constituency no. 4 | 6 | 2 | 33,33% | 4 | 66,67% | Registered |
| Constituency no. 5 | 5 | 1 | 20,00% | 4 | 80,00% | Registered |
| Totalling | 28 | 3 | 10,71% | 25 | 89,29% | |
| Age of the candidates | |||||
| Specification | Average age | Average age of women | Average age of men | Oldest | Youngest |
| Constituency no. 1 | 34 | - | 34 | 54 | 23 |
| Constituency no. 2 | 26 | - | 26 | 33 | 19 |
| Constituency no. 3 | 35 | - | 35 | 56 | 20 |
| Constituency no. 4 | 48 | 55 | 45 | 57 | 36 |
| Constituency no. 5 | 51 | 61 | 48 | 62 | 23 |
| Specification |
| The statistics of election committe |
| Lists submitted | ||
| Specification | Number of | |
| lists | councils | |
| Lists submitted for province council | 5 | 1 |
| Lists submitted for county councils | 0 | 0 |
| Lists submitted for councils of cities holding county rights | 0 | 0 |
| Lists registered for communal councils | 0 | 0 |
| Totalling | 5 | 1 |
| Submitted candidates | |||||
| Specification | Number of candidates | Women | Women (%) | Men | Men (%) |
| Number of candidates submitted for the province council | 28 | 3 | 10,71% | 25 | 89,29% |
| Number of candidates submitted for county councils | 0 | 0 | - | 0 | - |
| Number of candidates submitted for councils of cities holding county rights | 0 | 0 | - | 0 | - |
| Number of candidates registered for communal councils | 0 | 0 | - | 0 | - |
| Number of candidates submitted for reeve, mayor and presidential elections | 0 | 0 | - | 0 | - |
| Totalling | 28 | 3 | 10,71% | 25 | 89,29% |
| Average age of submitted candidates | |||
| Specification | Average age | Average age of women | Average age of men |
| Average age of candidates submitted for the province council | 38 | 57 | 36 |
| Average age of candidates submitted for county councils | - | - | - |
| Average age of candidates for councils of cities holding county rights | - | - | - |
| Average age of candidates submitted for communal councils | - | - | - |
| Average age of candidates for reeve, mayor, president | - | - | - |
| Totalling | 38 | 57 | 36 |
| Submitted candidates for councils grouped by age | |||||
| Age | Number of candidates | Women | Women (%) | Men | Men (%) |
| 18-29 | 11 | 0 | 0,00% | 11 | 100,00% |
| 30-39 | 4 | 0 | 0,00% | 4 | 100,00% |
| 40-59 | 11 | 2 | 18,18% | 9 | 81,82% |
| 60+ | 2 | 1 | 50,00% | 1 | 50,00% |
| Totalling | 28 | 3 | 10,71% | 25 | 89,29% |
| Submitted candidates for reeve, mayor, president grouped by age | |||||
| Age | Number of candidates | Women | Women (%) | Men | Men (%) |
| 25-29 | 0 | 0 | - | 0 | - |
| 30-39 | 0 | 0 | - | 0 | - |
| 40-59 | 0 | 0 | - | 0 | - |
| 60+ | 0 | 0 | - | 0 | - |
| Totalling | 0 | 0 | - | 0 | - |
| The youngest and oldest submitted candidate for councils | ||
| Age | Institution | |
| Youngest | 19 | Sejmik Województwa Dolnośląskiego |
| Oldest | 62 | Sejmik Województwa Dolnośląskiego |
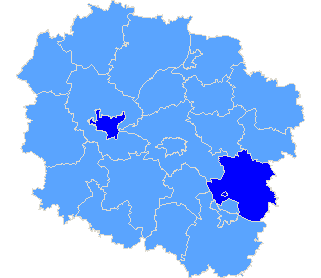
Province kujawsko-pomorskie
| Sejmik Województwa Kujawsko-Pomorskiego |
| Submitted candidates | ||||||
| Specification | Number of candidates | Women | Women (%) | Men | Men (%) | Status |
| Constituency no. 4 | 5 | 0 | 0,00% | 5 | 100,00% | Registered |
| Totalling | 5 | 0 | 0,00% | 5 | 100,00% | |
| Age of the candidates | |||||
| Specification | Average age | Average age of women | Average age of men | Oldest | Youngest |
| Constituency no. 4 | 29 | - | 29 | 40 | 21 |
| Specification |
| m. Bydgoszcz |
| pow. lipnowski |
| The statistics of election committe |
| Lists submitted | ||
| Specification | Number of | |
| lists | councils | |
| Lists submitted for province council | 1 | 1 |
| Lists submitted for county councils | 0 | 0 |
| Lists submitted for councils of cities holding county rights | 1 | 1 |
| Lists registered for communal councils | 1 | 1 |
| Totalling | 3 | 3 |
| Submitted candidates | |||||
| Specification | Number of candidates | Women | Women (%) | Men | Men (%) |
| Number of candidates submitted for the province council | 5 | 0 | 0,00% | 5 | 100,00% |
| Number of candidates submitted for county councils | 0 | 0 | - | 0 | - |
| Number of candidates submitted for councils of cities holding county rights | 5 | 0 | 0,00% | 5 | 100,00% |
| Number of candidates registered for communal councils | 1 | 0 | 0,00% | 1 | 100,00% |
| Number of candidates submitted for reeve, mayor and presidential elections | 0 | 0 | - | 0 | - |
| Totalling | 11 | 0 | 0,00% | 11 | 100,00% |
| Average age of submitted candidates | |||
| Specification | Average age | Average age of women | Average age of men |
| Average age of candidates submitted for the province council | 29 | - | 29 |
| Average age of candidates submitted for county councils | - | - | - |
| Average age of candidates for councils of cities holding county rights | 33 | - | 33 |
| Average age of candidates submitted for communal councils | 41 | - | 41 |
| Average age of candidates for reeve, mayor, president | - | - | - |
| Totalling | 31 | - | 31 |
| Submitted candidates for councils grouped by age | |||||
| Age | Number of candidates | Women | Women (%) | Men | Men (%) |
| 18-29 | 5 | 0 | 0,00% | 5 | 100,00% |
| 30-39 | 3 | 0 | 0,00% | 3 | 100,00% |
| 40-59 | 2 | 0 | 0,00% | 2 | 100,00% |
| 60+ | 1 | 0 | 0,00% | 1 | 100,00% |
| Totalling | 11 | 0 | 0,00% | 11 | 100,00% |
| Submitted candidates for reeve, mayor, president grouped by age | |||||
| Age | Number of candidates | Women | Women (%) | Men | Men (%) |
| 25-29 | 0 | 0 | - | 0 | - |
| 30-39 | 0 | 0 | - | 0 | - |
| 40-59 | 0 | 0 | - | 0 | - |
| 60+ | 0 | 0 | - | 0 | - |
| Totalling | 0 | 0 | - | 0 | - |
| The youngest and oldest submitted candidate for councils | ||
| Age | Institution | |
| Youngest | 21 | Sejmik Województwa Kujawsko-Pomorskiego |
| Oldest | 61 | Rada Miasta Bydgoszczy |
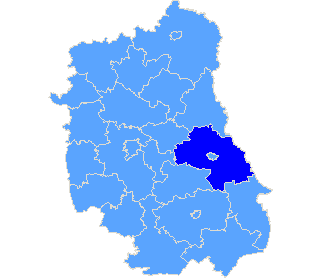
Province lubelskie
| Sejmik Województwa Lubelskiego |
| Submitted candidates | ||||||
| Specification | Number of candidates | Women | Women (%) | Men | Men (%) | Status |
| Constituency no. 3 | 5 | 1 | 20,00% | 4 | 80,00% | Registered |
| Constituency no. 4 | 5 | 2 | 40,00% | 3 | 60,00% | Registered |
| Totalling | 10 | 3 | 30,00% | 7 | 70,00% | |
| Age of the candidates | |||||
| Specification | Average age | Average age of women | Average age of men | Oldest | Youngest |
| Constituency no. 3 | 30 | 26 | 31 | 52 | 22 |
| Constituency no. 4 | 24 | 24 | 24 | 27 | 22 |
| Specification |
| pow. chełmski |
| The statistics of election committe |
| Lists submitted | ||
| Specification | Number of | |
| lists | councils | |
| Lists submitted for province council | 2 | 1 |
| Lists submitted for county councils | 0 | 0 |
| Lists submitted for councils of cities holding county rights | 0 | 0 |
| Lists registered for communal councils | 1 | 1 |
| Totalling | 3 | 2 |
| Submitted candidates | |||||
| Specification | Number of candidates | Women | Women (%) | Men | Men (%) |
| Number of candidates submitted for the province council | 10 | 3 | 30,00% | 7 | 70,00% |
| Number of candidates submitted for county councils | 0 | 0 | - | 0 | - |
| Number of candidates submitted for councils of cities holding county rights | 0 | 0 | - | 0 | - |
| Number of candidates registered for communal councils | 1 | 0 | 0,00% | 1 | 100,00% |
| Number of candidates submitted for reeve, mayor and presidential elections | 0 | 0 | - | 0 | - |
| Totalling | 11 | 3 | 27,27% | 8 | 72,73% |
| Average age of submitted candidates | |||
| Specification | Average age | Average age of women | Average age of men |
| Average age of candidates submitted for the province council | 27 | 25 | 28 |
| Average age of candidates submitted for county councils | - | - | - |
| Average age of candidates for councils of cities holding county rights | - | - | - |
| Average age of candidates submitted for communal councils | 23 | - | 23 |
| Average age of candidates for reeve, mayor, president | - | - | - |
| Totalling | 26 | 25 | 27 |
| Submitted candidates for councils grouped by age | |||||
| Age | Number of candidates | Women | Women (%) | Men | Men (%) |
| 18-29 | 10 | 3 | 30,00% | 7 | 70,00% |
| 30-39 | 0 | 0 | - | 0 | - |
| 40-59 | 1 | 0 | 0,00% | 1 | 100,00% |
| 60+ | 0 | 0 | - | 0 | - |
| Totalling | 11 | 3 | 27,27% | 8 | 72,73% |
| Submitted candidates for reeve, mayor, president grouped by age | |||||
| Age | Number of candidates | Women | Women (%) | Men | Men (%) |
| 25-29 | 0 | 0 | - | 0 | - |
| 30-39 | 0 | 0 | - | 0 | - |
| 40-59 | 0 | 0 | - | 0 | - |
| 60+ | 0 | 0 | - | 0 | - |
| Totalling | 0 | 0 | - | 0 | - |
| The youngest and oldest submitted candidate for councils | ||
| Age | Institution | |
| Youngest | 20 | Sejmik Województwa Lubelskiego |
| Oldest | 52 | Sejmik Województwa Lubelskiego |
| Sejmik Województwa Lubuskiego |
| Submitted candidates | ||||||
| Specification | Number of candidates | Women | Women (%) | Men | Men (%) | Status |
| Constituency no. 1 | 10 | 1 | 10,00% | 9 | 90,00% | Registered |
| Constituency no. 2 | 6 | 1 | 16,67% | 5 | 83,33% | Registered |
| Constituency no. 3 | 6 | 2 | 33,33% | 4 | 66,67% | Registered |
| Constituency no. 4 | 6 | 1 | 16,67% | 5 | 83,33% | Registered |
| Constituency no. 5 | 6 | 0 | 0,00% | 6 | 100,00% | Registered |
| Totalling | 34 | 5 | 14,71% | 29 | 85,29% | |
| Age of the candidates | |||||
| Specification | Average age | Average age of women | Average age of men | Oldest | Youngest |
| Constituency no. 1 | 40 | 53 | 38 | 63 | 19 |
| Constituency no. 2 | 33 | 28 | 34 | 51 | 20 |
| Constituency no. 3 | 41 | 55 | 34 | 64 | 22 |
| Constituency no. 4 | 40 | 39 | 40 | 65 | 18 |
| Constituency no. 5 | 36 | - | 36 | 51 | 21 |
| Specification |
| The statistics of election committe |
| Lists submitted | ||
| Specification | Number of | |
| lists | councils | |
| Lists submitted for province council | 5 | 1 |
| Lists submitted for county councils | 0 | 0 |
| Lists submitted for councils of cities holding county rights | 0 | 0 |
| Lists registered for communal councils | 0 | 0 |
| Totalling | 5 | 1 |
| Submitted candidates | |||||
| Specification | Number of candidates | Women | Women (%) | Men | Men (%) |
| Number of candidates submitted for the province council | 34 | 5 | 14,71% | 29 | 85,29% |
| Number of candidates submitted for county councils | 0 | 0 | - | 0 | - |
| Number of candidates submitted for councils of cities holding county rights | 0 | 0 | - | 0 | - |
| Number of candidates registered for communal councils | 0 | 0 | - | 0 | - |
| Number of candidates submitted for reeve, mayor and presidential elections | 0 | 0 | - | 0 | - |
| Totalling | 34 | 5 | 14,71% | 29 | 85,29% |
| Average age of submitted candidates | |||
| Specification | Average age | Average age of women | Average age of men |
| Average age of candidates submitted for the province council | 38 | 46 | 37 |
| Average age of candidates submitted for county councils | - | - | - |
| Average age of candidates for councils of cities holding county rights | - | - | - |
| Average age of candidates submitted for communal councils | - | - | - |
| Average age of candidates for reeve, mayor, president | - | - | - |
| Totalling | 38 | 46 | 37 |
| Submitted candidates for councils grouped by age | |||||
| Age | Number of candidates | Women | Women (%) | Men | Men (%) |
| 18-29 | 14 | 1 | 7,14% | 13 | 92,86% |
| 30-39 | 3 | 1 | 33,33% | 2 | 66,67% |
| 40-59 | 14 | 2 | 14,29% | 12 | 85,71% |
| 60+ | 3 | 1 | 33,33% | 2 | 66,67% |
| Totalling | 34 | 5 | 14,71% | 29 | 85,29% |
| Submitted candidates for reeve, mayor, president grouped by age | |||||
| Age | Number of candidates | Women | Women (%) | Men | Men (%) |
| 25-29 | 0 | 0 | - | 0 | - |
| 30-39 | 0 | 0 | - | 0 | - |
| 40-59 | 0 | 0 | - | 0 | - |
| 60+ | 0 | 0 | - | 0 | - |
| Totalling | 0 | 0 | - | 0 | - |
| The youngest and oldest submitted candidate for councils | ||
| Age | Institution | |
| Youngest | 18 | Sejmik Województwa Lubuskiego |
| Oldest | 65 | Sejmik Województwa Lubuskiego |
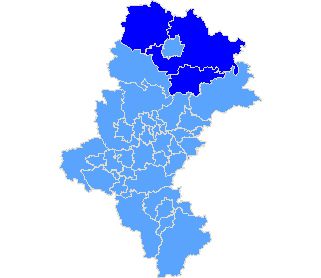
Province łódzkie
| Sejmik Województwa Łódzkiego |
| Submitted candidates | ||||||
| Specification | Number of candidates | Women | Women (%) | Men | Men (%) | Status |
| Constituency no. 1 | 5 | 1 | 20,00% | 4 | 80,00% | Registered |
| Constituency no. 2 | 5 | 0 | 0,00% | 5 | 100,00% | Registered |
| Constituency no. 3 | 6 | 0 | 0,00% | 6 | 100,00% | Registered |
| Constituency no. 4 | 6 | 1 | 16,67% | 5 | 83,33% | Registered |
| Constituency no. 5 | 5 | 1 | 20,00% | 4 | 80,00% | Registered |
| Constituency no. 6 | 6 | 0 | 0,00% | 6 | 100,00% | Registered |
| Totalling | 33 | 3 | 9,09% | 30 | 90,91% | |
| Age of the candidates | |||||
| Specification | Average age | Average age of women | Average age of men | Oldest | Youngest |
| Constituency no. 1 | 41 | 23 | 46 | 62 | 23 |
| Constituency no. 2 | 41 | - | 41 | 53 | 26 |
| Constituency no. 3 | 31 | - | 31 | 37 | 25 |
| Constituency no. 4 | 33 | 38 | 32 | 46 | 18 |
| Constituency no. 5 | 35 | 32 | 36 | 40 | 27 |
| Constituency no. 6 | 33 | - | 33 | 56 | 19 |
| Specification |
| pow. opoczyński |
| The statistics of election committe |
| Lists submitted | ||
| Specification | Number of | |
| lists | councils | |
| Lists submitted for province council | 6 | 1 |
| Lists submitted for county councils | 0 | 0 |
| Lists submitted for councils of cities holding county rights | 0 | 0 |
| Lists registered for communal councils | 1 | 1 |
| Totalling | 7 | 2 |
| Submitted candidates | |||||
| Specification | Number of candidates | Women | Women (%) | Men | Men (%) |
| Number of candidates submitted for the province council | 33 | 3 | 9,09% | 30 | 90,91% |
| Number of candidates submitted for county councils | 0 | 0 | - | 0 | - |
| Number of candidates submitted for councils of cities holding county rights | 0 | 0 | - | 0 | - |
| Number of candidates registered for communal councils | 5 | 2 | 40,00% | 3 | 60,00% |
| Number of candidates submitted for reeve, mayor and presidential elections | 0 | 0 | - | 0 | - |
| Totalling | 38 | 5 | 13,16% | 33 | 86,84% |
| Average age of submitted candidates | |||
| Specification | Average age | Average age of women | Average age of men |
| Average age of candidates submitted for the province council | 35 | 31 | 36 |
| Average age of candidates submitted for county councils | - | - | - |
| Average age of candidates for councils of cities holding county rights | - | - | - |
| Average age of candidates submitted for communal councils | 24 | 24 | 25 |
| Average age of candidates for reeve, mayor, president | - | - | - |
| Totalling | 33 | 28 | 35 |
| Submitted candidates for councils grouped by age | |||||
| Age | Number of candidates | Women | Women (%) | Men | Men (%) |
| 18-29 | 17 | 3 | 17,65% | 14 | 82,35% |
| 30-39 | 10 | 2 | 20,00% | 8 | 80,00% |
| 40-59 | 10 | 0 | 0,00% | 10 | 100,00% |
| 60+ | 1 | 0 | 0,00% | 1 | 100,00% |
| Totalling | 38 | 5 | 13,16% | 33 | 86,84% |
| Submitted candidates for reeve, mayor, president grouped by age | |||||
| Age | Number of candidates | Women | Women (%) | Men | Men (%) |
| 25-29 | 0 | 0 | - | 0 | - |
| 30-39 | 0 | 0 | - | 0 | - |
| 40-59 | 0 | 0 | - | 0 | - |
| 60+ | 0 | 0 | - | 0 | - |
| Totalling | 0 | 0 | - | 0 | - |
| The youngest and oldest submitted candidate for councils | ||
| Age | Institution | |
| Youngest | 18 | Sejmik Województwa Łódzkiego |
| Oldest | 62 | Sejmik Województwa Łódzkiego |
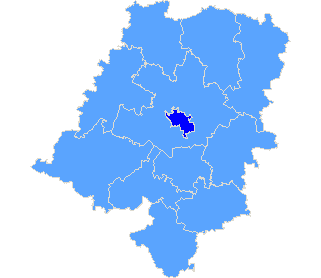
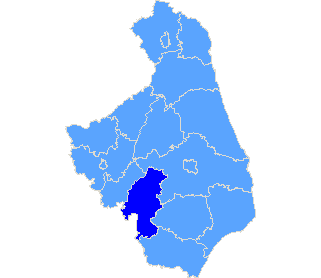
Province małopolskie
| Sejmik Województwa Małopolskiego |
| Submitted candidates | ||||||
| Specification | Number of candidates | Women | Women (%) | Men | Men (%) | Status |
| Constituency no. 1 | 7 | 0 | 0,00% | 7 | 100,00% | Registered |
| Constituency no. 2 | 10 | 3 | 30,00% | 7 | 70,00% | Registered |
| Constituency no. 3 | 11 | 1 | 9,09% | 10 | 90,91% | Registered |
| Constituency no. 4 | 10 | 2 | 20,00% | 8 | 80,00% | Registered |
| Constituency no. 5 | 8 | 2 | 25,00% | 6 | 75,00% | Registered |
| Constituency no. 6 | 9 | 1 | 11,11% | 8 | 88,89% | Registered |
| Totalling | 55 | 9 | 16,36% | 46 | 83,64% | |
| Age of the candidates | |||||
| Specification | Average age | Average age of women | Average age of men | Oldest | Youngest |
| Constituency no. 1 | 29 | - | 29 | 47 | 21 |
| Constituency no. 2 | 33 | 28 | 35 | 57 | 19 |
| Constituency no. 3 | 30 | 43 | 29 | 54 | 19 |
| Constituency no. 4 | 41 | 37 | 42 | 75 | 19 |
| Constituency no. 5 | 40 | 66 | 32 | 82 | 20 |
| Constituency no. 6 | 32 | 33 | 32 | 53 | 21 |
| Specification |
| m. Kraków |
| pow. chrzanowski |
| pow. gorlicki |
| pow. myślenicki |
| The statistics of election committe |
| Lists submitted | ||
| Specification | Number of | |
| lists | councils | |
| Lists submitted for province council | 6 | 1 |
| Lists submitted for county councils | 1 | 1 |
| Lists submitted for councils of cities holding county rights | 7 | 1 |
| Lists registered for communal councils | 4 | 4 |
| Totalling | 18 | 7 |
| Submitted candidates | |||||
| Specification | Number of candidates | Women | Women (%) | Men | Men (%) |
| Number of candidates submitted for the province council | 55 | 9 | 16,36% | 46 | 83,64% |
| Number of candidates submitted for county councils | 4 | 0 | 0,00% | 4 | 100,00% |
| Number of candidates submitted for councils of cities holding county rights | 75 | 17 | 22,67% | 58 | 77,33% |
| Number of candidates registered for communal councils | 6 | 0 | 0,00% | 6 | 100,00% |
| Number of candidates submitted for reeve, mayor and presidential elections | 1 | 0 | 0,00% | 1 | 100,00% |
| Totalling | 141 | 26 | 18,44% | 115 | 81,56% |
| Average age of submitted candidates | |||
| Specification | Average age | Average age of women | Average age of men |
| Average age of candidates submitted for the province council | 34 | 41 | 33 |
| Average age of candidates submitted for county councils | 43 | - | 43 |
| Average age of candidates for councils of cities holding county rights | 40 | 44 | 39 |
| Average age of candidates submitted for communal councils | 35 | - | 35 |
| Average age of candidates for reeve, mayor, president | 54 | - | 54 |
| Totalling | 37 | 42 | 36 |
| Submitted candidates for councils grouped by age | |||||
| Age | Number of candidates | Women | Women (%) | Men | Men (%) |
| 18-29 | 54 | 7 | 12,96% | 47 | 87,04% |
| 30-39 | 25 | 4 | 16,00% | 21 | 84,00% |
| 40-59 | 53 | 12 | 22,64% | 41 | 77,36% |
| 60+ | 8 | 3 | 37,50% | 5 | 62,50% |
| Totalling | 140 | 26 | 18,57% | 114 | 81,43% |
| Submitted candidates for reeve, mayor, president grouped by age | |||||
| Age | Number of candidates | Women | Women (%) | Men | Men (%) |
| 25-29 | 0 | 0 | - | 0 | - |
| 30-39 | 0 | 0 | - | 0 | - |
| 40-59 | 1 | 0 | 0,00% | 1 | 100,00% |
| 60+ | 0 | 0 | - | 0 | - |
| Totalling | 1 | 0 | 0,00% | 1 | 100,00% |
| The youngest and oldest submitted candidate for councils | ||
| Age | Institution | |
| Youngest | 19 | Sejmik Województwa Małopolskiego |
| Oldest | 82 | Sejmik Województwa Małopolskiego |
| The youngest and oldest submitted candidate for reeve, mayor, president | ||
| Age | Institution | |
| Youngest | 54 | Prezydent Miasta Krakowa |
| Oldest | 54 | Prezydent Miasta Krakowa |
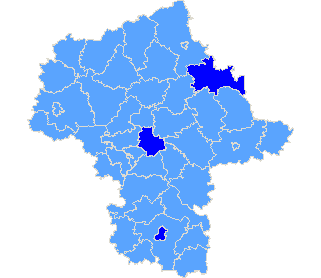
Province mazowieckie
| Sejmik Województwa Mazowieckiego |
| Submitted candidates | ||||||
| Specification | Number of candidates | Women | Women (%) | Men | Men (%) | Status |
| Constituency no. 1 | 6 | 1 | 16,67% | 5 | 83,33% | Registered |
| Constituency no. 2 | 6 | 2 | 33,33% | 4 | 66,67% | Registered |
| Constituency no. 3 | 6 | 4 | 66,67% | 2 | 33,33% | Registered |
| Constituency no. 4 | 9 | 0 | 0,00% | 9 | 100,00% | Registered |
| Constituency no. 5 | 8 | 3 | 37,50% | 5 | 62,50% | Registered |
| Constituency no. 6 | 7 | 2 | 28,57% | 5 | 71,43% | Registered |
| Constituency no. 7 | 6 | 1 | 16,67% | 5 | 83,33% | Registered |
| Totalling | 48 | 13 | 27,08% | 35 | 72,92% | |
| Age of the candidates | |||||
| Specification | Average age | Average age of women | Average age of men | Oldest | Youngest |
| Constituency no. 1 | 48 | 46 | 48 | 71 | 36 |
| Constituency no. 2 | 45 | 57 | 39 | 70 | 22 |
| Constituency no. 3 | 33 | 31 | 37 | 40 | 25 |
| Constituency no. 4 | 36 | - | 36 | 53 | 19 |
| Constituency no. 5 | 34 | 38 | 31 | 64 | 18 |
| Constituency no. 6 | 42 | 68 | 31 | 76 | 18 |
| Constituency no. 7 | 52 | 71 | 49 | 73 | 19 |
| Specification |
| m. Radom |
| m. Warszawa |
| pow. ostrowski |
| The statistics of election committe |
| Lists submitted | ||
| Specification | Number of | |
| lists | councils | |
| Lists submitted for province council | 7 | 1 |
| Lists submitted for county councils | 0 | 0 |
| Lists submitted for councils of cities holding county rights | 14 | 2 |
| Lists submitted for districts councils of the cap. city of Warsaw | 0 | 0 |
| Lists registered for communal councils | 1 | 1 |
| Totalling | 22 | 4 |
| Submitted candidates | |||||
| Specification | Number of candidates | Women | Women (%) | Men | Men (%) |
| Number of candidates submitted for the province council | 48 | 13 | 27,08% | 35 | 72,92% |
| Number of candidates submitted for county councils | 0 | 0 | - | 0 | - |
| Number of candidates submitted for councils of cities holding county rights | 97 | 35 | 36,08% | 62 | 63,92% |
| Number of candidates submitted for districts councils of the cap. city of Warsaw | 0 | 0 | - | 0 | - |
| Number of candidates registered for communal councils | 1 | 0 | 0,00% | 1 | 100,00% |
| Number of candidates submitted for reeve, mayor and presidential elections | 2 | 0 | 0,00% | 2 | 100,00% |
| Totalling | 148 | 48 | 32,43% | 100 | 67,57% |
| Average age of submitted candidates | |||
| Specification | Average age | Average age of women | Average age of men |
| Average age of candidates submitted for the province council | 41 | 46 | 38 |
| Average age of candidates submitted for county councils | - | - | - |
| Average age of candidates for councils of cities holding county rights | 35 | 38 | 34 |
| Average age of candidates for districts councils of the cap. city of Warsaw | - | - | - |
| Average age of candidates submitted for communal councils | 18 | - | 18 |
| Average age of candidates for reeve, mayor, president | 62 | - | 62 |
| Totalling | 37 | 40 | 35 |
| Submitted candidates for councils grouped by age | |||||
| Age | Number of candidates | Women | Women (%) | Men | Men (%) |
| 18-29 | 47 | 12 | 25,53% | 35 | 74,47% |
| 30-39 | 44 | 12 | 27,27% | 32 | 72,73% |
| 40-59 | 44 | 17 | 38,64% | 27 | 61,36% |
| 60+ | 11 | 7 | 63,64% | 4 | 36,36% |
| Totalling | 146 | 48 | 32,88% | 98 | 67,12% |
| Submitted candidates for reeve, mayor, president grouped by age | |||||
| Age | Number of candidates | Women | Women (%) | Men | Men (%) |
| 25-29 | 0 | 0 | - | 0 | - |
| 30-39 | 0 | 0 | - | 0 | - |
| 40-59 | 1 | 0 | 0,00% | 1 | 100,00% |
| 60+ | 1 | 0 | 0,00% | 1 | 100,00% |
| Totalling | 2 | 0 | 0,00% | 2 | 100,00% |
| The youngest and oldest submitted candidate for councils | ||
| Age | Institution | |
| Youngest | 18 | Sejmik Województwa Mazowieckiego |
| Oldest | 81 | Rada Miejska w Radomiu |
| The youngest and oldest submitted candidate for reeve, mayor, president | ||
| Age | Institution | |
| Youngest | 56 | Prezydent Miasta Radomia |
| Oldest | 68 | Prezydent m.st. Warszawy |
Province opolskie
| Specification |
| m. Opole |
| The statistics of election committe |
| Lists submitted | ||
| Specification | Number of | |
| lists | councils | |
| Lists submitted for province council | 0 | 0 |
| Lists submitted for county councils | 0 | 0 |
| Lists submitted for councils of cities holding county rights | 1 | 1 |
| Lists registered for communal councils | 0 | 0 |
| Totalling | 1 | 1 |
| Submitted candidates | |||||
| Specification | Number of candidates | Women | Women (%) | Men | Men (%) |
| Number of candidates submitted for the province council | 0 | 0 | - | 0 | - |
| Number of candidates submitted for county councils | 0 | 0 | - | 0 | - |
| Number of candidates submitted for councils of cities holding county rights | 6 | 2 | 33,33% | 4 | 66,67% |
| Number of candidates registered for communal councils | 0 | 0 | - | 0 | - |
| Number of candidates submitted for reeve, mayor and presidential elections | 0 | 0 | - | 0 | - |
| Totalling | 6 | 2 | 33,33% | 4 | 66,67% |
| Average age of submitted candidates | |||
| Specification | Average age | Average age of women | Average age of men |
| Average age of candidates submitted for the province council | - | - | - |
| Average age of candidates submitted for county councils | - | - | - |
| Average age of candidates for councils of cities holding county rights | 31 | 27 | 34 |
| Average age of candidates submitted for communal councils | - | - | - |
| Average age of candidates for reeve, mayor, president | - | - | - |
| Totalling | 31 | 27 | 34 |
| Submitted candidates for councils grouped by age | |||||
| Age | Number of candidates | Women | Women (%) | Men | Men (%) |
| 18-29 | 3 | 1 | 33,33% | 2 | 66,67% |
| 30-39 | 2 | 1 | 50,00% | 1 | 50,00% |
| 40-59 | 1 | 0 | 0,00% | 1 | 100,00% |
| 60+ | 0 | 0 | - | 0 | - |
| Totalling | 6 | 2 | 33,33% | 4 | 66,67% |
| Submitted candidates for reeve, mayor, president grouped by age | |||||
| Age | Number of candidates | Women | Women (%) | Men | Men (%) |
| 25-29 | 0 | 0 | - | 0 | - |
| 30-39 | 0 | 0 | - | 0 | - |
| 40-59 | 0 | 0 | - | 0 | - |
| 60+ | 0 | 0 | - | 0 | - |
| Totalling | 0 | 0 | - | 0 | - |
| The youngest and oldest submitted candidate for councils | ||
| Age | Institution | |
| Youngest | 20 | Rada Miasta Opola |
| Oldest | 53 | Rada Miasta Opola |
Province podkarpackie
| Sejmik Województwa Podkarpackiego |
| Submitted candidates | ||||||
| Specification | Number of candidates | Women | Women (%) | Men | Men (%) | Status |
| Constituency no. 5 | 6 | 2 | 33,33% | 4 | 66,67% | Registered |
| Totalling | 6 | 2 | 33,33% | 4 | 66,67% | |
| Age of the candidates | |||||
| Specification | Average age | Average age of women | Average age of men | Oldest | Youngest |
| Constituency no. 5 | 30 | 25 | 32 | 51 | 22 |
| Specification |
| pow. leżajski |
| The statistics of election committe |
| Lists submitted | ||
| Specification | Number of | |
| lists | councils | |
| Lists submitted for province council | 1 | 1 |
| Lists submitted for county councils | 0 | 0 |
| Lists submitted for councils of cities holding county rights | 0 | 0 |
| Lists registered for communal councils | 3 | 1 |
| Totalling | 4 | 2 |
| Submitted candidates | |||||
| Specification | Number of candidates | Women | Women (%) | Men | Men (%) |
| Number of candidates submitted for the province council | 6 | 2 | 33,33% | 4 | 66,67% |
| Number of candidates submitted for county councils | 0 | 0 | - | 0 | - |
| Number of candidates submitted for councils of cities holding county rights | 0 | 0 | - | 0 | - |
| Number of candidates registered for communal councils | 4 | 0 | 0,00% | 4 | 100,00% |
| Number of candidates submitted for reeve, mayor and presidential elections | 0 | 0 | - | 0 | - |
| Totalling | 10 | 2 | 20,00% | 8 | 80,00% |
| Average age of submitted candidates | |||
| Specification | Average age | Average age of women | Average age of men |
| Average age of candidates submitted for the province council | 30 | 25 | 32 |
| Average age of candidates submitted for county councils | - | - | - |
| Average age of candidates for councils of cities holding county rights | - | - | - |
| Average age of candidates submitted for communal councils | 24 | - | 24 |
| Average age of candidates for reeve, mayor, president | - | - | - |
| Totalling | 27 | 25 | 28 |
| Submitted candidates for councils grouped by age | |||||
| Age | Number of candidates | Women | Women (%) | Men | Men (%) |
| 18-29 | 8 | 2 | 25,00% | 6 | 75,00% |
| 30-39 | 1 | 0 | 0,00% | 1 | 100,00% |
| 40-59 | 1 | 0 | 0,00% | 1 | 100,00% |
| 60+ | 0 | 0 | - | 0 | - |
| Totalling | 10 | 2 | 20,00% | 8 | 80,00% |
| Submitted candidates for reeve, mayor, president grouped by age | |||||
| Age | Number of candidates | Women | Women (%) | Men | Men (%) |
| 25-29 | 0 | 0 | - | 0 | - |
| 30-39 | 0 | 0 | - | 0 | - |
| 40-59 | 0 | 0 | - | 0 | - |
| 60+ | 0 | 0 | - | 0 | - |
| Totalling | 0 | 0 | - | 0 | - |
| The youngest and oldest submitted candidate for councils | ||
| Age | Institution | |
| Youngest | 22 | Sejmik Województwa Podkarpackiego |
| Oldest | 51 | Sejmik Województwa Podkarpackiego |
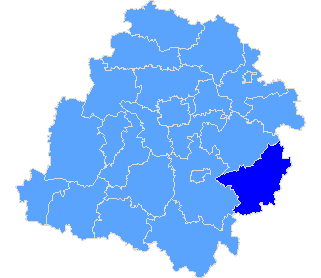
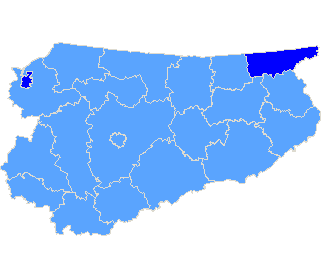
Province podlaskie
| Sejmik Województwa Podlaskiego |
| Submitted candidates | ||||||
| Specification | Number of candidates | Women | Women (%) | Men | Men (%) | Status |
| Constituency no. 1 | 9 | 1 | 11,11% | 8 | 88,89% | Registered |
| Totalling | 9 | 1 | 11,11% | 8 | 88,89% | |
| Age of the candidates | |||||
| Specification | Average age | Average age of women | Average age of men | Oldest | Youngest |
| Constituency no. 1 | 20 | 19 | 21 | 26 | 18 |
| Specification |
| pow. wysokomazowiecki |
| The statistics of election committe |
| Lists submitted | ||
| Specification | Number of | |
| lists | councils | |
| Lists submitted for province council | 1 | 1 |
| Lists submitted for county councils | 0 | 0 |
| Lists submitted for councils of cities holding county rights | 0 | 0 |
| Lists registered for communal councils | 1 | 1 |
| Totalling | 2 | 2 |
| Submitted candidates | |||||
| Specification | Number of candidates | Women | Women (%) | Men | Men (%) |
| Number of candidates submitted for the province council | 9 | 1 | 11,11% | 8 | 88,89% |
| Number of candidates submitted for county councils | 0 | 0 | - | 0 | - |
| Number of candidates submitted for councils of cities holding county rights | 0 | 0 | - | 0 | - |
| Number of candidates registered for communal councils | 1 | 0 | 0,00% | 1 | 100,00% |
| Number of candidates submitted for reeve, mayor and presidential elections | 0 | 0 | - | 0 | - |
| Totalling | 10 | 1 | 10,00% | 9 | 90,00% |
| Average age of submitted candidates | |||
| Specification | Average age | Average age of women | Average age of men |
| Average age of candidates submitted for the province council | 20 | 19 | 21 |
| Average age of candidates submitted for county councils | - | - | - |
| Average age of candidates for councils of cities holding county rights | - | - | - |
| Average age of candidates submitted for communal councils | 18 | - | 18 |
| Average age of candidates for reeve, mayor, president | - | - | - |
| Totalling | 19 | 19 | 20 |
| Submitted candidates for councils grouped by age | |||||
| Age | Number of candidates | Women | Women (%) | Men | Men (%) |
| 18-29 | 10 | 1 | 10,00% | 9 | 90,00% |
| 30-39 | 0 | 0 | - | 0 | - |
| 40-59 | 0 | 0 | - | 0 | - |
| 60+ | 0 | 0 | - | 0 | - |
| Totalling | 10 | 1 | 10,00% | 9 | 90,00% |
| Submitted candidates for reeve, mayor, president grouped by age | |||||
| Age | Number of candidates | Women | Women (%) | Men | Men (%) |
| 25-29 | 0 | 0 | - | 0 | - |
| 30-39 | 0 | 0 | - | 0 | - |
| 40-59 | 0 | 0 | - | 0 | - |
| 60+ | 0 | 0 | - | 0 | - |
| Totalling | 0 | 0 | - | 0 | - |
| The youngest and oldest submitted candidate for councils | ||
| Age | Institution | |
| Youngest | 18 | Sejmik Województwa Podlaskiego |
| Oldest | 26 | Sejmik Województwa Podlaskiego |
| Sejmik Województwa Pomorskiego |
| Submitted candidates | ||||||
| Specification | Number of candidates | Women | Women (%) | Men | Men (%) | Status |
| Constituency no. 2 | 7 | 0 | 0,00% | 7 | 100,00% | Registered |
| Totalling | 7 | 0 | 0,00% | 7 | 100,00% | |
| Age of the candidates | |||||
| Specification | Average age | Average age of women | Average age of men | Oldest | Youngest |
| Constituency no. 2 | 23 | - | 23 | 41 | 19 |
| Specification |
| The statistics of election committe |
| Lists submitted | ||
| Specification | Number of | |
| lists | councils | |
| Lists submitted for province council | 1 | 1 |
| Lists submitted for county councils | 0 | 0 |
| Lists submitted for councils of cities holding county rights | 0 | 0 |
| Lists registered for communal councils | 0 | 0 |
| Totalling | 1 | 1 |
| Submitted candidates | |||||
| Specification | Number of candidates | Women | Women (%) | Men | Men (%) |
| Number of candidates submitted for the province council | 7 | 0 | 0,00% | 7 | 100,00% |
| Number of candidates submitted for county councils | 0 | 0 | - | 0 | - |
| Number of candidates submitted for councils of cities holding county rights | 0 | 0 | - | 0 | - |
| Number of candidates registered for communal councils | 0 | 0 | - | 0 | - |
| Number of candidates submitted for reeve, mayor and presidential elections | 0 | 0 | - | 0 | - |
| Totalling | 7 | 0 | 0,00% | 7 | 100,00% |
| Average age of submitted candidates | |||
| Specification | Average age | Average age of women | Average age of men |
| Average age of candidates submitted for the province council | 23 | - | 23 |
| Average age of candidates submitted for county councils | - | - | - |
| Average age of candidates for councils of cities holding county rights | - | - | - |
| Average age of candidates submitted for communal councils | - | - | - |
| Average age of candidates for reeve, mayor, president | - | - | - |
| Totalling | 23 | - | 23 |
| Submitted candidates for councils grouped by age | |||||
| Age | Number of candidates | Women | Women (%) | Men | Men (%) |
| 18-29 | 6 | 0 | 0,00% | 6 | 100,00% |
| 30-39 | 0 | 0 | - | 0 | - |
| 40-59 | 1 | 0 | 0,00% | 1 | 100,00% |
| 60+ | 0 | 0 | - | 0 | - |
| Totalling | 7 | 0 | 0,00% | 7 | 100,00% |
| Submitted candidates for reeve, mayor, president grouped by age | |||||
| Age | Number of candidates | Women | Women (%) | Men | Men (%) |
| 25-29 | 0 | 0 | - | 0 | - |
| 30-39 | 0 | 0 | - | 0 | - |
| 40-59 | 0 | 0 | - | 0 | - |
| 60+ | 0 | 0 | - | 0 | - |
| Totalling | 0 | 0 | - | 0 | - |
| The youngest and oldest submitted candidate for councils | ||
| Age | Institution | |
| Youngest | 19 | Sejmik Województwa Pomorskiego |
| Oldest | 41 | Sejmik Województwa Pomorskiego |
Province śląskie
| Sejmik Województwa Śląskiego |
| Submitted candidates | ||||||
| Specification | Number of candidates | Women | Women (%) | Men | Men (%) | Status |
| Constituency no. 1 | 5 | 0 | 0,00% | 5 | 100,00% | Registered |
| Constituency no. 2 | 5 | 1 | 20,00% | 4 | 80,00% | Registered |
| Constituency no. 3 | 5 | 0 | 0,00% | 5 | 100,00% | Registered |
| Constituency no. 4 | 9 | 1 | 11,11% | 8 | 88,89% | Registered |
| Constituency no. 5 | 6 | 2 | 33,33% | 4 | 66,67% | Registered |
| Constituency no. 6 | 12 | 1 | 8,33% | 11 | 91,67% | Registered |
| Constituency no. 7 | 6 | 1 | 16,67% | 5 | 83,33% | Registered |
| Totalling | 48 | 6 | 12,50% | 42 | 87,50% | |
| Age of the candidates | |||||
| Specification | Average age | Average age of women | Average age of men | Oldest | Youngest |
| Constituency no. 1 | 36 | - | 36 | 60 | 19 |
| Constituency no. 2 | 35 | 40 | 34 | 46 | 21 |
| Constituency no. 3 | 26 | - | 26 | 31 | 21 |
| Constituency no. 4 | 32 | 19 | 33 | 53 | 19 |
| Constituency no. 5 | 37 | 34 | 39 | 53 | 23 |
| Constituency no. 6 | 31 | 45 | 30 | 59 | 18 |
| Constituency no. 7 | 46 | 52 | 44 | 63 | 20 |
| Specification |
| pow. częstochowski |
| pow. kłobucki |
| pow. myszkowski |
| The statistics of election committe |
| Lists submitted | ||
| Specification | Number of | |
| lists | councils | |
| Lists submitted for province council | 7 | 1 |
| Lists submitted for county councils | 0 | 0 |
| Lists submitted for councils of cities holding county rights | 0 | 0 |
| Lists registered for communal councils | 3 | 3 |
| Totalling | 10 | 4 |
| Submitted candidates | |||||
| Specification | Number of candidates | Women | Women (%) | Men | Men (%) |
| Number of candidates submitted for the province council | 48 | 6 | 12,50% | 42 | 87,50% |
| Number of candidates submitted for county councils | 0 | 0 | - | 0 | - |
| Number of candidates submitted for councils of cities holding county rights | 0 | 0 | - | 0 | - |
| Number of candidates registered for communal councils | 3 | 0 | 0,00% | 3 | 100,00% |
| Number of candidates submitted for reeve, mayor and presidential elections | 0 | 0 | - | 0 | - |
| Totalling | 51 | 6 | 11,76% | 45 | 88,24% |
| Average age of submitted candidates | |||
| Specification | Average age | Average age of women | Average age of men |
| Average age of candidates submitted for the province council | 34 | 37 | 34 |
| Average age of candidates submitted for county councils | - | - | - |
| Average age of candidates for councils of cities holding county rights | - | - | - |
| Average age of candidates submitted for communal councils | 42 | - | 42 |
| Average age of candidates for reeve, mayor, president | - | - | - |
| Totalling | 34 | 37 | 34 |
| Submitted candidates for councils grouped by age | |||||
| Age | Number of candidates | Women | Women (%) | Men | Men (%) |
| 18-29 | 21 | 2 | 9,52% | 19 | 90,48% |
| 30-39 | 13 | 0 | 0,00% | 13 | 100,00% |
| 40-59 | 14 | 4 | 28,57% | 10 | 71,43% |
| 60+ | 3 | 0 | 0,00% | 3 | 100,00% |
| Totalling | 51 | 6 | 11,76% | 45 | 88,24% |
| Submitted candidates for reeve, mayor, president grouped by age | |||||
| Age | Number of candidates | Women | Women (%) | Men | Men (%) |
| 25-29 | 0 | 0 | - | 0 | - |
| 30-39 | 0 | 0 | - | 0 | - |
| 40-59 | 0 | 0 | - | 0 | - |
| 60+ | 0 | 0 | - | 0 | - |
| Totalling | 0 | 0 | - | 0 | - |
| The youngest and oldest submitted candidate for councils | ||
| Age | Institution | |
| Youngest | 18 | Sejmik Województwa Śląskiego |
| Oldest | 63 | Sejmik Województwa Śląskiego |
| Sejmik Województwa Świętokrzyskiego |
| Submitted candidates | ||||||
| Specification | Number of candidates | Women | Women (%) | Men | Men (%) | Status |
| Constituency no. 3 | 15 | 1 | 6,67% | 14 | 93,33% | Registered |
| Totalling | 15 | 1 | 6,67% | 14 | 93,33% | |
| Age of the candidates | |||||
| Specification | Average age | Average age of women | Average age of men | Oldest | Youngest |
| Constituency no. 3 | 34 | 38 | 34 | 61 | 20 |
| Specification |
| The statistics of election committe |
| Lists submitted | ||
| Specification | Number of | |
| lists | councils | |
| Lists submitted for province council | 1 | 1 |
| Lists submitted for county councils | 0 | 0 |
| Lists submitted for councils of cities holding county rights | 0 | 0 |
| Lists registered for communal councils | 0 | 0 |
| Totalling | 1 | 1 |
| Submitted candidates | |||||
| Specification | Number of candidates | Women | Women (%) | Men | Men (%) |
| Number of candidates submitted for the province council | 15 | 1 | 6,67% | 14 | 93,33% |
| Number of candidates submitted for county councils | 0 | 0 | - | 0 | - |
| Number of candidates submitted for councils of cities holding county rights | 0 | 0 | - | 0 | - |
| Number of candidates registered for communal councils | 0 | 0 | - | 0 | - |
| Number of candidates submitted for reeve, mayor and presidential elections | 0 | 0 | - | 0 | - |
| Totalling | 15 | 1 | 6,67% | 14 | 93,33% |
| Average age of submitted candidates | |||
| Specification | Average age | Average age of women | Average age of men |
| Average age of candidates submitted for the province council | 34 | 38 | 34 |
| Average age of candidates submitted for county councils | - | - | - |
| Average age of candidates for councils of cities holding county rights | - | - | - |
| Average age of candidates submitted for communal councils | - | - | - |
| Average age of candidates for reeve, mayor, president | - | - | - |
| Totalling | 34 | 38 | 34 |
| Submitted candidates for councils grouped by age | |||||
| Age | Number of candidates | Women | Women (%) | Men | Men (%) |
| 18-29 | 8 | 0 | 0,00% | 8 | 100,00% |
| 30-39 | 2 | 1 | 50,00% | 1 | 50,00% |
| 40-59 | 4 | 0 | 0,00% | 4 | 100,00% |
| 60+ | 1 | 0 | 0,00% | 1 | 100,00% |
| Totalling | 15 | 1 | 6,67% | 14 | 93,33% |
| Submitted candidates for reeve, mayor, president grouped by age | |||||
| Age | Number of candidates | Women | Women (%) | Men | Men (%) |
| 25-29 | 0 | 0 | - | 0 | - |
| 30-39 | 0 | 0 | - | 0 | - |
| 40-59 | 0 | 0 | - | 0 | - |
| 60+ | 0 | 0 | - | 0 | - |
| Totalling | 0 | 0 | - | 0 | - |
| The youngest and oldest submitted candidate for councils | ||
| Age | Institution | |
| Youngest | 20 | Sejmik Województwa Świętokrzyskiego |
| Oldest | 61 | Sejmik Województwa Świętokrzyskiego |
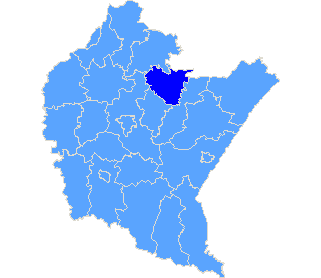
Province warmińsko-mazurskie
| Specification |
| m. Elbląg |
| pow. gołdapski |
| The statistics of election committe |
| Lists submitted | ||
| Specification | Number of | |
| lists | councils | |
| Lists submitted for province council | 0 | 0 |
| Lists submitted for county councils | 0 | 0 |
| Lists submitted for councils of cities holding county rights | 5 | 1 |
| Lists registered for communal councils | 1 | 1 |
| Totalling | 6 | 2 |
| Submitted candidates | |||||
| Specification | Number of candidates | Women | Women (%) | Men | Men (%) |
| Number of candidates submitted for the province council | 0 | 0 | - | 0 | - |
| Number of candidates submitted for county councils | 0 | 0 | - | 0 | - |
| Number of candidates submitted for councils of cities holding county rights | 25 | 11 | 44,00% | 14 | 56,00% |
| Number of candidates registered for communal councils | 7 | 0 | 0,00% | 7 | 100,00% |
| Number of candidates submitted for reeve, mayor and presidential elections | 0 | 0 | - | 0 | - |
| Totalling | 32 | 11 | 34,38% | 21 | 65,62% |
| Average age of submitted candidates | |||
| Specification | Average age | Average age of women | Average age of men |
| Average age of candidates submitted for the province council | - | - | - |
| Average age of candidates submitted for county councils | - | - | - |
| Average age of candidates for councils of cities holding county rights | 39 | 43 | 35 |
| Average age of candidates submitted for communal councils | 19 | - | 19 |
| Average age of candidates for reeve, mayor, president | - | - | - |
| Totalling | 34 | 43 | 29 |
| Submitted candidates for councils grouped by age | |||||
| Age | Number of candidates | Women | Women (%) | Men | Men (%) |
| 18-29 | 16 | 4 | 25,00% | 12 | 75,00% |
| 30-39 | 6 | 2 | 33,33% | 4 | 66,67% |
| 40-59 | 7 | 2 | 28,57% | 5 | 71,43% |
| 60+ | 3 | 3 | 100,00% | 0 | 0,00% |
| Totalling | 32 | 11 | 34,38% | 21 | 65,62% |
| Submitted candidates for reeve, mayor, president grouped by age | |||||
| Age | Number of candidates | Women | Women (%) | Men | Men (%) |
| 25-29 | 0 | 0 | - | 0 | - |
| 30-39 | 0 | 0 | - | 0 | - |
| 40-59 | 0 | 0 | - | 0 | - |
| 60+ | 0 | 0 | - | 0 | - |
| Totalling | 0 | 0 | - | 0 | - |
| The youngest and oldest submitted candidate for councils | ||
| Age | Institution | |
| Youngest | 18 | Rada Miejska w Elblągu |
| Oldest | 85 | Rada Miejska w Elblągu |
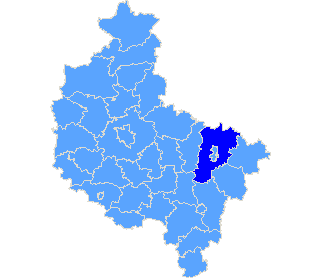
Province wielkopolskie
| Sejmik Województwa Wielkopolskiego |
| Submitted candidates | ||||||
| Specification | Number of candidates | Women | Women (%) | Men | Men (%) | Status |
| Constituency no. 1 | 5 | 0 | 0,00% | 5 | 100,00% | Registered |
| Constituency no. 2 | 5 | 2 | 40,00% | 3 | 60,00% | Registered |
| Constituency no. 4 | 6 | 2 | 33,33% | 4 | 66,67% | Registered |
| Totalling | 16 | 4 | 25,00% | 12 | 75,00% | |
| Age of the candidates | |||||
| Specification | Average age | Average age of women | Average age of men | Oldest | Youngest |
| Constituency no. 1 | 31 | - | 31 | 38 | 25 |
| Constituency no. 2 | 33 | 40 | 29 | 48 | 18 |
| Constituency no. 4 | 47 | 59 | 41 | 64 | 20 |
| Specification |
| pow. koniński |
| The statistics of election committe |
| Lists submitted | ||
| Specification | Number of | |
| lists | councils | |
| Lists submitted for province council | 3 | 1 |
| Lists submitted for county councils | 0 | 0 |
| Lists submitted for councils of cities holding county rights | 0 | 0 |
| Lists registered for communal councils | 1 | 1 |
| Totalling | 4 | 2 |
| Submitted candidates | |||||
| Specification | Number of candidates | Women | Women (%) | Men | Men (%) |
| Number of candidates submitted for the province council | 16 | 4 | 25,00% | 12 | 75,00% |
| Number of candidates submitted for county councils | 0 | 0 | - | 0 | - |
| Number of candidates submitted for councils of cities holding county rights | 0 | 0 | - | 0 | - |
| Number of candidates registered for communal councils | 1 | 0 | 0,00% | 1 | 100,00% |
| Number of candidates submitted for reeve, mayor and presidential elections | 0 | 0 | - | 0 | - |
| Totalling | 17 | 4 | 23,53% | 13 | 76,47% |
| Average age of submitted candidates | |||
| Specification | Average age | Average age of women | Average age of men |
| Average age of candidates submitted for the province council | 38 | 50 | 34 |
| Average age of candidates submitted for county councils | - | - | - |
| Average age of candidates for councils of cities holding county rights | - | - | - |
| Average age of candidates submitted for communal councils | 35 | - | 35 |
| Average age of candidates for reeve, mayor, president | - | - | - |
| Totalling | 37 | 50 | 34 |
| Submitted candidates for councils grouped by age | |||||
| Age | Number of candidates | Women | Women (%) | Men | Men (%) |
| 18-29 | 7 | 0 | 0,00% | 7 | 100,00% |
| 30-39 | 4 | 1 | 25,00% | 3 | 75,00% |
| 40-59 | 4 | 2 | 50,00% | 2 | 50,00% |
| 60+ | 2 | 1 | 50,00% | 1 | 50,00% |
| Totalling | 17 | 4 | 23,53% | 13 | 76,47% |
| Submitted candidates for reeve, mayor, president grouped by age | |||||
| Age | Number of candidates | Women | Women (%) | Men | Men (%) |
| 25-29 | 0 | 0 | - | 0 | - |
| 30-39 | 0 | 0 | - | 0 | - |
| 40-59 | 0 | 0 | - | 0 | - |
| 60+ | 0 | 0 | - | 0 | - |
| Totalling | 0 | 0 | - | 0 | - |
| The youngest and oldest submitted candidate for councils | ||
| Age | Institution | |
| Youngest | 18 | Sejmik Województwa Wielkopolskiego |
| Oldest | 64 | Sejmik Województwa Wielkopolskiego |
