

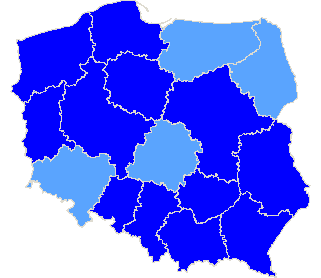
Rzeczpospolita Polska
| The statistics of election committe |
| Lists submitted | ||
| Specification | Number of | |
| lists | councils | |
| Lists submitted for provinces councils | 32 | 7 |
| Lists submitted for county councils | 12 | 4 |
| Lists submitted for councils of cities holding county rights | 14 | 3 |
| Lists submitted for districts councils of the cap. city of Warsaw | 0 | 0 |
| Lists registered for communal councils | 71 | 31 |
| Totalling | 129 | 45 |
| Submitted candidates | |||||
| Specification | Number of candidates | Women | Women (%) | Men | Men (%) |
| Number of candidates submitted for the province council | 284 | 99 | 34,86% | 185 | 65,14% |
| Number of candidates submitted for county councils | 63 | 26 | 41,27% | 37 | 58,73% |
| Number of candidates submitted for councils of cities holding county rights | 97 | 48 | 49,48% | 49 | 50,52% |
| Number of candidates submitted for districts councils of the cap. city of Warsaw | 0 | 0 | - | 0 | - |
| Number of candidates registered for communal councils | 114 | 31 | 27,19% | 83 | 72,81% |
| Number of candidates submitted for reeve, mayor and presidential elections | 4 | 0 | 0,00% | 4 | 100,00% |
| Totalling | 562 | 204 | 36,30% | 358 | 63,70% |
| Average age of submitted candidates | |||
| Specification | Average age | Average age of women | Average age of men |
| Average age of candidates submitted for the province council | 44 | 43 | 44 |
| Average age of candidates submitted for county councils | 45 | 41 | 47 |
| Average age of candidates for councils of cities holding county rights | 43 | 44 | 41 |
| Average age of candidates submitted for communal councils | 42 | 42 | 42 |
| Average age of candidates for reeve, mayor, president | 49 | - | 49 |
| Totalling | 43 | 42 | 43 |
| Submitted candidates for councils grouped by age | |||||
| Age | Number of candidates | Women | Women (%) | Men | Men (%) |
| 18-29 | 118 | 41 | 34,75% | 77 | 65,25% |
| 30-39 | 101 | 42 | 41,58% | 59 | 58,42% |
| 40-59 | 254 | 96 | 37,80% | 158 | 62,20% |
| 60+ | 85 | 25 | 29,41% | 60 | 70,59% |
| Totalling | 558 | 204 | 36,56% | 354 | 63,44% |
| Submitted candidates for reeve, mayor, president grouped by age | |||||
| Age | Number of candidates | Women | Women (%) | Men | Men (%) |
| 25-29 | 1 | 0 | 0,00% | 1 | 100,00% |
| 30-39 | 0 | 0 | - | 0 | - |
| 40-59 | 2 | 0 | 0,00% | 2 | 100,00% |
| 60+ | 1 | 0 | 0,00% | 1 | 100,00% |
| Totalling | 4 | 0 | 0,00% | 4 | 100,00% |
| The youngest and oldest submitted candidate for councils | ||
| Age | Institution | |
| Youngest | 18 | Sejmik Województwa Pomorskiego |
| Oldest | 81 | Sejmik Województwa Mazowieckiego |
| The youngest and oldest submitted candidate for reeve, mayor, president | ||
| Age | Institution | |
| Youngest | 28 | Wójt Gminy Lisewo |
| Oldest | 66 | Burmistrz Miasta Pszczyny |
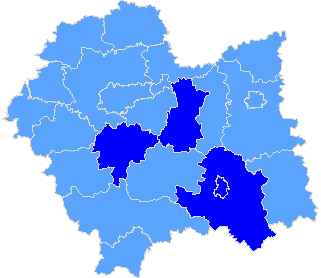
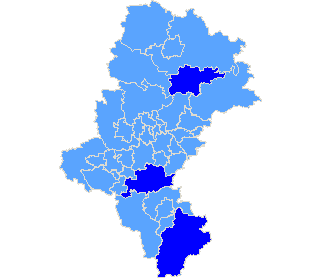
Province kujawsko-pomorskie
| Specification |
| pow. chełmiński |
| The statistics of election committe |
| Lists submitted | ||
| Specification | Number of | |
| lists | councils | |
| Lists submitted for province council | 0 | 0 |
| Lists submitted for county councils | 0 | 0 |
| Lists submitted for councils of cities holding county rights | 0 | 0 |
| Lists registered for communal councils | 4 | 1 |
| Totalling | 4 | 1 |
| Submitted candidates | |||||
| Specification | Number of candidates | Women | Women (%) | Men | Men (%) |
| Number of candidates submitted for the province council | 0 | 0 | - | 0 | - |
| Number of candidates submitted for county councils | 0 | 0 | - | 0 | - |
| Number of candidates submitted for councils of cities holding county rights | 0 | 0 | - | 0 | - |
| Number of candidates registered for communal councils | 5 | 2 | 40,00% | 3 | 60,00% |
| Number of candidates submitted for reeve, mayor and presidential elections | 1 | 0 | 0,00% | 1 | 100,00% |
| Totalling | 6 | 2 | 33,33% | 4 | 66,67% |
| Average age of submitted candidates | |||
| Specification | Average age | Average age of women | Average age of men |
| Average age of candidates submitted for the province council | - | - | - |
| Average age of candidates submitted for county councils | - | - | - |
| Average age of candidates for councils of cities holding county rights | - | - | - |
| Average age of candidates submitted for communal councils | 39 | 33 | 43 |
| Average age of candidates for reeve, mayor, president | 28 | - | 28 |
| Totalling | 37 | 33 | 39 |
| Submitted candidates for councils grouped by age | |||||
| Age | Number of candidates | Women | Women (%) | Men | Men (%) |
| 18-29 | 1 | 1 | 100,00% | 0 | 0,00% |
| 30-39 | 1 | 1 | 100,00% | 0 | 0,00% |
| 40-59 | 3 | 0 | 0,00% | 3 | 100,00% |
| 60+ | 0 | 0 | - | 0 | - |
| Totalling | 5 | 2 | 40,00% | 3 | 60,00% |
| Submitted candidates for reeve, mayor, president grouped by age | |||||
| Age | Number of candidates | Women | Women (%) | Men | Men (%) |
| 25-29 | 1 | 0 | 0,00% | 1 | 100,00% |
| 30-39 | 0 | 0 | - | 0 | - |
| 40-59 | 0 | 0 | - | 0 | - |
| 60+ | 0 | 0 | - | 0 | - |
| Totalling | 1 | 0 | 0,00% | 1 | 100,00% |
| The youngest and oldest submitted candidate for councils | ||
| Age | Institution | |
| Youngest | 27 | Rada Gminy Lisewo |
| Oldest | 44 | Rada Gminy Lisewo |
| The youngest and oldest submitted candidate for reeve, mayor, president | ||
| Age | Institution | |
| Youngest | 28 | Wójt Gminy Lisewo |
| Oldest | 28 | Wójt Gminy Lisewo |
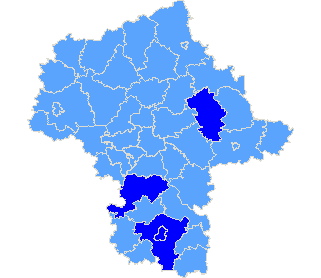
Province lubelskie
| Specification |
| pow. łukowski |
| The statistics of election committe |
| Lists submitted | ||
| Specification | Number of | |
| lists | councils | |
| Lists submitted for province council | 0 | 0 |
| Lists submitted for county councils | 0 | 0 |
| Lists submitted for councils of cities holding county rights | 0 | 0 |
| Lists registered for communal councils | 5 | 2 |
| Totalling | 5 | 2 |
| Submitted candidates | |||||
| Specification | Number of candidates | Women | Women (%) | Men | Men (%) |
| Number of candidates submitted for the province council | 0 | 0 | - | 0 | - |
| Number of candidates submitted for county councils | 0 | 0 | - | 0 | - |
| Number of candidates submitted for councils of cities holding county rights | 0 | 0 | - | 0 | - |
| Number of candidates registered for communal councils | 5 | 3 | 60,00% | 2 | 40,00% |
| Number of candidates submitted for reeve, mayor and presidential elections | 0 | 0 | - | 0 | - |
| Totalling | 5 | 3 | 60,00% | 2 | 40,00% |
| Average age of submitted candidates | |||
| Specification | Average age | Average age of women | Average age of men |
| Average age of candidates submitted for the province council | - | - | - |
| Average age of candidates submitted for county councils | - | - | - |
| Average age of candidates for councils of cities holding county rights | - | - | - |
| Average age of candidates submitted for communal councils | 40 | 34 | 50 |
| Average age of candidates for reeve, mayor, president | - | - | - |
| Totalling | 40 | 34 | 50 |
| Submitted candidates for councils grouped by age | |||||
| Age | Number of candidates | Women | Women (%) | Men | Men (%) |
| 18-29 | 1 | 1 | 100,00% | 0 | 0,00% |
| 30-39 | 1 | 1 | 100,00% | 0 | 0,00% |
| 40-59 | 3 | 1 | 33,33% | 2 | 66,67% |
| 60+ | 0 | 0 | - | 0 | - |
| Totalling | 5 | 3 | 60,00% | 2 | 40,00% |
| Submitted candidates for reeve, mayor, president grouped by age | |||||
| Age | Number of candidates | Women | Women (%) | Men | Men (%) |
| 25-29 | 0 | 0 | - | 0 | - |
| 30-39 | 0 | 0 | - | 0 | - |
| 40-59 | 0 | 0 | - | 0 | - |
| 60+ | 0 | 0 | - | 0 | - |
| Totalling | 0 | 0 | - | 0 | - |
| The youngest and oldest submitted candidate for councils | ||
| Age | Institution | |
| Youngest | 22 | Rada Gminy Adamów |
| Oldest | 51 | Rada Gminy Krzywda |
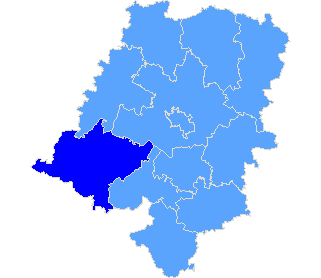
Province lubuskie
| Specification |
| pow. strzelecko-drezdenecki |
| The statistics of election committe |
| Lists submitted | ||
| Specification | Number of | |
| lists | councils | |
| Lists submitted for province council | 0 | 0 |
| Lists submitted for county councils | 0 | 0 |
| Lists submitted for councils of cities holding county rights | 0 | 0 |
| Lists registered for communal councils | 1 | 1 |
| Totalling | 1 | 1 |
| Submitted candidates | |||||
| Specification | Number of candidates | Women | Women (%) | Men | Men (%) |
| Number of candidates submitted for the province council | 0 | 0 | - | 0 | - |
| Number of candidates submitted for county councils | 0 | 0 | - | 0 | - |
| Number of candidates submitted for councils of cities holding county rights | 0 | 0 | - | 0 | - |
| Number of candidates registered for communal councils | 1 | 0 | 0,00% | 1 | 100,00% |
| Number of candidates submitted for reeve, mayor and presidential elections | 0 | 0 | - | 0 | - |
| Totalling | 1 | 0 | 0,00% | 1 | 100,00% |
| Average age of submitted candidates | |||
| Specification | Average age | Average age of women | Average age of men |
| Average age of candidates submitted for the province council | - | - | - |
| Average age of candidates submitted for county councils | - | - | - |
| Average age of candidates for councils of cities holding county rights | - | - | - |
| Average age of candidates submitted for communal councils | 25 | - | 25 |
| Average age of candidates for reeve, mayor, president | - | - | - |
| Totalling | 25 | - | 25 |
| Submitted candidates for councils grouped by age | |||||
| Age | Number of candidates | Women | Women (%) | Men | Men (%) |
| 18-29 | 1 | 0 | 0,00% | 1 | 100,00% |
| 30-39 | 0 | 0 | - | 0 | - |
| 40-59 | 0 | 0 | - | 0 | - |
| 60+ | 0 | 0 | - | 0 | - |
| Totalling | 1 | 0 | 0,00% | 1 | 100,00% |
| Submitted candidates for reeve, mayor, president grouped by age | |||||
| Age | Number of candidates | Women | Women (%) | Men | Men (%) |
| 25-29 | 0 | 0 | - | 0 | - |
| 30-39 | 0 | 0 | - | 0 | - |
| 40-59 | 0 | 0 | - | 0 | - |
| 60+ | 0 | 0 | - | 0 | - |
| Totalling | 0 | 0 | - | 0 | - |
| The youngest and oldest submitted candidate for councils | ||
| Age | Institution | |
| Youngest | 25 | Rada Miejska w Drezdenku |
| Oldest | 25 | Rada Miejska w Drezdenku |
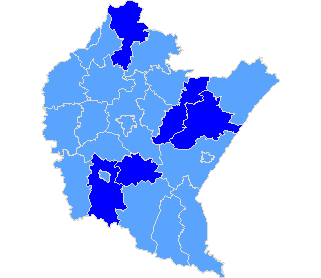
Province małopolskie
| Sejmik Województwa Małopolskiego |
| Submitted candidates | ||||||
| Specification | Number of candidates | Women | Women (%) | Men | Men (%) | Status |
| Constituency no. 1 | 10 | 3 | 30,00% | 7 | 70,00% | Registered |
| Constituency no. 2 | 9 | 4 | 44,44% | 5 | 55,56% | Registered |
| Constituency no. 3 | 12 | 2 | 16,67% | 10 | 83,33% | Registered |
| Constituency no. 4 | 11 | 4 | 36,36% | 7 | 63,64% | Registered |
| Constituency no. 5 | 11 | 2 | 18,18% | 9 | 81,82% | Registered |
| Constituency no. 6 | 9 | 3 | 33,33% | 6 | 66,67% | Registered |
| Totalling | 62 | 18 | 29,03% | 44 | 70,97% | |
| Age of the candidates | |||||
| Specification | Average age | Average age of women | Average age of men | Oldest | Youngest |
| Constituency no. 1 | 50 | 54 | 49 | 74 | 23 |
| Constituency no. 2 | 48 | 57 | 40 | 71 | 26 |
| Constituency no. 3 | 48 | 47 | 48 | 61 | 19 |
| Constituency no. 4 | 50 | 39 | 56 | 67 | 32 |
| Constituency no. 5 | 46 | 62 | 42 | 70 | 19 |
| Constituency no. 6 | 52 | 46 | 54 | 73 | 35 |
| Specification |
| m. Nowy Sącz |
| pow. bocheński |
| pow. myślenicki |
| pow. nowosądecki |
| The statistics of election committe |
| Lists submitted | ||
| Specification | Number of | |
| lists | councils | |
| Lists submitted for province council | 6 | 1 |
| Lists submitted for county councils | 2 | 1 |
| Lists submitted for councils of cities holding county rights | 4 | 1 |
| Lists registered for communal councils | 8 | 5 |
| Totalling | 20 | 8 |
| Submitted candidates | |||||
| Specification | Number of candidates | Women | Women (%) | Men | Men (%) |
| Number of candidates submitted for the province council | 62 | 18 | 29,03% | 44 | 70,97% |
| Number of candidates submitted for county councils | 6 | 2 | 33,33% | 4 | 66,67% |
| Number of candidates submitted for councils of cities holding county rights | 24 | 7 | 29,17% | 17 | 70,83% |
| Number of candidates registered for communal councils | 12 | 3 | 25,00% | 9 | 75,00% |
| Number of candidates submitted for reeve, mayor and presidential elections | 1 | 0 | 0,00% | 1 | 100,00% |
| Totalling | 105 | 30 | 28,57% | 75 | 71,43% |
| Average age of submitted candidates | |||
| Specification | Average age | Average age of women | Average age of men |
| Average age of candidates submitted for the province council | 49 | 50 | 48 |
| Average age of candidates submitted for county councils | 46 | 41 | 49 |
| Average age of candidates for councils of cities holding county rights | 36 | 30 | 38 |
| Average age of candidates submitted for communal councils | 39 | 47 | 37 |
| Average age of candidates for reeve, mayor, president | 56 | - | 56 |
| Totalling | 44 | 44 | 44 |
| Submitted candidates for councils grouped by age | |||||
| Age | Number of candidates | Women | Women (%) | Men | Men (%) |
| 18-29 | 23 | 5 | 21,74% | 18 | 78,26% |
| 30-39 | 21 | 9 | 42,86% | 12 | 57,14% |
| 40-59 | 38 | 9 | 23,68% | 29 | 76,32% |
| 60+ | 22 | 7 | 31,82% | 15 | 68,18% |
| Totalling | 104 | 30 | 28,85% | 74 | 71,15% |
| Submitted candidates for reeve, mayor, president grouped by age | |||||
| Age | Number of candidates | Women | Women (%) | Men | Men (%) |
| 25-29 | 0 | 0 | - | 0 | - |
| 30-39 | 0 | 0 | - | 0 | - |
| 40-59 | 1 | 0 | 0,00% | 1 | 100,00% |
| 60+ | 0 | 0 | - | 0 | - |
| Totalling | 1 | 0 | 0,00% | 1 | 100,00% |
| The youngest and oldest submitted candidate for councils | ||
| Age | Institution | |
| Youngest | 18 | Rada Miasta Nowego Sącza |
| Oldest | 74 | Sejmik Województwa Małopolskiego |
| The youngest and oldest submitted candidate for reeve, mayor, president | ||
| Age | Institution | |
| Youngest | 56 | Prezydent Miasta Nowego Sącza |
| Oldest | 56 | Prezydent Miasta Nowego Sącza |
Province mazowieckie
| Sejmik Województwa Mazowieckiego |
| Submitted candidates | ||||||
| Specification | Number of candidates | Women | Women (%) | Men | Men (%) | Status |
| Constituency no. 1 | 10 | 4 | 40,00% | 6 | 60,00% | Registered |
| Constituency no. 2 | 9 | 1 | 11,11% | 8 | 88,89% | Registered |
| Constituency no. 3 | 9 | 3 | 33,33% | 6 | 66,67% | Registered |
| Constituency no. 4 | 9 | 2 | 22,22% | 7 | 77,78% | Registered |
| Constituency no. 5 | 14 | 6 | 42,86% | 8 | 57,14% | Registered |
| Constituency no. 6 | 11 | 6 | 54,55% | 5 | 45,45% | Registered |
| Constituency no. 7 | 17 | 6 | 35,29% | 11 | 64,71% | Registered |
| Totalling | 79 | 28 | 35,44% | 51 | 64,56% | |
| Age of the candidates | |||||
| Specification | Average age | Average age of women | Average age of men | Oldest | Youngest |
| Constituency no. 1 | 40 | 39 | 40 | 55 | 19 |
| Constituency no. 2 | 45 | 44 | 45 | 79 | 29 |
| Constituency no. 3 | 42 | 39 | 44 | 56 | 25 |
| Constituency no. 4 | 41 | 39 | 41 | 66 | 23 |
| Constituency no. 5 | 51 | 39 | 60 | 81 | 23 |
| Constituency no. 6 | 51 | 57 | 45 | 72 | 21 |
| Constituency no. 7 | 45 | 48 | 43 | 74 | 19 |
| Specification |
| m. Radom |
| pow. grójecki |
| pow. radomski |
| pow. węgrowski |
| The statistics of election committe |
| Lists submitted | ||
| Specification | Number of | |
| lists | councils | |
| Lists submitted for province council | 7 | 1 |
| Lists submitted for county councils | 0 | 0 |
| Lists submitted for councils of cities holding county rights | 5 | 1 |
| Lists submitted for districts councils of the cap. city of Warsaw | 0 | 0 |
| Lists registered for communal councils | 9 | 4 |
| Totalling | 21 | 6 |
| Submitted candidates | |||||
| Specification | Number of candidates | Women | Women (%) | Men | Men (%) |
| Number of candidates submitted for the province council | 79 | 28 | 35,44% | 51 | 64,56% |
| Number of candidates submitted for county councils | 0 | 0 | - | 0 | - |
| Number of candidates submitted for councils of cities holding county rights | 48 | 26 | 54,17% | 22 | 45,83% |
| Number of candidates submitted for districts councils of the cap. city of Warsaw | 0 | 0 | - | 0 | - |
| Number of candidates registered for communal councils | 9 | 5 | 55,56% | 4 | 44,44% |
| Number of candidates submitted for reeve, mayor and presidential elections | 0 | 0 | - | 0 | - |
| Totalling | 136 | 59 | 43,38% | 77 | 56,62% |
| Average age of submitted candidates | |||
| Specification | Average age | Average age of women | Average age of men |
| Average age of candidates submitted for the province council | 45 | 45 | 46 |
| Average age of candidates submitted for county councils | - | - | - |
| Average age of candidates for councils of cities holding county rights | 46 | 48 | 44 |
| Average age of candidates for districts councils of the cap. city of Warsaw | - | - | - |
| Average age of candidates submitted for communal councils | 46 | 50 | 42 |
| Average age of candidates for reeve, mayor, president | - | - | - |
| Totalling | 45 | 46 | 45 |
| Submitted candidates for councils grouped by age | |||||
| Age | Number of candidates | Women | Women (%) | Men | Men (%) |
| 18-29 | 25 | 10 | 40,00% | 15 | 60,00% |
| 30-39 | 22 | 10 | 45,45% | 12 | 54,55% |
| 40-59 | 65 | 28 | 43,08% | 37 | 56,92% |
| 60+ | 24 | 11 | 45,83% | 13 | 54,17% |
| Totalling | 136 | 59 | 43,38% | 77 | 56,62% |
| Submitted candidates for reeve, mayor, president grouped by age | |||||
| Age | Number of candidates | Women | Women (%) | Men | Men (%) |
| 25-29 | 0 | 0 | - | 0 | - |
| 30-39 | 0 | 0 | - | 0 | - |
| 40-59 | 0 | 0 | - | 0 | - |
| 60+ | 0 | 0 | - | 0 | - |
| Totalling | 0 | 0 | - | 0 | - |
| The youngest and oldest submitted candidate for councils | ||
| Age | Institution | |
| Youngest | 19 | Sejmik Województwa Mazowieckiego |
| Oldest | 81 | Sejmik Województwa Mazowieckiego |
Province opolskie
| Specification |
| pow. nyski |
| The statistics of election committe |
| Lists submitted | ||
| Specification | Number of | |
| lists | councils | |
| Lists submitted for province council | 0 | 0 |
| Lists submitted for county councils | 0 | 0 |
| Lists submitted for councils of cities holding county rights | 0 | 0 |
| Lists registered for communal councils | 1 | 1 |
| Totalling | 1 | 1 |
| Submitted candidates | |||||
| Specification | Number of candidates | Women | Women (%) | Men | Men (%) |
| Number of candidates submitted for the province council | 0 | 0 | - | 0 | - |
| Number of candidates submitted for county councils | 0 | 0 | - | 0 | - |
| Number of candidates submitted for councils of cities holding county rights | 0 | 0 | - | 0 | - |
| Number of candidates registered for communal councils | 1 | 0 | 0,00% | 1 | 100,00% |
| Number of candidates submitted for reeve, mayor and presidential elections | 0 | 0 | - | 0 | - |
| Totalling | 1 | 0 | 0,00% | 1 | 100,00% |
| Average age of submitted candidates | |||
| Specification | Average age | Average age of women | Average age of men |
| Average age of candidates submitted for the province council | - | - | - |
| Average age of candidates submitted for county councils | - | - | - |
| Average age of candidates for councils of cities holding county rights | - | - | - |
| Average age of candidates submitted for communal councils | 38 | - | 38 |
| Average age of candidates for reeve, mayor, president | - | - | - |
| Totalling | 38 | - | 38 |
| Submitted candidates for councils grouped by age | |||||
| Age | Number of candidates | Women | Women (%) | Men | Men (%) |
| 18-29 | 0 | 0 | - | 0 | - |
| 30-39 | 1 | 0 | 0,00% | 1 | 100,00% |
| 40-59 | 0 | 0 | - | 0 | - |
| 60+ | 0 | 0 | - | 0 | - |
| Totalling | 1 | 0 | 0,00% | 1 | 100,00% |
| Submitted candidates for reeve, mayor, president grouped by age | |||||
| Age | Number of candidates | Women | Women (%) | Men | Men (%) |
| 25-29 | 0 | 0 | - | 0 | - |
| 30-39 | 0 | 0 | - | 0 | - |
| 40-59 | 0 | 0 | - | 0 | - |
| 60+ | 0 | 0 | - | 0 | - |
| Totalling | 0 | 0 | - | 0 | - |
| The youngest and oldest submitted candidate for councils | ||
| Age | Institution | |
| Youngest | 38 | Rada Miejska w Korfantowie |
| Oldest | 38 | Rada Miejska w Korfantowie |
Province podkarpackie
| Specification |
| pow. brzozowski |
| pow. jarosławski |
| pow. krośnieński |
| pow. przeworski |
| pow. stalowowolski |
| The statistics of election committe |
| Lists submitted | ||
| Specification | Number of | |
| lists | councils | |
| Lists submitted for province council | 0 | 0 |
| Lists submitted for county councils | 4 | 1 |
| Lists submitted for councils of cities holding county rights | 0 | 0 |
| Lists registered for communal councils | 20 | 7 |
| Totalling | 24 | 8 |
| Submitted candidates | |||||
| Specification | Number of candidates | Women | Women (%) | Men | Men (%) |
| Number of candidates submitted for the province council | 0 | 0 | - | 0 | - |
| Number of candidates submitted for county councils | 26 | 13 | 50,00% | 13 | 50,00% |
| Number of candidates submitted for councils of cities holding county rights | 0 | 0 | - | 0 | - |
| Number of candidates registered for communal councils | 43 | 9 | 20,93% | 34 | 79,07% |
| Number of candidates submitted for reeve, mayor and presidential elections | 0 | 0 | - | 0 | - |
| Totalling | 69 | 22 | 31,88% | 47 | 68,12% |
| Average age of submitted candidates | |||
| Specification | Average age | Average age of women | Average age of men |
| Average age of candidates submitted for the province council | - | - | - |
| Average age of candidates submitted for county councils | 46 | 40 | 51 |
| Average age of candidates for councils of cities holding county rights | - | - | - |
| Average age of candidates submitted for communal councils | 44 | 44 | 44 |
| Average age of candidates for reeve, mayor, president | - | - | - |
| Totalling | 44 | 41 | 45 |
| Submitted candidates for councils grouped by age | |||||
| Age | Number of candidates | Women | Women (%) | Men | Men (%) |
| 18-29 | 9 | 3 | 33,33% | 6 | 66,67% |
| 30-39 | 15 | 5 | 33,33% | 10 | 66,67% |
| 40-59 | 38 | 13 | 34,21% | 25 | 65,79% |
| 60+ | 7 | 1 | 14,29% | 6 | 85,71% |
| Totalling | 69 | 22 | 31,88% | 47 | 68,12% |
| Submitted candidates for reeve, mayor, president grouped by age | |||||
| Age | Number of candidates | Women | Women (%) | Men | Men (%) |
| 25-29 | 0 | 0 | - | 0 | - |
| 30-39 | 0 | 0 | - | 0 | - |
| 40-59 | 0 | 0 | - | 0 | - |
| 60+ | 0 | 0 | - | 0 | - |
| Totalling | 0 | 0 | - | 0 | - |
| The youngest and oldest submitted candidate for councils | ||
| Age | Institution | |
| Youngest | 20 | Rada Miejska w Radymnie |
| Oldest | 73 | Rada Powiatu Przeworskiego |
| Sejmik Województwa Pomorskiego |
| Submitted candidates | ||||||
| Specification | Number of candidates | Women | Women (%) | Men | Men (%) | Status |
| Constituency no. 2 | 8 | 4 | 50,00% | 4 | 50,00% | Registered |
| Constituency no. 3 | 6 | 1 | 16,67% | 5 | 83,33% | Registered |
| Totalling | 14 | 5 | 35,71% | 9 | 64,29% | |
| Age of the candidates | |||||
| Specification | Average age | Average age of women | Average age of men | Oldest | Youngest |
| Constituency no. 2 | 44 | 42 | 45 | 73 | 22 |
| Constituency no. 3 | 35 | 42 | 34 | 77 | 18 |
| Specification |
| The statistics of election committe |
| Lists submitted | ||
| Specification | Number of | |
| lists | councils | |
| Lists submitted for province council | 2 | 1 |
| Lists submitted for county councils | 0 | 0 |
| Lists submitted for councils of cities holding county rights | 0 | 0 |
| Lists registered for communal councils | 0 | 0 |
| Totalling | 2 | 1 |
| Submitted candidates | |||||
| Specification | Number of candidates | Women | Women (%) | Men | Men (%) |
| Number of candidates submitted for the province council | 14 | 5 | 35,71% | 9 | 64,29% |
| Number of candidates submitted for county councils | 0 | 0 | - | 0 | - |
| Number of candidates submitted for councils of cities holding county rights | 0 | 0 | - | 0 | - |
| Number of candidates registered for communal councils | 0 | 0 | - | 0 | - |
| Number of candidates submitted for reeve, mayor and presidential elections | 0 | 0 | - | 0 | - |
| Totalling | 14 | 5 | 35,71% | 9 | 64,29% |
| Average age of submitted candidates | |||
| Specification | Average age | Average age of women | Average age of men |
| Average age of candidates submitted for the province council | 40 | 42 | 39 |
| Average age of candidates submitted for county councils | - | - | - |
| Average age of candidates for councils of cities holding county rights | - | - | - |
| Average age of candidates submitted for communal councils | - | - | - |
| Average age of candidates for reeve, mayor, president | - | - | - |
| Totalling | 40 | 42 | 39 |
| Submitted candidates for councils grouped by age | |||||
| Age | Number of candidates | Women | Women (%) | Men | Men (%) |
| 18-29 | 5 | 1 | 20,00% | 4 | 80,00% |
| 30-39 | 2 | 0 | 0,00% | 2 | 100,00% |
| 40-59 | 5 | 4 | 80,00% | 1 | 20,00% |
| 60+ | 2 | 0 | 0,00% | 2 | 100,00% |
| Totalling | 14 | 5 | 35,71% | 9 | 64,29% |
| Submitted candidates for reeve, mayor, president grouped by age | |||||
| Age | Number of candidates | Women | Women (%) | Men | Men (%) |
| 25-29 | 0 | 0 | - | 0 | - |
| 30-39 | 0 | 0 | - | 0 | - |
| 40-59 | 0 | 0 | - | 0 | - |
| 60+ | 0 | 0 | - | 0 | - |
| Totalling | 0 | 0 | - | 0 | - |
| The youngest and oldest submitted candidate for councils | ||
| Age | Institution | |
| Youngest | 18 | Sejmik Województwa Pomorskiego |
| Oldest | 77 | Sejmik Województwa Pomorskiego |
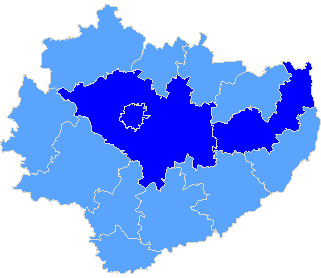
Province śląskie
| Sejmik Województwa Śląskiego |
| Submitted candidates | ||||||
| Specification | Number of candidates | Women | Women (%) | Men | Men (%) | Status |
| Constituency no. 1 | 14 | 4 | 28,57% | 10 | 71,43% | Registered |
| Constituency no. 2 | 11 | 6 | 54,55% | 5 | 45,45% | Registered |
| Constituency no. 3 | 7 | 6 | 85,71% | 1 | 14,29% | Registered |
| Constituency no. 4 | 9 | 2 | 22,22% | 7 | 77,78% | Registered |
| Constituency no. 5 | 7 | 2 | 28,57% | 5 | 71,43% | Registered |
| Constituency no. 6 | 12 | 4 | 33,33% | 8 | 66,67% | Registered |
| Constituency no. 7 | 7 | 3 | 42,86% | 4 | 57,14% | Registered |
| Totalling | 67 | 27 | 40,30% | 40 | 59,70% | |
| Age of the candidates | |||||
| Specification | Average age | Average age of women | Average age of men | Oldest | Youngest |
| Constituency no. 1 | 49 | 47 | 50 | 71 | 21 |
| Constituency no. 2 | 43 | 44 | 43 | 60 | 28 |
| Constituency no. 3 | 43 | 42 | 50 | 63 | 22 |
| Constituency no. 4 | 45 | 50 | 43 | 66 | 19 |
| Constituency no. 5 | 44 | 51 | 41 | 65 | 24 |
| Constituency no. 6 | 39 | 36 | 41 | 62 | 22 |
| Constituency no. 7 | 49 | 47 | 50 | 64 | 30 |
| Specification |
| pow. myszkowski |
| pow. pszczyński |
| pow. żywiecki |
| The statistics of election committe |
| Lists submitted | ||
| Specification | Number of | |
| lists | councils | |
| Lists submitted for province council | 7 | 1 |
| Lists submitted for county councils | 6 | 2 |
| Lists submitted for councils of cities holding county rights | 0 | 0 |
| Lists registered for communal councils | 3 | 1 |
| Totalling | 16 | 4 |
| Submitted candidates | |||||
| Specification | Number of candidates | Women | Women (%) | Men | Men (%) |
| Number of candidates submitted for the province council | 67 | 27 | 40,30% | 40 | 59,70% |
| Number of candidates submitted for county councils | 31 | 11 | 35,48% | 20 | 64,52% |
| Number of candidates submitted for councils of cities holding county rights | 0 | 0 | - | 0 | - |
| Number of candidates registered for communal councils | 17 | 2 | 11,76% | 15 | 88,24% |
| Number of candidates submitted for reeve, mayor and presidential elections | 1 | 0 | 0,00% | 1 | 100,00% |
| Totalling | 116 | 40 | 34,48% | 76 | 65,52% |
| Average age of submitted candidates | |||
| Specification | Average age | Average age of women | Average age of men |
| Average age of candidates submitted for the province council | 45 | 44 | 45 |
| Average age of candidates submitted for county councils | 44 | 43 | 44 |
| Average age of candidates for councils of cities holding county rights | - | - | - |
| Average age of candidates submitted for communal councils | 40 | 40 | 40 |
| Average age of candidates for reeve, mayor, president | 66 | - | 66 |
| Totalling | 44 | 43 | 44 |
| Submitted candidates for councils grouped by age | |||||
| Age | Number of candidates | Women | Women (%) | Men | Men (%) |
| 18-29 | 26 | 5 | 19,23% | 21 | 80,77% |
| 30-39 | 20 | 11 | 55,00% | 9 | 45,00% |
| 40-59 | 50 | 21 | 42,00% | 29 | 58,00% |
| 60+ | 19 | 3 | 15,79% | 16 | 84,21% |
| Totalling | 115 | 40 | 34,78% | 75 | 65,22% |
| Submitted candidates for reeve, mayor, president grouped by age | |||||
| Age | Number of candidates | Women | Women (%) | Men | Men (%) |
| 25-29 | 0 | 0 | - | 0 | - |
| 30-39 | 0 | 0 | - | 0 | - |
| 40-59 | 0 | 0 | - | 0 | - |
| 60+ | 1 | 0 | 0,00% | 1 | 100,00% |
| Totalling | 1 | 0 | 0,00% | 1 | 100,00% |
| The youngest and oldest submitted candidate for councils | ||
| Age | Institution | |
| Youngest | 19 | Sejmik Województwa Śląskiego |
| Oldest | 72 | Rada Powiatu w Żywcu |
| The youngest and oldest submitted candidate for reeve, mayor, president | ||
| Age | Institution | |
| Youngest | 66 | Burmistrz Miasta Pszczyny |
| Oldest | 66 | Burmistrz Miasta Pszczyny |
Province świętokrzyskie
| Sejmik Województwa Świętokrzyskiego |
| Submitted candidates | ||||||
| Specification | Number of candidates | Women | Women (%) | Men | Men (%) | Status |
| Constituency no. 1 | 8 | 3 | 37,50% | 5 | 62,50% | Registered |
| Constituency no. 2 | 6 | 3 | 50,00% | 3 | 50,00% | Registered |
| Constituency no. 3 | 9 | 2 | 22,22% | 7 | 77,78% | Registered |
| Constituency no. 4 | 7 | 4 | 57,14% | 3 | 42,86% | Registered |
| Totalling | 30 | 12 | 40,00% | 18 | 60,00% | |
| Age of the candidates | |||||
| Specification | Average age | Average age of women | Average age of men | Oldest | Youngest |
| Constituency no. 1 | 41 | 39 | 43 | 49 | 25 |
| Constituency no. 2 | 37 | 30 | 44 | 51 | 28 |
| Constituency no. 3 | 48 | 61 | 45 | 67 | 24 |
| Constituency no. 4 | 28 | 28 | 30 | 38 | 19 |
| Specification |
| m. Kielce |
| pow. kielecki |
| pow. opatowski |
| The statistics of election committe |
| Lists submitted | ||
| Specification | Number of | |
| lists | councils | |
| Lists submitted for province council | 4 | 1 |
| Lists submitted for county councils | 0 | 0 |
| Lists submitted for councils of cities holding county rights | 5 | 1 |
| Lists registered for communal councils | 16 | 5 |
| Totalling | 25 | 7 |
| Submitted candidates | |||||
| Specification | Number of candidates | Women | Women (%) | Men | Men (%) |
| Number of candidates submitted for the province council | 30 | 12 | 40,00% | 18 | 60,00% |
| Number of candidates submitted for county councils | 0 | 0 | - | 0 | - |
| Number of candidates submitted for councils of cities holding county rights | 25 | 15 | 60,00% | 10 | 40,00% |
| Number of candidates registered for communal councils | 16 | 6 | 37,50% | 10 | 62,50% |
| Number of candidates submitted for reeve, mayor and presidential elections | 1 | 0 | 0,00% | 1 | 100,00% |
| Totalling | 72 | 33 | 45,83% | 39 | 54,17% |
| Average age of submitted candidates | |||
| Specification | Average age | Average age of women | Average age of men |
| Average age of candidates submitted for the province council | 40 | 36 | 42 |
| Average age of candidates submitted for county councils | - | - | - |
| Average age of candidates for councils of cities holding county rights | 45 | 45 | 44 |
| Average age of candidates submitted for communal councils | 46 | 42 | 48 |
| Average age of candidates for reeve, mayor, president | 47 | - | 47 |
| Totalling | 43 | 41 | 44 |
| Submitted candidates for councils grouped by age | |||||
| Age | Number of candidates | Women | Women (%) | Men | Men (%) |
| 18-29 | 15 | 10 | 66,67% | 5 | 33,33% |
| 30-39 | 11 | 4 | 36,36% | 7 | 63,64% |
| 40-59 | 39 | 17 | 43,59% | 22 | 56,41% |
| 60+ | 6 | 2 | 33,33% | 4 | 66,67% |
| Totalling | 71 | 33 | 46,48% | 38 | 53,52% |
| Submitted candidates for reeve, mayor, president grouped by age | |||||
| Age | Number of candidates | Women | Women (%) | Men | Men (%) |
| 25-29 | 0 | 0 | - | 0 | - |
| 30-39 | 0 | 0 | - | 0 | - |
| 40-59 | 1 | 0 | 0,00% | 1 | 100,00% |
| 60+ | 0 | 0 | - | 0 | - |
| Totalling | 1 | 0 | 0,00% | 1 | 100,00% |
| The youngest and oldest submitted candidate for councils | ||
| Age | Institution | |
| Youngest | 19 | Sejmik Województwa Świętokrzyskiego |
| Oldest | 75 | Rada Gminy Iwaniska |
| The youngest and oldest submitted candidate for reeve, mayor, president | ||
| Age | Institution | |
| Youngest | 47 | Wójt Gminy Raków |
| Oldest | 47 | Wójt Gminy Raków |
| Sejmik Województwa Wielkopolskiego |
| Submitted candidates | ||||||
| Specification | Number of candidates | Women | Women (%) | Men | Men (%) | Status |
| Constituency no. 6 | 6 | 2 | 33,33% | 4 | 66,67% | Registered |
| Totalling | 6 | 2 | 33,33% | 4 | 66,67% | |
| Age of the candidates | |||||
| Specification | Average age | Average age of women | Average age of men | Oldest | Youngest |
| Constituency no. 6 | 28 | 26 | 30 | 32 | 24 |
| Specification |
| The statistics of election committe |
| Lists submitted | ||
| Specification | Number of | |
| lists | councils | |
| Lists submitted for province council | 1 | 1 |
| Lists submitted for county councils | 0 | 0 |
| Lists submitted for councils of cities holding county rights | 0 | 0 |
| Lists registered for communal councils | 0 | 0 |
| Totalling | 1 | 1 |
| Submitted candidates | |||||
| Specification | Number of candidates | Women | Women (%) | Men | Men (%) |
| Number of candidates submitted for the province council | 6 | 2 | 33,33% | 4 | 66,67% |
| Number of candidates submitted for county councils | 0 | 0 | - | 0 | - |
| Number of candidates submitted for councils of cities holding county rights | 0 | 0 | - | 0 | - |
| Number of candidates registered for communal councils | 0 | 0 | - | 0 | - |
| Number of candidates submitted for reeve, mayor and presidential elections | 0 | 0 | - | 0 | - |
| Totalling | 6 | 2 | 33,33% | 4 | 66,67% |
| Average age of submitted candidates | |||
| Specification | Average age | Average age of women | Average age of men |
| Average age of candidates submitted for the province council | 28 | 26 | 30 |
| Average age of candidates submitted for county councils | - | - | - |
| Average age of candidates for councils of cities holding county rights | - | - | - |
| Average age of candidates submitted for communal councils | - | - | - |
| Average age of candidates for reeve, mayor, president | - | - | - |
| Totalling | 28 | 26 | 30 |
| Submitted candidates for councils grouped by age | |||||
| Age | Number of candidates | Women | Women (%) | Men | Men (%) |
| 18-29 | 3 | 2 | 66,67% | 1 | 33,33% |
| 30-39 | 3 | 0 | 0,00% | 3 | 100,00% |
| 40-59 | 0 | 0 | - | 0 | - |
| 60+ | 0 | 0 | - | 0 | - |
| Totalling | 6 | 2 | 33,33% | 4 | 66,67% |
| Submitted candidates for reeve, mayor, president grouped by age | |||||
| Age | Number of candidates | Women | Women (%) | Men | Men (%) |
| 25-29 | 0 | 0 | - | 0 | - |
| 30-39 | 0 | 0 | - | 0 | - |
| 40-59 | 0 | 0 | - | 0 | - |
| 60+ | 0 | 0 | - | 0 | - |
| Totalling | 0 | 0 | - | 0 | - |
| The youngest and oldest submitted candidate for councils | ||
| Age | Institution | |
| Youngest | 24 | Sejmik Województwa Wielkopolskiego |
| Oldest | 32 | Sejmik Województwa Wielkopolskiego |
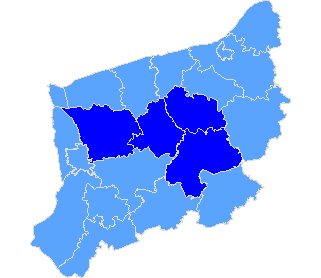
Province zachodniopomorskie
| Sejmik Województwa Zachodniopomorskiego |
| Submitted candidates | ||||||
| Specification | Number of candidates | Women | Women (%) | Men | Men (%) | Status |
| Constituency no. 1 | 6 | 1 | 16,67% | 5 | 83,33% | Registered |
| Constituency no. 2 | 5 | 2 | 40,00% | 3 | 60,00% | Registered |
| Constituency no. 3 | 5 | 2 | 40,00% | 3 | 60,00% | Registered |
| Constituency no. 4 | 5 | 1 | 20,00% | 4 | 80,00% | Registered |
| Constituency no. 5 | 5 | 1 | 20,00% | 4 | 80,00% | Registered |
| Totalling | 26 | 7 | 26,92% | 19 | 73,08% | |
| Age of the candidates | |||||
| Specification | Average age | Average age of women | Average age of men | Oldest | Youngest |
| Constituency no. 1 | 44 | 65 | 40 | 65 | 26 |
| Constituency no. 2 | 44 | 31 | 53 | 60 | 22 |
| Constituency no. 3 | 38 | 37 | 40 | 55 | 22 |
| Constituency no. 4 | 35 | 41 | 34 | 50 | 19 |
| Constituency no. 5 | 46 | 33 | 50 | 61 | 30 |
| Specification |
| pow. drawski |
| pow. goleniowski |
| pow. świdwiński |
| pow. łobeski |
| The statistics of election committe |
| Lists submitted | ||
| Specification | Number of | |
| lists | councils | |
| Lists submitted for province council | 5 | 1 |
| Lists submitted for county councils | 0 | 0 |
| Lists submitted for councils of cities holding county rights | 0 | 0 |
| Lists registered for communal councils | 4 | 4 |
| Totalling | 9 | 5 |
| Submitted candidates | |||||
| Specification | Number of candidates | Women | Women (%) | Men | Men (%) |
| Number of candidates submitted for the province council | 26 | 7 | 26,92% | 19 | 73,08% |
| Number of candidates submitted for county councils | 0 | 0 | - | 0 | - |
| Number of candidates submitted for councils of cities holding county rights | 0 | 0 | - | 0 | - |
| Number of candidates registered for communal councils | 5 | 1 | 20,00% | 4 | 80,00% |
| Number of candidates submitted for reeve, mayor and presidential elections | 0 | 0 | - | 0 | - |
| Totalling | 31 | 8 | 25,81% | 23 | 74,19% |
| Average age of submitted candidates | |||
| Specification | Average age | Average age of women | Average age of men |
| Average age of candidates submitted for the province council | 42 | 39 | 43 |
| Average age of candidates submitted for county councils | - | - | - |
| Average age of candidates for councils of cities holding county rights | - | - | - |
| Average age of candidates submitted for communal councils | 39 | 23 | 43 |
| Average age of candidates for reeve, mayor, president | - | - | - |
| Totalling | 41 | 37 | 43 |
| Submitted candidates for councils grouped by age | |||||
| Age | Number of candidates | Women | Women (%) | Men | Men (%) |
| 18-29 | 9 | 3 | 33,33% | 6 | 66,67% |
| 30-39 | 4 | 1 | 25,00% | 3 | 75,00% |
| 40-59 | 13 | 3 | 23,08% | 10 | 76,92% |
| 60+ | 5 | 1 | 20,00% | 4 | 80,00% |
| Totalling | 31 | 8 | 25,81% | 23 | 74,19% |
| Submitted candidates for reeve, mayor, president grouped by age | |||||
| Age | Number of candidates | Women | Women (%) | Men | Men (%) |
| 25-29 | 0 | 0 | - | 0 | - |
| 30-39 | 0 | 0 | - | 0 | - |
| 40-59 | 0 | 0 | - | 0 | - |
| 60+ | 0 | 0 | - | 0 | - |
| Totalling | 0 | 0 | - | 0 | - |
| The youngest and oldest submitted candidate for councils | ||
| Age | Institution | |
| Youngest | 19 | Sejmik Województwa Zachodniopomorskiego |
| Oldest | 65 | Sejmik Województwa Zachodniopomorskiego |
