

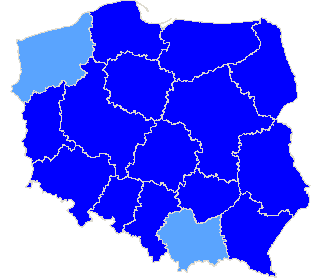
Rzeczpospolita Polska
| The statistics of election committe |
| Lists submitted | ||
| Specification | Number of | |
| lists | councils | |
| Lists submitted for provinces councils | 64 | 13 |
| Lists submitted for county councils | 8 | 3 |
| Lists submitted for councils of cities holding county rights | 13 | 3 |
| Lists submitted for districts councils of the cap. city of Warsaw | 0 | 0 |
| Lists registered for communal councils | 38 | 18 |
| Totalling | 123 | 37 |
| Submitted candidates | |||||
| Specification | Number of candidates | Women | Women (%) | Men | Men (%) |
| Number of candidates submitted for the province council | 591 | 242 | 40,95% | 349 | 59,05% |
| Number of candidates submitted for county councils | 52 | 24 | 46,15% | 28 | 53,85% |
| Number of candidates submitted for councils of cities holding county rights | 85 | 45 | 52,94% | 40 | 47,06% |
| Number of candidates submitted for districts councils of the cap. city of Warsaw | 0 | 0 | - | 0 | - |
| Number of candidates registered for communal councils | 78 | 38 | 48,72% | 40 | 51,28% |
| Number of candidates submitted for reeve, mayor and presidential elections | 3 | 0 | 0,00% | 3 | 100,00% |
| Totalling | 809 | 349 | 43,14% | 460 | 56,86% |
| Average age of submitted candidates | |||
| Specification | Average age | Average age of women | Average age of men |
| Average age of candidates submitted for the province council | 54 | 51 | 55 |
| Average age of candidates submitted for county councils | 46 | 45 | 46 |
| Average age of candidates for councils of cities holding county rights | 54 | 52 | 57 |
| Average age of candidates submitted for communal councils | 47 | 50 | 44 |
| Average age of candidates for reeve, mayor, president | 59 | - | 59 |
| Totalling | 52 | 50 | 53 |
| Submitted candidates for councils grouped by age | |||||
| Age | Number of candidates | Women | Women (%) | Men | Men (%) |
| 18-29 | 98 | 44 | 44,90% | 54 | 55,10% |
| 30-39 | 86 | 46 | 53,49% | 40 | 46,51% |
| 40-59 | 287 | 133 | 46,34% | 154 | 53,66% |
| 60+ | 335 | 126 | 37,61% | 209 | 62,39% |
| Totalling | 806 | 349 | 43,30% | 457 | 56,70% |
| Submitted candidates for reeve, mayor, president grouped by age | |||||
| Age | Number of candidates | Women | Women (%) | Men | Men (%) |
| 25-29 | 0 | 0 | - | 0 | - |
| 30-39 | 0 | 0 | - | 0 | - |
| 40-59 | 2 | 0 | 0,00% | 2 | 100,00% |
| 60+ | 1 | 0 | 0,00% | 1 | 100,00% |
| Totalling | 3 | 0 | 0,00% | 3 | 100,00% |
| The youngest and oldest submitted candidate for councils | ||
| Age | Institution | |
| Youngest | 18 | Sejmik Województwa Świętokrzyskiego |
| Oldest | 87 | Sejmik Województwa Świętokrzyskiego |
| The youngest and oldest submitted candidate for reeve, mayor, president | ||
| Age | Institution | |
| Youngest | 50 | Prezydent Miasta Suwałki |
| Oldest | 70 | Burmistrz Miasta Lubartów |
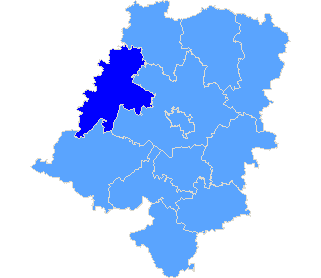
| Sejmik Województwa Dolnośląskiego |
| Submitted candidates | ||||||
| Specification | Number of candidates | Women | Women (%) | Men | Men (%) | Status |
| Constituency no. 1 | 7 | 2 | 28,57% | 5 | 71,43% | Registered |
| Constituency no. 3 | 9 | 4 | 44,44% | 5 | 55,56% | Registered |
| Constituency no. 5 | 6 | 2 | 33,33% | 4 | 66,67% | Registered |
| Totalling | 22 | 8 | 36,36% | 14 | 63,64% | |
| Age of the candidates | |||||
| Specification | Average age | Average age of women | Average age of men | Oldest | Youngest |
| Constituency no. 1 | 24 | 22 | 25 | 26 | 22 |
| Constituency no. 3 | 54 | 55 | 53 | 64 | 26 |
| Constituency no. 5 | 40 | 27 | 47 | 70 | 23 |
| Specification |
| The statistics of election committe |
| Lists submitted | ||
| Specification | Number of | |
| lists | councils | |
| Lists submitted for province council | 3 | 1 |
| Lists submitted for county councils | 0 | 0 |
| Lists submitted for councils of cities holding county rights | 0 | 0 |
| Lists registered for communal councils | 0 | 0 |
| Totalling | 3 | 1 |
| Submitted candidates | |||||
| Specification | Number of candidates | Women | Women (%) | Men | Men (%) |
| Number of candidates submitted for the province council | 22 | 8 | 36,36% | 14 | 63,64% |
| Number of candidates submitted for county councils | 0 | 0 | - | 0 | - |
| Number of candidates submitted for councils of cities holding county rights | 0 | 0 | - | 0 | - |
| Number of candidates registered for communal councils | 0 | 0 | - | 0 | - |
| Number of candidates submitted for reeve, mayor and presidential elections | 0 | 0 | - | 0 | - |
| Totalling | 22 | 8 | 36,36% | 14 | 63,64% |
| Average age of submitted candidates | |||
| Specification | Average age | Average age of women | Average age of men |
| Average age of candidates submitted for the province council | 41 | 40 | 41 |
| Average age of candidates submitted for county councils | - | - | - |
| Average age of candidates for councils of cities holding county rights | - | - | - |
| Average age of candidates submitted for communal councils | - | - | - |
| Average age of candidates for reeve, mayor, president | - | - | - |
| Totalling | 41 | 40 | 41 |
| Submitted candidates for councils grouped by age | |||||
| Age | Number of candidates | Women | Women (%) | Men | Men (%) |
| 18-29 | 9 | 3 | 33,33% | 6 | 66,67% |
| 30-39 | 4 | 2 | 50,00% | 2 | 50,00% |
| 40-59 | 2 | 0 | 0,00% | 2 | 100,00% |
| 60+ | 7 | 3 | 42,86% | 4 | 57,14% |
| Totalling | 22 | 8 | 36,36% | 14 | 63,64% |
| Submitted candidates for reeve, mayor, president grouped by age | |||||
| Age | Number of candidates | Women | Women (%) | Men | Men (%) |
| 25-29 | 0 | 0 | - | 0 | - |
| 30-39 | 0 | 0 | - | 0 | - |
| 40-59 | 0 | 0 | - | 0 | - |
| 60+ | 0 | 0 | - | 0 | - |
| Totalling | 0 | 0 | - | 0 | - |
| The youngest and oldest submitted candidate for councils | ||
| Age | Institution | |
| Youngest | 22 | Sejmik Województwa Dolnośląskiego |
| Oldest | 70 | Sejmik Województwa Dolnośląskiego |
Province kujawsko-pomorskie
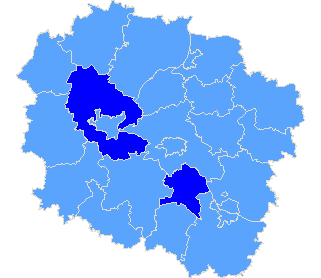
| Sejmik Województwa Kujawsko-Pomorskiego |
| Submitted candidates | ||||||
| Specification | Number of candidates | Women | Women (%) | Men | Men (%) | Status |
| Constituency no. 1 | 9 | 5 | 55,56% | 4 | 44,44% | Registered |
| Constituency no. 2 | 6 | 1 | 16,67% | 5 | 83,33% | Registered |
| Constituency no. 3 | 10 | 3 | 30,00% | 7 | 70,00% | Registered |
| Constituency no. 4 | 8 | 6 | 75,00% | 2 | 25,00% | Registered |
| Constituency no. 5 | 5 | 2 | 40,00% | 3 | 60,00% | Registered |
| Constituency no. 6 | 9 | 3 | 33,33% | 6 | 66,67% | Registered |
| Totalling | 47 | 20 | 42,55% | 27 | 57,45% | |
| Age of the candidates | |||||
| Specification | Average age | Average age of women | Average age of men | Oldest | Youngest |
| Constituency no. 1 | 57 | 52 | 65 | 78 | 40 |
| Constituency no. 2 | 55 | 66 | 53 | 66 | 29 |
| Constituency no. 3 | 62 | 65 | 61 | 81 | 32 |
| Constituency no. 4 | 65 | 65 | 67 | 77 | 53 |
| Constituency no. 5 | 47 | 59 | 39 | 61 | 33 |
| Constituency no. 6 | 69 | 75 | 66 | 80 | 48 |
| Specification |
| pow. aleksandrowski |
| pow. bydgoski |
| The statistics of election committe |
| Lists submitted | ||
| Specification | Number of | |
| lists | councils | |
| Lists submitted for province council | 6 | 1 |
| Lists submitted for county councils | 0 | 0 |
| Lists submitted for councils of cities holding county rights | 0 | 0 |
| Lists registered for communal councils | 6 | 3 |
| Totalling | 12 | 4 |
| Submitted candidates | |||||
| Specification | Number of candidates | Women | Women (%) | Men | Men (%) |
| Number of candidates submitted for the province council | 47 | 20 | 42,55% | 27 | 57,45% |
| Number of candidates submitted for county councils | 0 | 0 | - | 0 | - |
| Number of candidates submitted for councils of cities holding county rights | 0 | 0 | - | 0 | - |
| Number of candidates registered for communal councils | 8 | 5 | 62,50% | 3 | 37,50% |
| Number of candidates submitted for reeve, mayor and presidential elections | 0 | 0 | - | 0 | - |
| Totalling | 55 | 25 | 45,45% | 30 | 54,55% |
| Average age of submitted candidates | |||
| Specification | Average age | Average age of women | Average age of men |
| Average age of candidates submitted for the province council | 61 | 63 | 59 |
| Average age of candidates submitted for county councils | - | - | - |
| Average age of candidates for councils of cities holding county rights | - | - | - |
| Average age of candidates submitted for communal councils | 55 | 59 | 50 |
| Average age of candidates for reeve, mayor, president | - | - | - |
| Totalling | 60 | 62 | 58 |
| Submitted candidates for councils grouped by age | |||||
| Age | Number of candidates | Women | Women (%) | Men | Men (%) |
| 18-29 | 1 | 0 | 0,00% | 1 | 100,00% |
| 30-39 | 3 | 0 | 0,00% | 3 | 100,00% |
| 40-59 | 18 | 9 | 50,00% | 9 | 50,00% |
| 60+ | 33 | 16 | 48,48% | 17 | 51,52% |
| Totalling | 55 | 25 | 45,45% | 30 | 54,55% |
| Submitted candidates for reeve, mayor, president grouped by age | |||||
| Age | Number of candidates | Women | Women (%) | Men | Men (%) |
| 25-29 | 0 | 0 | - | 0 | - |
| 30-39 | 0 | 0 | - | 0 | - |
| 40-59 | 0 | 0 | - | 0 | - |
| 60+ | 0 | 0 | - | 0 | - |
| Totalling | 0 | 0 | - | 0 | - |
| The youngest and oldest submitted candidate for councils | ||
| Age | Institution | |
| Youngest | 29 | Sejmik Województwa Kujawsko-Pomorskiego |
| Oldest | 81 | Sejmik Województwa Kujawsko-Pomorskiego |
Province lubelskie
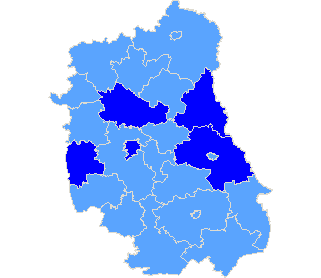
| Sejmik Województwa Lubelskiego |
| Submitted candidates | ||||||
| Specification | Number of candidates | Women | Women (%) | Men | Men (%) | Status |
| Constituency no. 1 | 10 | 3 | 30,00% | 7 | 70,00% | Registered |
| Constituency no. 2 | 14 | 3 | 21,43% | 11 | 78,57% | Registered |
| Constituency no. 3 | 10 | 4 | 40,00% | 6 | 60,00% | Registered |
| Constituency no. 4 | 10 | 1 | 10,00% | 9 | 90,00% | Registered |
| Constituency no. 5 | 9 | 2 | 22,22% | 7 | 77,78% | Registered |
| Totalling | 53 | 13 | 24,53% | 40 | 75,47% | |
| Age of the candidates | |||||
| Specification | Average age | Average age of women | Average age of men | Oldest | Youngest |
| Constituency no. 1 | 54 | 64 | 50 | 67 | 21 |
| Constituency no. 2 | 49 | 38 | 53 | 78 | 21 |
| Constituency no. 3 | 35 | 29 | 40 | 58 | 26 |
| Constituency no. 4 | 58 | 72 | 56 | 72 | 43 |
| Constituency no. 5 | 42 | 56 | 38 | 76 | 22 |
| Specification |
| m. Lublin |
| pow. chełmski |
| pow. lubartowski |
| pow. opolski |
| pow. włodawski |
| The statistics of election committe |
| Lists submitted | ||
| Specification | Number of | |
| lists | councils | |
| Lists submitted for province council | 5 | 1 |
| Lists submitted for county councils | 0 | 0 |
| Lists submitted for councils of cities holding county rights | 5 | 1 |
| Lists registered for communal councils | 20 | 7 |
| Totalling | 30 | 9 |
| Submitted candidates | |||||
| Specification | Number of candidates | Women | Women (%) | Men | Men (%) |
| Number of candidates submitted for the province council | 53 | 13 | 24,53% | 40 | 75,47% |
| Number of candidates submitted for county councils | 0 | 0 | - | 0 | - |
| Number of candidates submitted for councils of cities holding county rights | 31 | 17 | 54,84% | 14 | 45,16% |
| Number of candidates registered for communal councils | 37 | 21 | 56,76% | 16 | 43,24% |
| Number of candidates submitted for reeve, mayor and presidential elections | 2 | 0 | 0,00% | 2 | 100,00% |
| Totalling | 123 | 51 | 41,46% | 72 | 58,54% |
| Average age of submitted candidates | |||
| Specification | Average age | Average age of women | Average age of men |
| Average age of candidates submitted for the province council | 48 | 47 | 48 |
| Average age of candidates submitted for county councils | - | - | - |
| Average age of candidates for councils of cities holding county rights | 60 | 58 | 62 |
| Average age of candidates submitted for communal councils | 49 | 50 | 48 |
| Average age of candidates for reeve, mayor, president | 64 | - | 64 |
| Totalling | 51 | 51 | 51 |
| Submitted candidates for councils grouped by age | |||||
| Age | Number of candidates | Women | Women (%) | Men | Men (%) |
| 18-29 | 11 | 3 | 27,27% | 8 | 72,73% |
| 30-39 | 19 | 10 | 52,63% | 9 | 47,37% |
| 40-59 | 42 | 17 | 40,48% | 25 | 59,52% |
| 60+ | 49 | 21 | 42,86% | 28 | 57,14% |
| Totalling | 121 | 51 | 42,15% | 70 | 57,85% |
| Submitted candidates for reeve, mayor, president grouped by age | |||||
| Age | Number of candidates | Women | Women (%) | Men | Men (%) |
| 25-29 | 0 | 0 | - | 0 | - |
| 30-39 | 0 | 0 | - | 0 | - |
| 40-59 | 1 | 0 | 0,00% | 1 | 100,00% |
| 60+ | 1 | 0 | 0,00% | 1 | 100,00% |
| Totalling | 2 | 0 | 0,00% | 2 | 100,00% |
| The youngest and oldest submitted candidate for councils | ||
| Age | Institution | |
| Youngest | 21 | Sejmik Województwa Lubelskiego |
| Oldest | 79 | Rada Miasta Lublin |
| The youngest and oldest submitted candidate for reeve, mayor, president | ||
| Age | Institution | |
| Youngest | 59 | Wójt Gminy Stary Brus |
| Oldest | 70 | Burmistrz Miasta Lubartów |
Province lubuskie
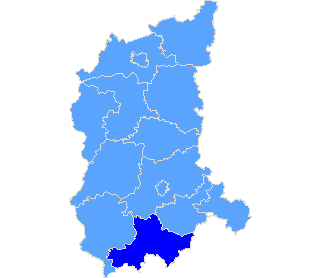
| Sejmik Województwa Lubuskiego |
| Submitted candidates | ||||||
| Specification | Number of candidates | Women | Women (%) | Men | Men (%) | Status |
| Constituency no. 1 | 9 | 2 | 22,22% | 7 | 77,78% | Registered |
| Constituency no. 2 | 10 | 7 | 70,00% | 3 | 30,00% | Registered |
| Constituency no. 3 | 9 | 4 | 44,44% | 5 | 55,56% | Registered |
| Constituency no. 4 | 12 | 7 | 58,33% | 5 | 41,67% | Registered |
| Constituency no. 5 | 11 | 2 | 18,18% | 9 | 81,82% | Registered |
| Totalling | 51 | 22 | 43,14% | 29 | 56,86% | |
| Age of the candidates | |||||
| Specification | Average age | Average age of women | Average age of men | Oldest | Youngest |
| Constituency no. 1 | 62 | 56 | 63 | 73 | 53 |
| Constituency no. 2 | 42 | 35 | 59 | 65 | 19 |
| Constituency no. 3 | 68 | 67 | 69 | 83 | 55 |
| Constituency no. 4 | 53 | 52 | 55 | 67 | 30 |
| Constituency no. 5 | 49 | 53 | 48 | 71 | 32 |
| Specification |
| pow. żagański |
| The statistics of election committe |
| Lists submitted | ||
| Specification | Number of | |
| lists | councils | |
| Lists submitted for province council | 5 | 1 |
| Lists submitted for county councils | 4 | 1 |
| Lists submitted for councils of cities holding county rights | 0 | 0 |
| Lists registered for communal councils | 1 | 1 |
| Totalling | 10 | 3 |
| Submitted candidates | |||||
| Specification | Number of candidates | Women | Women (%) | Men | Men (%) |
| Number of candidates submitted for the province council | 51 | 22 | 43,14% | 29 | 56,86% |
| Number of candidates submitted for county councils | 37 | 19 | 51,35% | 18 | 48,65% |
| Number of candidates submitted for councils of cities holding county rights | 0 | 0 | - | 0 | - |
| Number of candidates registered for communal councils | 1 | 1 | 100,00% | 0 | 0,00% |
| Number of candidates submitted for reeve, mayor and presidential elections | 0 | 0 | - | 0 | - |
| Totalling | 89 | 42 | 47,19% | 47 | 52,81% |
| Average age of submitted candidates | |||
| Specification | Average age | Average age of women | Average age of men |
| Average age of candidates submitted for the province council | 54 | 50 | 58 |
| Average age of candidates submitted for county councils | 47 | 46 | 47 |
| Average age of candidates for councils of cities holding county rights | - | - | - |
| Average age of candidates submitted for communal councils | 52 | 52 | - |
| Average age of candidates for reeve, mayor, president | - | - | - |
| Totalling | 51 | 48 | 53 |
| Submitted candidates for councils grouped by age | |||||
| Age | Number of candidates | Women | Women (%) | Men | Men (%) |
| 18-29 | 7 | 4 | 57,14% | 3 | 42,86% |
| 30-39 | 17 | 9 | 52,94% | 8 | 47,06% |
| 40-59 | 34 | 17 | 50,00% | 17 | 50,00% |
| 60+ | 31 | 12 | 38,71% | 19 | 61,29% |
| Totalling | 89 | 42 | 47,19% | 47 | 52,81% |
| Submitted candidates for reeve, mayor, president grouped by age | |||||
| Age | Number of candidates | Women | Women (%) | Men | Men (%) |
| 25-29 | 0 | 0 | - | 0 | - |
| 30-39 | 0 | 0 | - | 0 | - |
| 40-59 | 0 | 0 | - | 0 | - |
| 60+ | 0 | 0 | - | 0 | - |
| Totalling | 0 | 0 | - | 0 | - |
| The youngest and oldest submitted candidate for councils | ||
| Age | Institution | |
| Youngest | 19 | Sejmik Województwa Lubuskiego |
| Oldest | 83 | Sejmik Województwa Lubuskiego |
Province łódzkie
| Sejmik Województwa Łódzkiego |
| Submitted candidates | ||||||
| Specification | Number of candidates | Women | Women (%) | Men | Men (%) | Status |
| Constituency no. 1 | 10 | 4 | 40,00% | 6 | 60,00% | Registered |
| Constituency no. 2 | 10 | 5 | 50,00% | 5 | 50,00% | Registered |
| Constituency no. 3 | 12 | 2 | 16,67% | 10 | 83,33% | Registered |
| Constituency no. 4 | 14 | 5 | 35,71% | 9 | 64,29% | Registered |
| Constituency no. 5 | 13 | 8 | 61,54% | 5 | 38,46% | Registered |
| Constituency no. 6 | 10 | 6 | 60,00% | 4 | 40,00% | Registered |
| Totalling | 69 | 30 | 43,48% | 39 | 56,52% | |
| Age of the candidates | |||||
| Specification | Average age | Average age of women | Average age of men | Oldest | Youngest |
| Constituency no. 1 | 40 | 48 | 35 | 75 | 24 |
| Constituency no. 2 | 51 | 40 | 61 | 69 | 25 |
| Constituency no. 3 | 51 | 50 | 52 | 77 | 22 |
| Constituency no. 4 | 44 | 34 | 49 | 69 | 19 |
| Constituency no. 5 | 48 | 42 | 59 | 76 | 20 |
| Constituency no. 6 | 39 | 42 | 33 | 77 | 21 |
| Specification |
| pow. zgierski |
| The statistics of election committe |
| Lists submitted | ||
| Specification | Number of | |
| lists | councils | |
| Lists submitted for province council | 6 | 1 |
| Lists submitted for county councils | 1 | 1 |
| Lists submitted for councils of cities holding county rights | 0 | 0 |
| Lists registered for communal councils | 0 | 0 |
| Totalling | 7 | 2 |
| Submitted candidates | |||||
| Specification | Number of candidates | Women | Women (%) | Men | Men (%) |
| Number of candidates submitted for the province council | 69 | 30 | 43,48% | 39 | 56,52% |
| Number of candidates submitted for county councils | 3 | 1 | 33,33% | 2 | 66,67% |
| Number of candidates submitted for councils of cities holding county rights | 0 | 0 | - | 0 | - |
| Number of candidates registered for communal councils | 0 | 0 | - | 0 | - |
| Number of candidates submitted for reeve, mayor and presidential elections | 0 | 0 | - | 0 | - |
| Totalling | 72 | 31 | 43,06% | 41 | 56,94% |
| Average age of submitted candidates | |||
| Specification | Average age | Average age of women | Average age of men |
| Average age of candidates submitted for the province council | 46 | 42 | 49 |
| Average age of candidates submitted for county councils | 58 | 58 | 58 |
| Average age of candidates for councils of cities holding county rights | - | - | - |
| Average age of candidates submitted for communal councils | - | - | - |
| Average age of candidates for reeve, mayor, president | - | - | - |
| Totalling | 46 | 42 | 49 |
| Submitted candidates for councils grouped by age | |||||
| Age | Number of candidates | Women | Women (%) | Men | Men (%) |
| 18-29 | 23 | 12 | 52,17% | 11 | 47,83% |
| 30-39 | 8 | 5 | 62,50% | 3 | 37,50% |
| 40-59 | 25 | 10 | 40,00% | 15 | 60,00% |
| 60+ | 16 | 4 | 25,00% | 12 | 75,00% |
| Totalling | 72 | 31 | 43,06% | 41 | 56,94% |
| Submitted candidates for reeve, mayor, president grouped by age | |||||
| Age | Number of candidates | Women | Women (%) | Men | Men (%) |
| 25-29 | 0 | 0 | - | 0 | - |
| 30-39 | 0 | 0 | - | 0 | - |
| 40-59 | 0 | 0 | - | 0 | - |
| 60+ | 0 | 0 | - | 0 | - |
| Totalling | 0 | 0 | - | 0 | - |
| The youngest and oldest submitted candidate for councils | ||
| Age | Institution | |
| Youngest | 19 | Sejmik Województwa Łódzkiego |
| Oldest | 77 | Sejmik Województwa Łódzkiego |
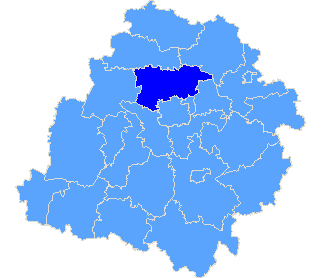
| Sejmik Województwa Mazowieckiego |
| Submitted candidates | ||||||
| Specification | Number of candidates | Women | Women (%) | Men | Men (%) | Status |
| Constituency no. 1 | 9 | 2 | 22,22% | 7 | 77,78% | Registered |
| Constituency no. 2 | 11 | 2 | 18,18% | 9 | 81,82% | Registered |
| Constituency no. 3 | 5 | 1 | 20,00% | 4 | 80,00% | Registered |
| Constituency no. 4 | 5 | 2 | 40,00% | 3 | 60,00% | Registered |
| Constituency no. 5 | 6 | 4 | 66,67% | 2 | 33,33% | Registered |
| Constituency no. 6 | 9 | 4 | 44,44% | 5 | 55,56% | Registered |
| Constituency no. 7 | 6 | 2 | 33,33% | 4 | 66,67% | Registered |
| Totalling | 51 | 17 | 33,33% | 34 | 66,67% | |
| Age of the candidates | |||||
| Specification | Average age | Average age of women | Average age of men | Oldest | Youngest |
| Constituency no. 1 | 65 | 63 | 66 | 77 | 51 |
| Constituency no. 2 | 62 | 62 | 62 | 74 | 38 |
| Constituency no. 3 | 67 | 62 | 69 | 79 | 52 |
| Constituency no. 4 | 66 | 59 | 70 | 76 | 47 |
| Constituency no. 5 | 57 | 56 | 61 | 66 | 39 |
| Constituency no. 6 | 62 | 60 | 63 | 84 | 52 |
| Constituency no. 7 | 62 | 58 | 65 | 74 | 52 |
| Specification |
| The statistics of election committe |
| Lists submitted | ||
| Specification | Number of | |
| lists | councils | |
| Lists submitted for province council | 7 | 1 |
| Lists submitted for county councils | 0 | 0 |
| Lists submitted for councils of cities holding county rights | 0 | 0 |
| Lists submitted for districts councils of the cap. city of Warsaw | 0 | 0 |
| Lists registered for communal councils | 0 | 0 |
| Totalling | 7 | 1 |
| Submitted candidates | |||||
| Specification | Number of candidates | Women | Women (%) | Men | Men (%) |
| Number of candidates submitted for the province council | 51 | 17 | 33,33% | 34 | 66,67% |
| Number of candidates submitted for county councils | 0 | 0 | - | 0 | - |
| Number of candidates submitted for councils of cities holding county rights | 0 | 0 | - | 0 | - |
| Number of candidates submitted for districts councils of the cap. city of Warsaw | 0 | 0 | - | 0 | - |
| Number of candidates registered for communal councils | 0 | 0 | - | 0 | - |
| Number of candidates submitted for reeve, mayor and presidential elections | 0 | 0 | - | 0 | - |
| Totalling | 51 | 17 | 33,33% | 34 | 66,67% |
| Average age of submitted candidates | |||
| Specification | Average age | Average age of women | Average age of men |
| Average age of candidates submitted for the province council | 63 | 59 | 65 |
| Average age of candidates submitted for county councils | - | - | - |
| Average age of candidates for councils of cities holding county rights | - | - | - |
| Average age of candidates for districts councils of the cap. city of Warsaw | - | - | - |
| Average age of candidates submitted for communal councils | - | - | - |
| Average age of candidates for reeve, mayor, president | - | - | - |
| Totalling | 63 | 59 | 65 |
| Submitted candidates for councils grouped by age | |||||
| Age | Number of candidates | Women | Women (%) | Men | Men (%) |
| 18-29 | 0 | 0 | - | 0 | - |
| 30-39 | 2 | 1 | 50,00% | 1 | 50,00% |
| 40-59 | 13 | 7 | 53,85% | 6 | 46,15% |
| 60+ | 36 | 9 | 25,00% | 27 | 75,00% |
| Totalling | 51 | 17 | 33,33% | 34 | 66,67% |
| Submitted candidates for reeve, mayor, president grouped by age | |||||
| Age | Number of candidates | Women | Women (%) | Men | Men (%) |
| 25-29 | 0 | 0 | - | 0 | - |
| 30-39 | 0 | 0 | - | 0 | - |
| 40-59 | 0 | 0 | - | 0 | - |
| 60+ | 0 | 0 | - | 0 | - |
| Totalling | 0 | 0 | - | 0 | - |
| The youngest and oldest submitted candidate for councils | ||
| Age | Institution | |
| Youngest | 38 | Sejmik Województwa Mazowieckiego |
| Oldest | 84 | Sejmik Województwa Mazowieckiego |
Province opolskie
| Specification |
| pow. brzeski |
| The statistics of election committe |
| Lists submitted | ||
| Specification | Number of | |
| lists | councils | |
| Lists submitted for province council | 0 | 0 |
| Lists submitted for county councils | 0 | 0 |
| Lists submitted for councils of cities holding county rights | 0 | 0 |
| Lists registered for communal councils | 1 | 1 |
| Totalling | 1 | 1 |
| Submitted candidates | |||||
| Specification | Number of candidates | Women | Women (%) | Men | Men (%) |
| Number of candidates submitted for the province council | 0 | 0 | - | 0 | - |
| Number of candidates submitted for county councils | 0 | 0 | - | 0 | - |
| Number of candidates submitted for councils of cities holding county rights | 0 | 0 | - | 0 | - |
| Number of candidates registered for communal councils | 1 | 0 | 0,00% | 1 | 100,00% |
| Number of candidates submitted for reeve, mayor and presidential elections | 0 | 0 | - | 0 | - |
| Totalling | 1 | 0 | 0,00% | 1 | 100,00% |
| Average age of submitted candidates | |||
| Specification | Average age | Average age of women | Average age of men |
| Average age of candidates submitted for the province council | - | - | - |
| Average age of candidates submitted for county councils | - | - | - |
| Average age of candidates for councils of cities holding county rights | - | - | - |
| Average age of candidates submitted for communal councils | 59 | - | 59 |
| Average age of candidates for reeve, mayor, president | - | - | - |
| Totalling | 59 | - | 59 |
| Submitted candidates for councils grouped by age | |||||
| Age | Number of candidates | Women | Women (%) | Men | Men (%) |
| 18-29 | 0 | 0 | - | 0 | - |
| 30-39 | 0 | 0 | - | 0 | - |
| 40-59 | 1 | 0 | 0,00% | 1 | 100,00% |
| 60+ | 0 | 0 | - | 0 | - |
| Totalling | 1 | 0 | 0,00% | 1 | 100,00% |
| Submitted candidates for reeve, mayor, president grouped by age | |||||
| Age | Number of candidates | Women | Women (%) | Men | Men (%) |
| 25-29 | 0 | 0 | - | 0 | - |
| 30-39 | 0 | 0 | - | 0 | - |
| 40-59 | 0 | 0 | - | 0 | - |
| 60+ | 0 | 0 | - | 0 | - |
| Totalling | 0 | 0 | - | 0 | - |
| The youngest and oldest submitted candidate for councils | ||
| Age | Institution | |
| Youngest | 59 | Rada Gminy Lubsza |
| Oldest | 59 | Rada Gminy Lubsza |
| Sejmik Województwa Podkarpackiego |
| Submitted candidates | ||||||
| Specification | Number of candidates | Women | Women (%) | Men | Men (%) | Status |
| Constituency no. 1 | 14 | 5 | 35,71% | 9 | 64,29% | Registered |
| Constituency no. 2 | 12 | 6 | 50,00% | 6 | 50,00% | Registered |
| Constituency no. 3 | 12 | 7 | 58,33% | 5 | 41,67% | Registered |
| Constituency no. 4 | 12 | 4 | 33,33% | 8 | 66,67% | Registered |
| Constituency no. 5 | 16 | 9 | 56,25% | 7 | 43,75% | Registered |
| Totalling | 66 | 31 | 46,97% | 35 | 53,03% | |
| Age of the candidates | |||||
| Specification | Average age | Average age of women | Average age of men | Oldest | Youngest |
| Constituency no. 1 | 65 | 63 | 66 | 80 | 57 |
| Constituency no. 2 | 50 | 43 | 56 | 86 | 26 |
| Constituency no. 3 | 52 | 50 | 54 | 70 | 21 |
| Constituency no. 4 | 61 | 55 | 64 | 76 | 25 |
| Constituency no. 5 | 52 | 44 | 63 | 80 | 23 |
| Specification |
| The statistics of election committe |
| Lists submitted | ||
| Specification | Number of | |
| lists | councils | |
| Lists submitted for province council | 5 | 1 |
| Lists submitted for county councils | 0 | 0 |
| Lists submitted for councils of cities holding county rights | 0 | 0 |
| Lists registered for communal councils | 0 | 0 |
| Totalling | 5 | 1 |
| Submitted candidates | |||||
| Specification | Number of candidates | Women | Women (%) | Men | Men (%) |
| Number of candidates submitted for the province council | 66 | 31 | 46,97% | 35 | 53,03% |
| Number of candidates submitted for county councils | 0 | 0 | - | 0 | - |
| Number of candidates submitted for councils of cities holding county rights | 0 | 0 | - | 0 | - |
| Number of candidates registered for communal councils | 0 | 0 | - | 0 | - |
| Number of candidates submitted for reeve, mayor and presidential elections | 0 | 0 | - | 0 | - |
| Totalling | 66 | 31 | 46,97% | 35 | 53,03% |
| Average age of submitted candidates | |||
| Specification | Average age | Average age of women | Average age of men |
| Average age of candidates submitted for the province council | 56 | 49 | 62 |
| Average age of candidates submitted for county councils | - | - | - |
| Average age of candidates for councils of cities holding county rights | - | - | - |
| Average age of candidates submitted for communal councils | - | - | - |
| Average age of candidates for reeve, mayor, president | - | - | - |
| Totalling | 56 | 49 | 62 |
| Submitted candidates for councils grouped by age | |||||
| Age | Number of candidates | Women | Women (%) | Men | Men (%) |
| 18-29 | 7 | 5 | 71,43% | 2 | 28,57% |
| 30-39 | 6 | 5 | 83,33% | 1 | 16,67% |
| 40-59 | 21 | 10 | 47,62% | 11 | 52,38% |
| 60+ | 32 | 11 | 34,38% | 21 | 65,63% |
| Totalling | 66 | 31 | 46,97% | 35 | 53,03% |
| Submitted candidates for reeve, mayor, president grouped by age | |||||
| Age | Number of candidates | Women | Women (%) | Men | Men (%) |
| 25-29 | 0 | 0 | - | 0 | - |
| 30-39 | 0 | 0 | - | 0 | - |
| 40-59 | 0 | 0 | - | 0 | - |
| 60+ | 0 | 0 | - | 0 | - |
| Totalling | 0 | 0 | - | 0 | - |
| The youngest and oldest submitted candidate for councils | ||
| Age | Institution | |
| Youngest | 21 | Sejmik Województwa Podkarpackiego |
| Oldest | 86 | Sejmik Województwa Podkarpackiego |
Province podlaskie
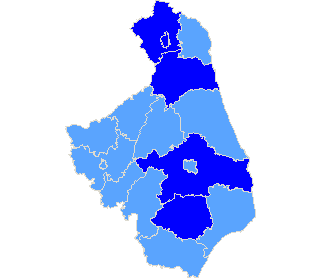
| Sejmik Województwa Podlaskiego |
| Submitted candidates | ||||||
| Specification | Number of candidates | Women | Women (%) | Men | Men (%) | Status |
| Constituency no. 1 | 10 | 2 | 20,00% | 8 | 80,00% | Registered |
| Constituency no. 2 | 10 | 3 | 30,00% | 7 | 70,00% | Registered |
| Constituency no. 3 | 5 | 1 | 20,00% | 4 | 80,00% | Registered |
| Constituency no. 4 | 6 | 2 | 33,33% | 4 | 66,67% | Registered |
| Constituency no. 5 | 8 | 5 | 62,50% | 3 | 37,50% | Registered |
| Totalling | 39 | 13 | 33,33% | 26 | 66,67% | |
| Age of the candidates | |||||
| Specification | Average age | Average age of women | Average age of men | Oldest | Youngest |
| Constituency no. 1 | 60 | 59 | 60 | 73 | 45 |
| Constituency no. 2 | 52 | 51 | 53 | 64 | 30 |
| Constituency no. 3 | 57 | 54 | 58 | 73 | 32 |
| Constituency no. 4 | 43 | 35 | 47 | 64 | 28 |
| Constituency no. 5 | 46 | 44 | 49 | 70 | 24 |
| Specification |
| m. Suwałki |
| pow. augustowski |
| pow. białostocki |
| pow. bielski |
| pow. suwalski |
| The statistics of election committe |
| Lists submitted | ||
| Specification | Number of | |
| lists | councils | |
| Lists submitted for province council | 5 | 1 |
| Lists submitted for county councils | 3 | 1 |
| Lists submitted for councils of cities holding county rights | 4 | 1 |
| Lists registered for communal councils | 7 | 4 |
| Totalling | 19 | 7 |
| Submitted candidates | |||||
| Specification | Number of candidates | Women | Women (%) | Men | Men (%) |
| Number of candidates submitted for the province council | 39 | 13 | 33,33% | 26 | 66,67% |
| Number of candidates submitted for county councils | 12 | 4 | 33,33% | 8 | 66,67% |
| Number of candidates submitted for councils of cities holding county rights | 25 | 12 | 48,00% | 13 | 52,00% |
| Number of candidates registered for communal councils | 20 | 10 | 50,00% | 10 | 50,00% |
| Number of candidates submitted for reeve, mayor and presidential elections | 1 | 0 | 0,00% | 1 | 100,00% |
| Totalling | 97 | 39 | 40,21% | 58 | 59,79% |
| Average age of submitted candidates | |||
| Specification | Average age | Average age of women | Average age of men |
| Average age of candidates submitted for the province council | 52 | 47 | 54 |
| Average age of candidates submitted for county councils | 42 | 38 | 44 |
| Average age of candidates for councils of cities holding county rights | 51 | 53 | 49 |
| Average age of candidates submitted for communal councils | 40 | 46 | 34 |
| Average age of candidates for reeve, mayor, president | 50 | - | 50 |
| Totalling | 48 | 47 | 47 |
| Submitted candidates for councils grouped by age | |||||
| Age | Number of candidates | Women | Women (%) | Men | Men (%) |
| 18-29 | 13 | 5 | 38,46% | 8 | 61,54% |
| 30-39 | 16 | 8 | 50,00% | 8 | 50,00% |
| 40-59 | 45 | 19 | 42,22% | 26 | 57,78% |
| 60+ | 22 | 7 | 31,82% | 15 | 68,18% |
| Totalling | 96 | 39 | 40,62% | 57 | 59,38% |
| Submitted candidates for reeve, mayor, president grouped by age | |||||
| Age | Number of candidates | Women | Women (%) | Men | Men (%) |
| 25-29 | 0 | 0 | - | 0 | - |
| 30-39 | 0 | 0 | - | 0 | - |
| 40-59 | 1 | 0 | 0,00% | 1 | 100,00% |
| 60+ | 0 | 0 | - | 0 | - |
| Totalling | 1 | 0 | 0,00% | 1 | 100,00% |
| The youngest and oldest submitted candidate for councils | ||
| Age | Institution | |
| Youngest | 21 | Rada Powiatu Augustowskiego |
| Oldest | 87 | Rada Miasta Suwałki |
| The youngest and oldest submitted candidate for reeve, mayor, president | ||
| Age | Institution | |
| Youngest | 50 | Prezydent Miasta Suwałki |
| Oldest | 50 | Prezydent Miasta Suwałki |
Province pomorskie
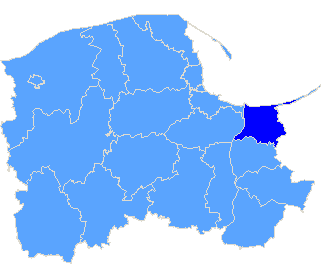
| Sejmik Województwa Pomorskiego |
| Submitted candidates | ||||||
| Specification | Number of candidates | Women | Women (%) | Men | Men (%) | Status |
| Constituency no. 1 | 14 | 8 | 57,14% | 6 | 42,86% | Registered |
| Constituency no. 2 | 15 | 8 | 53,33% | 7 | 46,67% | Registered |
| Constituency no. 3 | 14 | 5 | 35,71% | 9 | 64,29% | Registered |
| Constituency no. 4 | 12 | 6 | 50,00% | 6 | 50,00% | Registered |
| Constituency no. 5 | 9 | 5 | 55,56% | 4 | 44,44% | Registered |
| Totalling | 64 | 32 | 50,00% | 32 | 50,00% | |
| Age of the candidates | |||||
| Specification | Average age | Average age of women | Average age of men | Oldest | Youngest |
| Constituency no. 1 | 53 | 54 | 53 | 72 | 25 |
| Constituency no. 2 | 57 | 57 | 57 | 74 | 45 |
| Constituency no. 3 | 54 | 52 | 55 | 73 | 23 |
| Constituency no. 4 | 58 | 55 | 62 | 73 | 29 |
| Constituency no. 5 | 62 | 62 | 61 | 67 | 50 |
| Specification |
| pow. nowodworski |
| The statistics of election committe |
| Lists submitted | ||
| Specification | Number of | |
| lists | councils | |
| Lists submitted for province council | 5 | 1 |
| Lists submitted for county councils | 0 | 0 |
| Lists submitted for councils of cities holding county rights | 0 | 0 |
| Lists registered for communal councils | 2 | 1 |
| Totalling | 7 | 2 |
| Submitted candidates | |||||
| Specification | Number of candidates | Women | Women (%) | Men | Men (%) |
| Number of candidates submitted for the province council | 64 | 32 | 50,00% | 32 | 50,00% |
| Number of candidates submitted for county councils | 0 | 0 | - | 0 | - |
| Number of candidates submitted for councils of cities holding county rights | 0 | 0 | - | 0 | - |
| Number of candidates registered for communal councils | 10 | 1 | 10,00% | 9 | 90,00% |
| Number of candidates submitted for reeve, mayor and presidential elections | 0 | 0 | - | 0 | - |
| Totalling | 74 | 33 | 44,59% | 41 | 55,41% |
| Average age of submitted candidates | |||
| Specification | Average age | Average age of women | Average age of men |
| Average age of candidates submitted for the province council | 56 | 56 | 57 |
| Average age of candidates submitted for county councils | - | - | - |
| Average age of candidates for councils of cities holding county rights | - | - | - |
| Average age of candidates submitted for communal councils | 45 | 57 | 43 |
| Average age of candidates for reeve, mayor, president | - | - | - |
| Totalling | 54 | 56 | 53 |
| Submitted candidates for councils grouped by age | |||||
| Age | Number of candidates | Women | Women (%) | Men | Men (%) |
| 18-29 | 8 | 3 | 37,50% | 5 | 62,50% |
| 30-39 | 4 | 1 | 25,00% | 3 | 75,00% |
| 40-59 | 26 | 12 | 46,15% | 14 | 53,85% |
| 60+ | 36 | 17 | 47,22% | 19 | 52,78% |
| Totalling | 74 | 33 | 44,59% | 41 | 55,41% |
| Submitted candidates for reeve, mayor, president grouped by age | |||||
| Age | Number of candidates | Women | Women (%) | Men | Men (%) |
| 25-29 | 0 | 0 | - | 0 | - |
| 30-39 | 0 | 0 | - | 0 | - |
| 40-59 | 0 | 0 | - | 0 | - |
| 60+ | 0 | 0 | - | 0 | - |
| Totalling | 0 | 0 | - | 0 | - |
| The youngest and oldest submitted candidate for councils | ||
| Age | Institution | |
| Youngest | 23 | Sejmik Województwa Pomorskiego |
| Oldest | 79 | Sejmik Województwa Pomorskiego |
Province śląskie
| Sejmik Województwa Śląskiego |
| Submitted candidates | ||||||
| Specification | Number of candidates | Women | Women (%) | Men | Men (%) | Status |
| Constituency no. 1 | 7 | 3 | 42,86% | 4 | 57,14% | Registered |
| Constituency no. 2 | 11 | 5 | 45,45% | 6 | 54,55% | Registered |
| Constituency no. 3 | 13 | 10 | 76,92% | 3 | 23,08% | Registered |
| Constituency no. 4 | 6 | 4 | 66,67% | 2 | 33,33% | Registered |
| Constituency no. 5 | 8 | 2 | 25,00% | 6 | 75,00% | Registered |
| Constituency no. 6 | 10 | 5 | 50,00% | 5 | 50,00% | Registered |
| Constituency no. 7 | 13 | 7 | 53,85% | 6 | 46,15% | Registered |
| Totalling | 68 | 36 | 52,94% | 32 | 47,06% | |
| Age of the candidates | |||||
| Specification | Average age | Average age of women | Average age of men | Oldest | Youngest |
| Constituency no. 1 | 57 | 62 | 54 | 66 | 34 |
| Constituency no. 2 | 59 | 57 | 61 | 79 | 36 |
| Constituency no. 3 | 50 | 49 | 56 | 66 | 22 |
| Constituency no. 4 | 55 | 50 | 65 | 74 | 23 |
| Constituency no. 5 | 59 | 67 | 57 | 73 | 27 |
| Constituency no. 6 | 62 | 61 | 64 | 76 | 55 |
| Constituency no. 7 | 59 | 61 | 56 | 78 | 20 |
| Specification |
| m. Tychy |
| The statistics of election committe |
| Lists submitted | ||
| Specification | Number of | |
| lists | councils | |
| Lists submitted for province council | 7 | 1 |
| Lists submitted for county councils | 0 | 0 |
| Lists submitted for councils of cities holding county rights | 4 | 1 |
| Lists registered for communal councils | 0 | 0 |
| Totalling | 11 | 2 |
| Submitted candidates | |||||
| Specification | Number of candidates | Women | Women (%) | Men | Men (%) |
| Number of candidates submitted for the province council | 68 | 36 | 52,94% | 32 | 47,06% |
| Number of candidates submitted for county councils | 0 | 0 | - | 0 | - |
| Number of candidates submitted for councils of cities holding county rights | 29 | 16 | 55,17% | 13 | 44,83% |
| Number of candidates registered for communal councils | 0 | 0 | - | 0 | - |
| Number of candidates submitted for reeve, mayor and presidential elections | 0 | 0 | - | 0 | - |
| Totalling | 97 | 52 | 53,61% | 45 | 46,39% |
| Average age of submitted candidates | |||
| Specification | Average age | Average age of women | Average age of men |
| Average age of candidates submitted for the province council | 57 | 56 | 59 |
| Average age of candidates submitted for county councils | - | - | - |
| Average age of candidates for councils of cities holding county rights | 53 | 47 | 60 |
| Average age of candidates submitted for communal councils | - | - | - |
| Average age of candidates for reeve, mayor, president | - | - | - |
| Totalling | 55 | 53 | 59 |
| Submitted candidates for councils grouped by age | |||||
| Age | Number of candidates | Women | Women (%) | Men | Men (%) |
| 18-29 | 8 | 5 | 62,50% | 3 | 37,50% |
| 30-39 | 6 | 5 | 83,33% | 1 | 16,67% |
| 40-59 | 36 | 21 | 58,33% | 15 | 41,67% |
| 60+ | 47 | 21 | 44,68% | 26 | 55,32% |
| Totalling | 97 | 52 | 53,61% | 45 | 46,39% |
| Submitted candidates for reeve, mayor, president grouped by age | |||||
| Age | Number of candidates | Women | Women (%) | Men | Men (%) |
| 25-29 | 0 | 0 | - | 0 | - |
| 30-39 | 0 | 0 | - | 0 | - |
| 40-59 | 0 | 0 | - | 0 | - |
| 60+ | 0 | 0 | - | 0 | - |
| Totalling | 0 | 0 | - | 0 | - |
| The youngest and oldest submitted candidate for councils | ||
| Age | Institution | |
| Youngest | 20 | Sejmik Województwa Śląskiego |
| Oldest | 81 | Rada Miasta Tychy |
| Sejmik Województwa Świętokrzyskiego |
| Submitted candidates | ||||||
| Specification | Number of candidates | Women | Women (%) | Men | Men (%) | Status |
| Constituency no. 1 | 6 | 2 | 33,33% | 4 | 66,67% | Registered |
| Constituency no. 2 | 7 | 4 | 57,14% | 3 | 42,86% | Registered |
| Constituency no. 3 | 8 | 2 | 25,00% | 6 | 75,00% | Registered |
| Constituency no. 4 | 6 | 2 | 33,33% | 4 | 66,67% | Registered |
| Totalling | 27 | 10 | 37,04% | 17 | 62,96% | |
| Age of the candidates | |||||
| Specification | Average age | Average age of women | Average age of men | Oldest | Youngest |
| Constituency no. 1 | 49 | 46 | 50 | 68 | 22 |
| Constituency no. 2 | 55 | 54 | 56 | 75 | 19 |
| Constituency no. 3 | 66 | 59 | 68 | 87 | 49 |
| Constituency no. 4 | 51 | 35 | 59 | 62 | 18 |
| Specification |
| The statistics of election committe |
| Lists submitted | ||
| Specification | Number of | |
| lists | councils | |
| Lists submitted for province council | 4 | 1 |
| Lists submitted for county councils | 0 | 0 |
| Lists submitted for councils of cities holding county rights | 0 | 0 |
| Lists registered for communal councils | 0 | 0 |
| Totalling | 4 | 1 |
| Submitted candidates | |||||
| Specification | Number of candidates | Women | Women (%) | Men | Men (%) |
| Number of candidates submitted for the province council | 27 | 10 | 37,04% | 17 | 62,96% |
| Number of candidates submitted for county councils | 0 | 0 | - | 0 | - |
| Number of candidates submitted for councils of cities holding county rights | 0 | 0 | - | 0 | - |
| Number of candidates registered for communal councils | 0 | 0 | - | 0 | - |
| Number of candidates submitted for reeve, mayor and presidential elections | 0 | 0 | - | 0 | - |
| Totalling | 27 | 10 | 37,04% | 17 | 62,96% |
| Average age of submitted candidates | |||
| Specification | Average age | Average age of women | Average age of men |
| Average age of candidates submitted for the province council | 56 | 49 | 60 |
| Average age of candidates submitted for county councils | - | - | - |
| Average age of candidates for councils of cities holding county rights | - | - | - |
| Average age of candidates submitted for communal councils | - | - | - |
| Average age of candidates for reeve, mayor, president | - | - | - |
| Totalling | 56 | 49 | 60 |
| Submitted candidates for councils grouped by age | |||||
| Age | Number of candidates | Women | Women (%) | Men | Men (%) |
| 18-29 | 4 | 2 | 50,00% | 2 | 50,00% |
| 30-39 | 0 | 0 | - | 0 | - |
| 40-59 | 11 | 5 | 45,45% | 6 | 54,55% |
| 60+ | 12 | 3 | 25,00% | 9 | 75,00% |
| Totalling | 27 | 10 | 37,04% | 17 | 62,96% |
| Submitted candidates for reeve, mayor, president grouped by age | |||||
| Age | Number of candidates | Women | Women (%) | Men | Men (%) |
| 25-29 | 0 | 0 | - | 0 | - |
| 30-39 | 0 | 0 | - | 0 | - |
| 40-59 | 0 | 0 | - | 0 | - |
| 60+ | 0 | 0 | - | 0 | - |
| Totalling | 0 | 0 | - | 0 | - |
| The youngest and oldest submitted candidate for councils | ||
| Age | Institution | |
| Youngest | 18 | Sejmik Województwa Świętokrzyskiego |
| Oldest | 87 | Sejmik Województwa Świętokrzyskiego |
Province warmińsko-mazurskie
| Sejmik Województwa Warmińsko-Mazurskiego |
| Submitted candidates | ||||||
| Specification | Number of candidates | Women | Women (%) | Men | Men (%) | Status |
| Constituency no. 1 | 6 | 4 | 66,67% | 2 | 33,33% | Registered |
| Constituency no. 2 | 6 | 0 | 0,00% | 6 | 100,00% | Registered |
| Constituency no. 5 | 6 | 4 | 66,67% | 2 | 33,33% | Registered |
| Totalling | 18 | 8 | 44,44% | 10 | 55,56% | |
| Age of the candidates | |||||
| Specification | Average age | Average age of women | Average age of men | Oldest | Youngest |
| Constituency no. 1 | 44 | 40 | 53 | 82 | 20 |
| Constituency no. 2 | 68 | - | 68 | 79 | 57 |
| Constituency no. 5 | 45 | 50 | 33 | 59 | 27 |
| Specification |
| pow. nidzicki |
| The statistics of election committe |
| Lists submitted | ||
| Specification | Number of | |
| lists | councils | |
| Lists submitted for province council | 3 | 1 |
| Lists submitted for county councils | 0 | 0 |
| Lists submitted for councils of cities holding county rights | 0 | 0 |
| Lists registered for communal councils | 1 | 1 |
| Totalling | 4 | 2 |
| Submitted candidates | |||||
| Specification | Number of candidates | Women | Women (%) | Men | Men (%) |
| Number of candidates submitted for the province council | 18 | 8 | 44,44% | 10 | 55,56% |
| Number of candidates submitted for county councils | 0 | 0 | - | 0 | - |
| Number of candidates submitted for councils of cities holding county rights | 0 | 0 | - | 0 | - |
| Number of candidates registered for communal councils | 1 | 0 | 0,00% | 1 | 100,00% |
| Number of candidates submitted for reeve, mayor and presidential elections | 0 | 0 | - | 0 | - |
| Totalling | 19 | 8 | 42,11% | 11 | 57,89% |
| Average age of submitted candidates | |||
| Specification | Average age | Average age of women | Average age of men |
| Average age of candidates submitted for the province council | 52 | 45 | 58 |
| Average age of candidates submitted for county councils | - | - | - |
| Average age of candidates for councils of cities holding county rights | - | - | - |
| Average age of candidates submitted for communal councils | 63 | - | 63 |
| Average age of candidates for reeve, mayor, president | - | - | - |
| Totalling | 52 | 45 | 58 |
| Submitted candidates for councils grouped by age | |||||
| Age | Number of candidates | Women | Women (%) | Men | Men (%) |
| 18-29 | 4 | 2 | 50,00% | 2 | 50,00% |
| 30-39 | 1 | 0 | 0,00% | 1 | 100,00% |
| 40-59 | 7 | 6 | 85,71% | 1 | 14,29% |
| 60+ | 7 | 0 | 0,00% | 7 | 100,00% |
| Totalling | 19 | 8 | 42,11% | 11 | 57,89% |
| Submitted candidates for reeve, mayor, president grouped by age | |||||
| Age | Number of candidates | Women | Women (%) | Men | Men (%) |
| 25-29 | 0 | 0 | - | 0 | - |
| 30-39 | 0 | 0 | - | 0 | - |
| 40-59 | 0 | 0 | - | 0 | - |
| 60+ | 0 | 0 | - | 0 | - |
| Totalling | 0 | 0 | - | 0 | - |
| The youngest and oldest submitted candidate for councils | ||
| Age | Institution | |
| Youngest | 20 | Sejmik Województwa Warmińsko-Mazurskiego |
| Oldest | 82 | Sejmik Województwa Warmińsko-Mazurskiego |
| Sejmik Województwa Wielkopolskiego |
| Submitted candidates | ||||||
| Specification | Number of candidates | Women | Women (%) | Men | Men (%) | Status |
| Constituency no. 2 | 5 | 0 | 0,00% | 5 | 100,00% | Registered |
| Constituency no. 3 | 6 | 1 | 16,67% | 5 | 83,33% | Registered |
| Constituency no. 4 | 5 | 1 | 20,00% | 4 | 80,00% | Registered |
| Totalling | 16 | 2 | 12,50% | 14 | 87,50% | |
| Age of the candidates | |||||
| Specification | Average age | Average age of women | Average age of men | Oldest | Youngest |
| Constituency no. 2 | 56 | - | 56 | 72 | 45 |
| Constituency no. 3 | 47 | 63 | 44 | 83 | 23 |
| Constituency no. 4 | 53 | 68 | 50 | 68 | 20 |
| Specification |
| The statistics of election committe |
| Lists submitted | ||
| Specification | Number of | |
| lists | councils | |
| Lists submitted for province council | 3 | 1 |
| Lists submitted for county councils | 0 | 0 |
| Lists submitted for councils of cities holding county rights | 0 | 0 |
| Lists registered for communal councils | 0 | 0 |
| Totalling | 3 | 1 |
| Submitted candidates | |||||
| Specification | Number of candidates | Women | Women (%) | Men | Men (%) |
| Number of candidates submitted for the province council | 16 | 2 | 12,50% | 14 | 87,50% |
| Number of candidates submitted for county councils | 0 | 0 | - | 0 | - |
| Number of candidates submitted for councils of cities holding county rights | 0 | 0 | - | 0 | - |
| Number of candidates registered for communal councils | 0 | 0 | - | 0 | - |
| Number of candidates submitted for reeve, mayor and presidential elections | 0 | 0 | - | 0 | - |
| Totalling | 16 | 2 | 12,50% | 14 | 87,50% |
| Average age of submitted candidates | |||
| Specification | Average age | Average age of women | Average age of men |
| Average age of candidates submitted for the province council | 52 | 66 | 50 |
| Average age of candidates submitted for county councils | - | - | - |
| Average age of candidates for councils of cities holding county rights | - | - | - |
| Average age of candidates submitted for communal councils | - | - | - |
| Average age of candidates for reeve, mayor, president | - | - | - |
| Totalling | 52 | 66 | 50 |
| Submitted candidates for councils grouped by age | |||||
| Age | Number of candidates | Women | Women (%) | Men | Men (%) |
| 18-29 | 3 | 0 | 0,00% | 3 | 100,00% |
| 30-39 | 0 | 0 | - | 0 | - |
| 40-59 | 6 | 0 | 0,00% | 6 | 100,00% |
| 60+ | 7 | 2 | 28,57% | 5 | 71,43% |
| Totalling | 16 | 2 | 12,50% | 14 | 87,50% |
| Submitted candidates for reeve, mayor, president grouped by age | |||||
| Age | Number of candidates | Women | Women (%) | Men | Men (%) |
| 25-29 | 0 | 0 | - | 0 | - |
| 30-39 | 0 | 0 | - | 0 | - |
| 40-59 | 0 | 0 | - | 0 | - |
| 60+ | 0 | 0 | - | 0 | - |
| Totalling | 0 | 0 | - | 0 | - |
| The youngest and oldest submitted candidate for councils | ||
| Age | Institution | |
| Youngest | 20 | Sejmik Województwa Wielkopolskiego |
| Oldest | 83 | Sejmik Województwa Wielkopolskiego |
