

Rzeczpospolita Polska
| The statistics of election committe |
| Lists submitted | ||
| Specification | Number of | |
| lists | councils | |
| Lists submitted for provinces councils | 40 | 11 |
| Lists submitted for county councils | 10 | 2 |
| Lists submitted for councils of cities holding county rights | 0 | 0 |
| Lists submitted for districts councils of the cap. city of Warsaw | 0 | 0 |
| Lists registered for communal councils | 16 | 6 |
| Totalling | 66 | 19 |
| Submitted candidates | |||||
| Specification | Number of candidates | Women | Women (%) | Men | Men (%) |
| Number of candidates submitted for the province council | 285 | 105 | 36,84% | 180 | 63,16% |
| Number of candidates submitted for county councils | 56 | 27 | 48,21% | 29 | 51,79% |
| Number of candidates submitted for councils of cities holding county rights | 0 | 0 | - | 0 | - |
| Number of candidates submitted for districts councils of the cap. city of Warsaw | 0 | 0 | - | 0 | - |
| Number of candidates registered for communal councils | 26 | 14 | 53,85% | 12 | 46,15% |
| Number of candidates submitted for reeve, mayor and presidential elections | 1 | 1 | 100,00% | 0 | 0,00% |
| Totalling | 368 | 147 | 39,95% | 221 | 60,05% |
| Average age of submitted candidates | |||
| Specification | Average age | Average age of women | Average age of men |
| Average age of candidates submitted for the province council | 51 | 50 | 51 |
| Average age of candidates submitted for county councils | 45 | 44 | 47 |
| Average age of candidates for councils of cities holding county rights | - | - | - |
| Average age of candidates submitted for communal councils | 41 | 43 | 40 |
| Average age of candidates for reeve, mayor, president | 52 | 52 | - |
| Totalling | 49 | 48 | 49 |
| Submitted candidates for councils grouped by age | |||||
| Age | Number of candidates | Women | Women (%) | Men | Men (%) |
| 18-29 | 45 | 17 | 37,78% | 28 | 62,22% |
| 30-39 | 61 | 24 | 39,34% | 37 | 60,66% |
| 40-59 | 141 | 66 | 46,81% | 75 | 53,19% |
| 60+ | 120 | 39 | 32,50% | 81 | 67,50% |
| Totalling | 367 | 146 | 39,78% | 221 | 60,22% |
| Submitted candidates for reeve, mayor, president grouped by age | |||||
| Age | Number of candidates | Women | Women (%) | Men | Men (%) |
| 25-29 | 0 | 0 | - | 0 | - |
| 30-39 | 0 | 0 | - | 0 | - |
| 40-59 | 1 | 1 | 100,00% | 0 | 0,00% |
| 60+ | 0 | 0 | - | 0 | - |
| Totalling | 1 | 1 | 100,00% | 0 | 0,00% |
| The youngest and oldest submitted candidate for councils | ||
| Age | Institution | |
| Youngest | 18 | Sejmik Województwa Mazowieckiego |
| Oldest | 83 | Sejmik Województwa Kujawsko-Pomorskiego |
| The youngest and oldest submitted candidate for reeve, mayor, president | ||
| Age | Institution | |
| Youngest | 52 | Wójt Gminy Telatyn |
| Oldest | 52 | Wójt Gminy Telatyn |
| Sejmik Województwa Kujawsko-Pomorskiego |
| Submitted candidates | ||||||
| Specification | Number of candidates | Women | Women (%) | Men | Men (%) | Status |
| Constituency no. 3 | 5 | 1 | 20,00% | 4 | 80,00% | Registered |
| Totalling | 5 | 1 | 20,00% | 4 | 80,00% | |
| Age of the candidates | |||||
| Specification | Average age | Average age of women | Average age of men | Oldest | Youngest |
| Constituency no. 3 | 52 | 56 | 51 | 83 | 32 |
| Specification |
| The statistics of election committe |
| Lists submitted | ||
| Specification | Number of | |
| lists | councils | |
| Lists submitted for province council | 1 | 1 |
| Lists submitted for county councils | 0 | 0 |
| Lists submitted for councils of cities holding county rights | 0 | 0 |
| Lists registered for communal councils | 0 | 0 |
| Totalling | 1 | 1 |
| Submitted candidates | |||||
| Specification | Number of candidates | Women | Women (%) | Men | Men (%) |
| Number of candidates submitted for the province council | 5 | 1 | 20,00% | 4 | 80,00% |
| Number of candidates submitted for county councils | 0 | 0 | - | 0 | - |
| Number of candidates submitted for councils of cities holding county rights | 0 | 0 | - | 0 | - |
| Number of candidates registered for communal councils | 0 | 0 | - | 0 | - |
| Number of candidates submitted for reeve, mayor and presidential elections | 0 | 0 | - | 0 | - |
| Totalling | 5 | 1 | 20,00% | 4 | 80,00% |
| Average age of submitted candidates | |||
| Specification | Average age | Average age of women | Average age of men |
| Average age of candidates submitted for the province council | 52 | 56 | 51 |
| Average age of candidates submitted for county councils | - | - | - |
| Average age of candidates for councils of cities holding county rights | - | - | - |
| Average age of candidates submitted for communal councils | - | - | - |
| Average age of candidates for reeve, mayor, president | - | - | - |
| Totalling | 52 | 56 | 51 |
| Submitted candidates for councils grouped by age | |||||
| Age | Number of candidates | Women | Women (%) | Men | Men (%) |
| 18-29 | 0 | 0 | - | 0 | - |
| 30-39 | 1 | 0 | 0,00% | 1 | 100,00% |
| 40-59 | 3 | 1 | 33,33% | 2 | 66,67% |
| 60+ | 1 | 0 | 0,00% | 1 | 100,00% |
| Totalling | 5 | 1 | 20,00% | 4 | 80,00% |
| Submitted candidates for reeve, mayor, president grouped by age | |||||
| Age | Number of candidates | Women | Women (%) | Men | Men (%) |
| 25-29 | 0 | 0 | - | 0 | - |
| 30-39 | 0 | 0 | - | 0 | - |
| 40-59 | 0 | 0 | - | 0 | - |
| 60+ | 0 | 0 | - | 0 | - |
| Totalling | 0 | 0 | - | 0 | - |
| The youngest and oldest submitted candidate for councils | ||
| Age | Institution | |
| Youngest | 32 | Sejmik Województwa Kujawsko-Pomorskiego |
| Oldest | 83 | Sejmik Województwa Kujawsko-Pomorskiego |
Province lubelskie
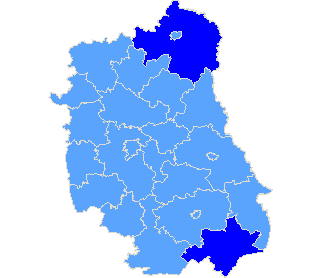
| Sejmik Województwa Lubelskiego |
| Submitted candidates | ||||||
| Specification | Number of candidates | Women | Women (%) | Men | Men (%) | Status |
| Constituency no. 1 | 7 | 2 | 28,57% | 5 | 71,43% | Registered |
| Constituency no. 2 | 6 | 2 | 33,33% | 4 | 66,67% | Registered |
| Constituency no. 3 | 12 | 3 | 25,00% | 9 | 75,00% | Registered |
| Constituency no. 4 | 5 | 2 | 40,00% | 3 | 60,00% | Registered |
| Constituency no. 5 | 13 | 7 | 53,85% | 6 | 46,15% | Registered |
| Totalling | 43 | 16 | 37,21% | 27 | 62,79% | |
| Age of the candidates | |||||
| Specification | Average age | Average age of women | Average age of men | Oldest | Youngest |
| Constituency no. 1 | 57 | 58 | 56 | 72 | 35 |
| Constituency no. 2 | 49 | 58 | 44 | 59 | 30 |
| Constituency no. 3 | 48 | 51 | 47 | 63 | 23 |
| Constituency no. 4 | 40 | 40 | 41 | 53 | 31 |
| Constituency no. 5 | 49 | 48 | 49 | 71 | 21 |
| Specification |
| pow. bialski |
| pow. tomaszowski |
| The statistics of election committe |
| Lists submitted | ||
| Specification | Number of | |
| lists | councils | |
| Lists submitted for province council | 5 | 1 |
| Lists submitted for county councils | 5 | 1 |
| Lists submitted for councils of cities holding county rights | 0 | 0 |
| Lists registered for communal councils | 10 | 3 |
| Totalling | 20 | 5 |
| Submitted candidates | |||||
| Specification | Number of candidates | Women | Women (%) | Men | Men (%) |
| Number of candidates submitted for the province council | 43 | 16 | 37,21% | 27 | 62,79% |
| Number of candidates submitted for county councils | 37 | 17 | 45,95% | 20 | 54,05% |
| Number of candidates submitted for councils of cities holding county rights | 0 | 0 | - | 0 | - |
| Number of candidates registered for communal councils | 14 | 11 | 78,57% | 3 | 21,43% |
| Number of candidates submitted for reeve, mayor and presidential elections | 1 | 1 | 100,00% | 0 | 0,00% |
| Totalling | 95 | 45 | 47,37% | 50 | 52,63% |
| Average age of submitted candidates | |||
| Specification | Average age | Average age of women | Average age of men |
| Average age of candidates submitted for the province council | 49 | 50 | 48 |
| Average age of candidates submitted for county councils | 47 | 45 | 49 |
| Average age of candidates for councils of cities holding county rights | - | - | - |
| Average age of candidates submitted for communal councils | 42 | 43 | 40 |
| Average age of candidates for reeve, mayor, president | 52 | 52 | - |
| Totalling | 47 | 46 | 47 |
| Submitted candidates for councils grouped by age | |||||
| Age | Number of candidates | Women | Women (%) | Men | Men (%) |
| 18-29 | 9 | 4 | 44,44% | 5 | 55,56% |
| 30-39 | 18 | 6 | 33,33% | 12 | 66,67% |
| 40-59 | 51 | 29 | 56,86% | 22 | 43,14% |
| 60+ | 16 | 5 | 31,25% | 11 | 68,75% |
| Totalling | 94 | 44 | 46,81% | 50 | 53,19% |
| Submitted candidates for reeve, mayor, president grouped by age | |||||
| Age | Number of candidates | Women | Women (%) | Men | Men (%) |
| 25-29 | 0 | 0 | - | 0 | - |
| 30-39 | 0 | 0 | - | 0 | - |
| 40-59 | 1 | 1 | 100,00% | 0 | 0,00% |
| 60+ | 0 | 0 | - | 0 | - |
| Totalling | 1 | 1 | 100,00% | 0 | 0,00% |
| The youngest and oldest submitted candidate for councils | ||
| Age | Institution | |
| Youngest | 21 | Sejmik Województwa Lubelskiego |
| Oldest | 76 | Rada Powiatu w Tomaszowie Lubelskim |
| The youngest and oldest submitted candidate for reeve, mayor, president | ||
| Age | Institution | |
| Youngest | 52 | Wójt Gminy Telatyn |
| Oldest | 52 | Wójt Gminy Telatyn |
| Sejmik Województwa Łódzkiego |
| Submitted candidates | ||||||
| Specification | Number of candidates | Women | Women (%) | Men | Men (%) | Status |
| Constituency no. 2 | 5 | 1 | 20,00% | 4 | 80,00% | Registered |
| Constituency no. 6 | 5 | 4 | 80,00% | 1 | 20,00% | Registered |
| Totalling | 10 | 5 | 50,00% | 5 | 50,00% | |
| Age of the candidates | |||||
| Specification | Average age | Average age of women | Average age of men | Oldest | Youngest |
| Constituency no. 2 | 51 | 54 | 51 | 79 | 33 |
| Constituency no. 6 | 44 | 43 | 50 | 50 | 38 |
| Specification |
| The statistics of election committe |
| Lists submitted | ||
| Specification | Number of | |
| lists | councils | |
| Lists submitted for province council | 2 | 1 |
| Lists submitted for county councils | 0 | 0 |
| Lists submitted for councils of cities holding county rights | 0 | 0 |
| Lists registered for communal councils | 0 | 0 |
| Totalling | 2 | 1 |
| Submitted candidates | |||||
| Specification | Number of candidates | Women | Women (%) | Men | Men (%) |
| Number of candidates submitted for the province council | 10 | 5 | 50,00% | 5 | 50,00% |
| Number of candidates submitted for county councils | 0 | 0 | - | 0 | - |
| Number of candidates submitted for councils of cities holding county rights | 0 | 0 | - | 0 | - |
| Number of candidates registered for communal councils | 0 | 0 | - | 0 | - |
| Number of candidates submitted for reeve, mayor and presidential elections | 0 | 0 | - | 0 | - |
| Totalling | 10 | 5 | 50,00% | 5 | 50,00% |
| Average age of submitted candidates | |||
| Specification | Average age | Average age of women | Average age of men |
| Average age of candidates submitted for the province council | 48 | 45 | 51 |
| Average age of candidates submitted for county councils | - | - | - |
| Average age of candidates for councils of cities holding county rights | - | - | - |
| Average age of candidates submitted for communal councils | - | - | - |
| Average age of candidates for reeve, mayor, president | - | - | - |
| Totalling | 48 | 45 | 51 |
| Submitted candidates for councils grouped by age | |||||
| Age | Number of candidates | Women | Women (%) | Men | Men (%) |
| 18-29 | 0 | 0 | - | 0 | - |
| 30-39 | 3 | 1 | 33,33% | 2 | 66,67% |
| 40-59 | 6 | 4 | 66,67% | 2 | 33,33% |
| 60+ | 1 | 0 | 0,00% | 1 | 100,00% |
| Totalling | 10 | 5 | 50,00% | 5 | 50,00% |
| Submitted candidates for reeve, mayor, president grouped by age | |||||
| Age | Number of candidates | Women | Women (%) | Men | Men (%) |
| 25-29 | 0 | 0 | - | 0 | - |
| 30-39 | 0 | 0 | - | 0 | - |
| 40-59 | 0 | 0 | - | 0 | - |
| 60+ | 0 | 0 | - | 0 | - |
| Totalling | 0 | 0 | - | 0 | - |
| The youngest and oldest submitted candidate for councils | ||
| Age | Institution | |
| Youngest | 28 | Sejmik Województwa Łódzkiego |
| Oldest | 80 | Sejmik Województwa Łódzkiego |
Province małopolskie
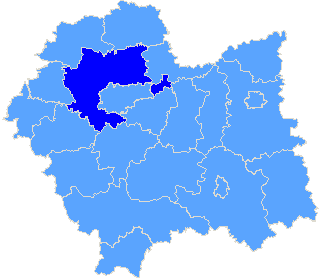
| Sejmik Województwa Małopolskiego |
| Submitted candidates | ||||||
| Specification | Number of candidates | Women | Women (%) | Men | Men (%) | Status |
| Constituency no. 4 | 6 | 3 | 50,00% | 3 | 50,00% | Registered |
| Totalling | 6 | 3 | 50,00% | 3 | 50,00% | |
| Age of the candidates | |||||
| Specification | Average age | Average age of women | Average age of men | Oldest | Youngest |
| Constituency no. 4 | 49 | 59 | 39 | 76 | 33 |
| Specification |
| pow. krakowski |
| The statistics of election committe |
| Lists submitted | ||
| Specification | Number of | |
| lists | councils | |
| Lists submitted for province council | 1 | 1 |
| Lists submitted for county councils | 0 | 0 |
| Lists submitted for councils of cities holding county rights | 0 | 0 |
| Lists registered for communal councils | 1 | 1 |
| Totalling | 2 | 2 |
| Submitted candidates | |||||
| Specification | Number of candidates | Women | Women (%) | Men | Men (%) |
| Number of candidates submitted for the province council | 6 | 3 | 50,00% | 3 | 50,00% |
| Number of candidates submitted for county councils | 0 | 0 | - | 0 | - |
| Number of candidates submitted for councils of cities holding county rights | 0 | 0 | - | 0 | - |
| Number of candidates registered for communal councils | 2 | 0 | 0,00% | 2 | 100,00% |
| Number of candidates submitted for reeve, mayor and presidential elections | 0 | 0 | - | 0 | - |
| Totalling | 8 | 3 | 37,50% | 5 | 62,50% |
| Average age of submitted candidates | |||
| Specification | Average age | Average age of women | Average age of men |
| Average age of candidates submitted for the province council | 49 | 59 | 39 |
| Average age of candidates submitted for county councils | - | - | - |
| Average age of candidates for councils of cities holding county rights | - | - | - |
| Average age of candidates submitted for communal councils | 51 | - | 51 |
| Average age of candidates for reeve, mayor, president | - | - | - |
| Totalling | 49 | 59 | 43 |
| Submitted candidates for councils grouped by age | |||||
| Age | Number of candidates | Women | Women (%) | Men | Men (%) |
| 18-29 | 0 | 0 | - | 0 | - |
| 30-39 | 2 | 1 | 50,00% | 1 | 50,00% |
| 40-59 | 3 | 0 | 0,00% | 3 | 100,00% |
| 60+ | 3 | 2 | 66,67% | 1 | 33,33% |
| Totalling | 8 | 3 | 37,50% | 5 | 62,50% |
| Submitted candidates for reeve, mayor, president grouped by age | |||||
| Age | Number of candidates | Women | Women (%) | Men | Men (%) |
| 25-29 | 0 | 0 | - | 0 | - |
| 30-39 | 0 | 0 | - | 0 | - |
| 40-59 | 0 | 0 | - | 0 | - |
| 60+ | 0 | 0 | - | 0 | - |
| Totalling | 0 | 0 | - | 0 | - |
| The youngest and oldest submitted candidate for councils | ||
| Age | Institution | |
| Youngest | 33 | Sejmik Województwa Małopolskiego |
| Oldest | 76 | Sejmik Województwa Małopolskiego |
Province mazowieckie
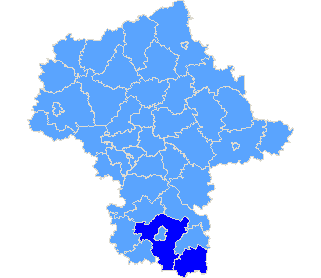
| Sejmik Województwa Mazowieckiego |
| Submitted candidates | ||||||
| Specification | Number of candidates | Women | Women (%) | Men | Men (%) | Status |
| Constituency no. 1 | 6 | 4 | 66,67% | 2 | 33,33% | Registered |
| Constituency no. 2 | 6 | 3 | 50,00% | 3 | 50,00% | Registered |
| Constituency no. 3 | 7 | 3 | 42,86% | 4 | 57,14% | Registered |
| Constituency no. 4 | 7 | 4 | 57,14% | 3 | 42,86% | Registered |
| Constituency no. 5 | 13 | 4 | 30,77% | 9 | 69,23% | Registered |
| Constituency no. 6 | 6 | 2 | 33,33% | 4 | 66,67% | Registered |
| Constituency no. 7 | 6 | 4 | 66,67% | 2 | 33,33% | Registered |
| Totalling | 51 | 24 | 47,06% | 27 | 52,94% | |
| Age of the candidates | |||||
| Specification | Average age | Average age of women | Average age of men | Oldest | Youngest |
| Constituency no. 1 | 51 | 55 | 45 | 73 | 22 |
| Constituency no. 2 | 44 | 48 | 39 | 64 | 24 |
| Constituency no. 3 | 53 | 52 | 53 | 72 | 22 |
| Constituency no. 4 | 49 | 40 | 61 | 75 | 26 |
| Constituency no. 5 | 48 | 47 | 49 | 76 | 18 |
| Constituency no. 6 | 44 | 23 | 55 | 64 | 22 |
| Constituency no. 7 | 44 | 52 | 27 | 63 | 26 |
| Specification |
| pow. lipski |
| pow. radomski |
| The statistics of election committe |
| Lists submitted | ||
| Specification | Number of | |
| lists | councils | |
| Lists submitted for province council | 7 | 1 |
| Lists submitted for county councils | 0 | 0 |
| Lists submitted for councils of cities holding county rights | 0 | 0 |
| Lists submitted for districts councils of the cap. city of Warsaw | 0 | 0 |
| Lists registered for communal councils | 5 | 2 |
| Totalling | 12 | 3 |
| Submitted candidates | |||||
| Specification | Number of candidates | Women | Women (%) | Men | Men (%) |
| Number of candidates submitted for the province council | 51 | 24 | 47,06% | 27 | 52,94% |
| Number of candidates submitted for county councils | 0 | 0 | - | 0 | - |
| Number of candidates submitted for councils of cities holding county rights | 0 | 0 | - | 0 | - |
| Number of candidates submitted for districts councils of the cap. city of Warsaw | 0 | 0 | - | 0 | - |
| Number of candidates registered for communal councils | 10 | 3 | 30,00% | 7 | 70,00% |
| Number of candidates submitted for reeve, mayor and presidential elections | 0 | 0 | - | 0 | - |
| Totalling | 61 | 27 | 44,26% | 34 | 55,74% |
| Average age of submitted candidates | |||
| Specification | Average age | Average age of women | Average age of men |
| Average age of candidates submitted for the province council | 48 | 47 | 49 |
| Average age of candidates submitted for county councils | - | - | - |
| Average age of candidates for councils of cities holding county rights | - | - | - |
| Average age of candidates for districts councils of the cap. city of Warsaw | - | - | - |
| Average age of candidates submitted for communal councils | 40 | 43 | 38 |
| Average age of candidates for reeve, mayor, president | - | - | - |
| Totalling | 46 | 46 | 46 |
| Submitted candidates for councils grouped by age | |||||
| Age | Number of candidates | Women | Women (%) | Men | Men (%) |
| 18-29 | 16 | 8 | 50,00% | 8 | 50,00% |
| 30-39 | 7 | 1 | 14,29% | 6 | 85,71% |
| 40-59 | 18 | 9 | 50,00% | 9 | 50,00% |
| 60+ | 20 | 9 | 45,00% | 11 | 55,00% |
| Totalling | 61 | 27 | 44,26% | 34 | 55,74% |
| Submitted candidates for reeve, mayor, president grouped by age | |||||
| Age | Number of candidates | Women | Women (%) | Men | Men (%) |
| 25-29 | 0 | 0 | - | 0 | - |
| 30-39 | 0 | 0 | - | 0 | - |
| 40-59 | 0 | 0 | - | 0 | - |
| 60+ | 0 | 0 | - | 0 | - |
| Totalling | 0 | 0 | - | 0 | - |
| The youngest and oldest submitted candidate for councils | ||
| Age | Institution | |
| Youngest | 18 | Sejmik Województwa Mazowieckiego |
| Oldest | 76 | Sejmik Województwa Mazowieckiego |
| Sejmik Województwa Podkarpackiego |
| Submitted candidates | ||||||
| Specification | Number of candidates | Women | Women (%) | Men | Men (%) | Status |
| Constituency no. 3 | 12 | 1 | 8,33% | 11 | 91,67% | Registered |
| Totalling | 12 | 1 | 8,33% | 11 | 91,67% | |
| Age of the candidates | |||||
| Specification | Average age | Average age of women | Average age of men | Oldest | Youngest |
| Constituency no. 3 | 53 | 41 | 54 | 80 | 23 |
| Specification |
| The statistics of election committe |
| Lists submitted | ||
| Specification | Number of | |
| lists | councils | |
| Lists submitted for province council | 1 | 1 |
| Lists submitted for county councils | 0 | 0 |
| Lists submitted for councils of cities holding county rights | 0 | 0 |
| Lists registered for communal councils | 0 | 0 |
| Totalling | 1 | 1 |
| Submitted candidates | |||||
| Specification | Number of candidates | Women | Women (%) | Men | Men (%) |
| Number of candidates submitted for the province council | 12 | 1 | 8,33% | 11 | 91,67% |
| Number of candidates submitted for county councils | 0 | 0 | - | 0 | - |
| Number of candidates submitted for councils of cities holding county rights | 0 | 0 | - | 0 | - |
| Number of candidates registered for communal councils | 0 | 0 | - | 0 | - |
| Number of candidates submitted for reeve, mayor and presidential elections | 0 | 0 | - | 0 | - |
| Totalling | 12 | 1 | 8,33% | 11 | 91,67% |
| Average age of submitted candidates | |||
| Specification | Average age | Average age of women | Average age of men |
| Average age of candidates submitted for the province council | 53 | 41 | 54 |
| Average age of candidates submitted for county councils | - | - | - |
| Average age of candidates for councils of cities holding county rights | - | - | - |
| Average age of candidates submitted for communal councils | - | - | - |
| Average age of candidates for reeve, mayor, president | - | - | - |
| Totalling | 53 | 41 | 54 |
| Submitted candidates for councils grouped by age | |||||
| Age | Number of candidates | Women | Women (%) | Men | Men (%) |
| 18-29 | 1 | 0 | 0,00% | 1 | 100,00% |
| 30-39 | 3 | 0 | 0,00% | 3 | 100,00% |
| 40-59 | 3 | 1 | 33,33% | 2 | 66,67% |
| 60+ | 5 | 0 | 0,00% | 5 | 100,00% |
| Totalling | 12 | 1 | 8,33% | 11 | 91,67% |
| Submitted candidates for reeve, mayor, president grouped by age | |||||
| Age | Number of candidates | Women | Women (%) | Men | Men (%) |
| 25-29 | 0 | 0 | - | 0 | - |
| 30-39 | 0 | 0 | - | 0 | - |
| 40-59 | 0 | 0 | - | 0 | - |
| 60+ | 0 | 0 | - | 0 | - |
| Totalling | 0 | 0 | - | 0 | - |
| The youngest and oldest submitted candidate for councils | ||
| Age | Institution | |
| Youngest | 23 | Sejmik Województwa Podkarpackiego |
| Oldest | 80 | Sejmik Województwa Podkarpackiego |
| Sejmik Województwa Pomorskiego |
| Submitted candidates | ||||||
| Specification | Number of candidates | Women | Women (%) | Men | Men (%) | Status |
| Constituency no. 1 | 6 | 3 | 50,00% | 3 | 50,00% | Registered |
| Constituency no. 2 | 6 | 2 | 33,33% | 4 | 66,67% | Registered |
| Constituency no. 3 | 6 | 0 | 0,00% | 6 | 100,00% | Registered |
| Constituency no. 4 | 6 | 4 | 66,67% | 2 | 33,33% | Registered |
| Constituency no. 5 | 6 | 3 | 50,00% | 3 | 50,00% | Registered |
| Totalling | 30 | 12 | 40,00% | 18 | 60,00% | |
| Age of the candidates | |||||
| Specification | Average age | Average age of women | Average age of men | Oldest | Youngest |
| Constituency no. 1 | 54 | 51 | 57 | 76 | 28 |
| Constituency no. 2 | 54 | 57 | 53 | 74 | 30 |
| Constituency no. 3 | 59 | - | 59 | 71 | 44 |
| Constituency no. 4 | 59 | 58 | 63 | 74 | 47 |
| Constituency no. 5 | 64 | 59 | 69 | 75 | 39 |
| Specification |
| The statistics of election committe |
| Lists submitted | ||
| Specification | Number of | |
| lists | councils | |
| Lists submitted for province council | 5 | 1 |
| Lists submitted for county councils | 0 | 0 |
| Lists submitted for councils of cities holding county rights | 0 | 0 |
| Lists registered for communal councils | 0 | 0 |
| Totalling | 5 | 1 |
| Submitted candidates | |||||
| Specification | Number of candidates | Women | Women (%) | Men | Men (%) |
| Number of candidates submitted for the province council | 30 | 12 | 40,00% | 18 | 60,00% |
| Number of candidates submitted for county councils | 0 | 0 | - | 0 | - |
| Number of candidates submitted for councils of cities holding county rights | 0 | 0 | - | 0 | - |
| Number of candidates registered for communal councils | 0 | 0 | - | 0 | - |
| Number of candidates submitted for reeve, mayor and presidential elections | 0 | 0 | - | 0 | - |
| Totalling | 30 | 12 | 40,00% | 18 | 60,00% |
| Average age of submitted candidates | |||
| Specification | Average age | Average age of women | Average age of men |
| Average age of candidates submitted for the province council | 58 | 56 | 59 |
| Average age of candidates submitted for county councils | - | - | - |
| Average age of candidates for councils of cities holding county rights | - | - | - |
| Average age of candidates submitted for communal councils | - | - | - |
| Average age of candidates for reeve, mayor, president | - | - | - |
| Totalling | 58 | 56 | 59 |
| Submitted candidates for councils grouped by age | |||||
| Age | Number of candidates | Women | Women (%) | Men | Men (%) |
| 18-29 | 1 | 1 | 100,00% | 0 | 0,00% |
| 30-39 | 3 | 1 | 33,33% | 2 | 66,67% |
| 40-59 | 11 | 6 | 54,55% | 5 | 45,45% |
| 60+ | 15 | 4 | 26,67% | 11 | 73,33% |
| Totalling | 30 | 12 | 40,00% | 18 | 60,00% |
| Submitted candidates for reeve, mayor, president grouped by age | |||||
| Age | Number of candidates | Women | Women (%) | Men | Men (%) |
| 25-29 | 0 | 0 | - | 0 | - |
| 30-39 | 0 | 0 | - | 0 | - |
| 40-59 | 0 | 0 | - | 0 | - |
| 60+ | 0 | 0 | - | 0 | - |
| Totalling | 0 | 0 | - | 0 | - |
| The youngest and oldest submitted candidate for councils | ||
| Age | Institution | |
| Youngest | 28 | Sejmik Województwa Pomorskiego |
| Oldest | 76 | Sejmik Województwa Pomorskiego |
Province śląskie
| Sejmik Województwa Śląskiego |
| Submitted candidates | ||||||
| Specification | Number of candidates | Women | Women (%) | Men | Men (%) | Status |
| Constituency no. 1 | 10 | 4 | 40,00% | 6 | 60,00% | Registered |
| Constituency no. 2 | 7 | 1 | 14,29% | 6 | 85,71% | Registered |
| Constituency no. 3 | 8 | 4 | 50,00% | 4 | 50,00% | Registered |
| Constituency no. 4 | 6 | 2 | 33,33% | 4 | 66,67% | Registered |
| Constituency no. 5 | 5 | 3 | 60,00% | 2 | 40,00% | Registered |
| Constituency no. 6 | 9 | 4 | 44,44% | 5 | 55,56% | Registered |
| Constituency no. 7 | 7 | 1 | 14,29% | 6 | 85,71% | Registered |
| Totalling | 52 | 19 | 36,54% | 33 | 63,46% | |
| Age of the candidates | |||||
| Specification | Average age | Average age of women | Average age of men | Oldest | Youngest |
| Constituency no. 1 | 50 | 59 | 43 | 73 | 21 |
| Constituency no. 2 | 55 | 46 | 57 | 64 | 40 |
| Constituency no. 3 | 56 | 59 | 53 | 77 | 34 |
| Constituency no. 4 | 54 | 37 | 63 | 74 | 37 |
| Constituency no. 5 | 59 | 62 | 55 | 77 | 32 |
| Constituency no. 6 | 50 | 42 | 56 | 70 | 21 |
| Constituency no. 7 | 46 | 32 | 48 | 70 | 26 |
| Specification |
| pow. będziński |
| The statistics of election committe |
| Lists submitted | ||
| Specification | Number of | |
| lists | councils | |
| Lists submitted for province council | 7 | 1 |
| Lists submitted for county councils | 5 | 1 |
| Lists submitted for councils of cities holding county rights | 0 | 0 |
| Lists registered for communal councils | 0 | 0 |
| Totalling | 12 | 2 |
| Submitted candidates | |||||
| Specification | Number of candidates | Women | Women (%) | Men | Men (%) |
| Number of candidates submitted for the province council | 52 | 19 | 36,54% | 33 | 63,46% |
| Number of candidates submitted for county councils | 19 | 10 | 52,63% | 9 | 47,37% |
| Number of candidates submitted for councils of cities holding county rights | 0 | 0 | - | 0 | - |
| Number of candidates registered for communal councils | 0 | 0 | - | 0 | - |
| Number of candidates submitted for reeve, mayor and presidential elections | 0 | 0 | - | 0 | - |
| Totalling | 71 | 29 | 40,85% | 42 | 59,15% |
| Average age of submitted candidates | |||
| Specification | Average age | Average age of women | Average age of men |
| Average age of candidates submitted for the province council | 52 | 52 | 53 |
| Average age of candidates submitted for county councils | 44 | 43 | 45 |
| Average age of candidates for councils of cities holding county rights | - | - | - |
| Average age of candidates submitted for communal councils | - | - | - |
| Average age of candidates for reeve, mayor, president | - | - | - |
| Totalling | 49 | 48 | 51 |
| Submitted candidates for councils grouped by age | |||||
| Age | Number of candidates | Women | Women (%) | Men | Men (%) |
| 18-29 | 8 | 2 | 25,00% | 6 | 75,00% |
| 30-39 | 16 | 10 | 62,50% | 6 | 37,50% |
| 40-59 | 21 | 6 | 28,57% | 15 | 71,43% |
| 60+ | 26 | 11 | 42,31% | 15 | 57,69% |
| Totalling | 71 | 29 | 40,85% | 42 | 59,15% |
| Submitted candidates for reeve, mayor, president grouped by age | |||||
| Age | Number of candidates | Women | Women (%) | Men | Men (%) |
| 25-29 | 0 | 0 | - | 0 | - |
| 30-39 | 0 | 0 | - | 0 | - |
| 40-59 | 0 | 0 | - | 0 | - |
| 60+ | 0 | 0 | - | 0 | - |
| Totalling | 0 | 0 | - | 0 | - |
| The youngest and oldest submitted candidate for councils | ||
| Age | Institution | |
| Youngest | 21 | Sejmik Województwa Śląskiego |
| Oldest | 77 | Sejmik Województwa Śląskiego |
| Sejmik Województwa Świętokrzyskiego |
| Submitted candidates | ||||||
| Specification | Number of candidates | Women | Women (%) | Men | Men (%) | Status |
| Constituency no. 1 | 8 | 2 | 25,00% | 6 | 75,00% | Registered |
| Constituency no. 2 | 6 | 2 | 33,33% | 4 | 66,67% | Registered |
| Constituency no. 3 | 10 | 0 | 0,00% | 10 | 100,00% | Registered |
| Constituency no. 4 | 9 | 2 | 22,22% | 7 | 77,78% | Registered |
| Totalling | 33 | 6 | 18,18% | 27 | 81,82% | |
| Age of the candidates | |||||
| Specification | Average age | Average age of women | Average age of men | Oldest | Youngest |
| Constituency no. 1 | 50 | 41 | 53 | 63 | 38 |
| Constituency no. 2 | 54 | 33 | 64 | 80 | 27 |
| Constituency no. 3 | 59 | - | 59 | 70 | 28 |
| Constituency no. 4 | 54 | 65 | 51 | 80 | 20 |
| Specification |
| The statistics of election committe |
| Lists submitted | ||
| Specification | Number of | |
| lists | councils | |
| Lists submitted for province council | 4 | 1 |
| Lists submitted for county councils | 0 | 0 |
| Lists submitted for councils of cities holding county rights | 0 | 0 |
| Lists registered for communal councils | 0 | 0 |
| Totalling | 4 | 1 |
| Submitted candidates | |||||
| Specification | Number of candidates | Women | Women (%) | Men | Men (%) |
| Number of candidates submitted for the province council | 33 | 6 | 18,18% | 27 | 81,82% |
| Number of candidates submitted for county councils | 0 | 0 | - | 0 | - |
| Number of candidates submitted for councils of cities holding county rights | 0 | 0 | - | 0 | - |
| Number of candidates registered for communal councils | 0 | 0 | - | 0 | - |
| Number of candidates submitted for reeve, mayor and presidential elections | 0 | 0 | - | 0 | - |
| Totalling | 33 | 6 | 18,18% | 27 | 81,82% |
| Average age of submitted candidates | |||
| Specification | Average age | Average age of women | Average age of men |
| Average age of candidates submitted for the province council | 54 | 46 | 56 |
| Average age of candidates submitted for county councils | - | - | - |
| Average age of candidates for councils of cities holding county rights | - | - | - |
| Average age of candidates submitted for communal councils | - | - | - |
| Average age of candidates for reeve, mayor, president | - | - | - |
| Totalling | 54 | 46 | 56 |
| Submitted candidates for councils grouped by age | |||||
| Age | Number of candidates | Women | Women (%) | Men | Men (%) |
| 18-29 | 4 | 1 | 25,00% | 3 | 75,00% |
| 30-39 | 3 | 2 | 66,67% | 1 | 33,33% |
| 40-59 | 9 | 1 | 11,11% | 8 | 88,89% |
| 60+ | 17 | 2 | 11,76% | 15 | 88,24% |
| Totalling | 33 | 6 | 18,18% | 27 | 81,82% |
| Submitted candidates for reeve, mayor, president grouped by age | |||||
| Age | Number of candidates | Women | Women (%) | Men | Men (%) |
| 25-29 | 0 | 0 | - | 0 | - |
| 30-39 | 0 | 0 | - | 0 | - |
| 40-59 | 0 | 0 | - | 0 | - |
| 60+ | 0 | 0 | - | 0 | - |
| Totalling | 0 | 0 | - | 0 | - |
| The youngest and oldest submitted candidate for councils | ||
| Age | Institution | |
| Youngest | 20 | Sejmik Województwa Świętokrzyskiego |
| Oldest | 80 | Sejmik Województwa Świętokrzyskiego |
| Sejmik Województwa Wielkopolskiego |
| Submitted candidates | ||||||
| Specification | Number of candidates | Women | Women (%) | Men | Men (%) | Status |
| Constituency no. 1 | 6 | 3 | 50,00% | 3 | 50,00% | Registered |
| Constituency no. 2 | 7 | 3 | 42,86% | 4 | 57,14% | Registered |
| Constituency no. 3 | 7 | 3 | 42,86% | 4 | 57,14% | Registered |
| Constituency no. 4 | 5 | 3 | 60,00% | 2 | 40,00% | Registered |
| Constituency no. 5 | 7 | 3 | 42,86% | 4 | 57,14% | Registered |
| Constituency no. 6 | 6 | 3 | 50,00% | 3 | 50,00% | Registered |
| Totalling | 38 | 18 | 47,37% | 20 | 52,63% | |
| Age of the candidates | |||||
| Specification | Average age | Average age of women | Average age of men | Oldest | Youngest |
| Constituency no. 1 | 62 | 67 | 56 | 77 | 43 |
| Constituency no. 2 | 46 | 49 | 43 | 64 | 31 |
| Constituency no. 3 | 47 | 47 | 48 | 71 | 27 |
| Constituency no. 4 | 51 | 35 | 74 | 74 | 31 |
| Constituency no. 5 | 45 | 53 | 40 | 64 | 18 |
| Constituency no. 6 | 53 | 62 | 43 | 70 | 23 |
| Specification |
| The statistics of election committe |
| Lists submitted | ||
| Specification | Number of | |
| lists | councils | |
| Lists submitted for province council | 6 | 1 |
| Lists submitted for county councils | 0 | 0 |
| Lists submitted for councils of cities holding county rights | 0 | 0 |
| Lists registered for communal councils | 0 | 0 |
| Totalling | 6 | 1 |
| Submitted candidates | |||||
| Specification | Number of candidates | Women | Women (%) | Men | Men (%) |
| Number of candidates submitted for the province council | 38 | 18 | 47,37% | 20 | 52,63% |
| Number of candidates submitted for county councils | 0 | 0 | - | 0 | - |
| Number of candidates submitted for councils of cities holding county rights | 0 | 0 | - | 0 | - |
| Number of candidates registered for communal councils | 0 | 0 | - | 0 | - |
| Number of candidates submitted for reeve, mayor and presidential elections | 0 | 0 | - | 0 | - |
| Totalling | 38 | 18 | 47,37% | 20 | 52,63% |
| Average age of submitted candidates | |||
| Specification | Average age | Average age of women | Average age of men |
| Average age of candidates submitted for the province council | 50 | 52 | 48 |
| Average age of candidates submitted for county councils | - | - | - |
| Average age of candidates for councils of cities holding county rights | - | - | - |
| Average age of candidates submitted for communal councils | - | - | - |
| Average age of candidates for reeve, mayor, president | - | - | - |
| Totalling | 50 | 52 | 48 |
| Submitted candidates for councils grouped by age | |||||
| Age | Number of candidates | Women | Women (%) | Men | Men (%) |
| 18-29 | 5 | 1 | 20,00% | 4 | 80,00% |
| 30-39 | 5 | 2 | 40,00% | 3 | 60,00% |
| 40-59 | 15 | 9 | 60,00% | 6 | 40,00% |
| 60+ | 13 | 6 | 46,15% | 7 | 53,85% |
| Totalling | 38 | 18 | 47,37% | 20 | 52,63% |
| Submitted candidates for reeve, mayor, president grouped by age | |||||
| Age | Number of candidates | Women | Women (%) | Men | Men (%) |
| 25-29 | 0 | 0 | - | 0 | - |
| 30-39 | 0 | 0 | - | 0 | - |
| 40-59 | 0 | 0 | - | 0 | - |
| 60+ | 0 | 0 | - | 0 | - |
| Totalling | 0 | 0 | - | 0 | - |
| The youngest and oldest submitted candidate for councils | ||
| Age | Institution | |
| Youngest | 18 | Sejmik Województwa Wielkopolskiego |
| Oldest | 77 | Sejmik Województwa Wielkopolskiego |
| Sejmik Województwa Zachodniopomorskiego |
| Submitted candidates | ||||||
| Specification | Number of candidates | Women | Women (%) | Men | Men (%) | Status |
| Constituency no. 1 | 5 | 0 | 0,00% | 5 | 100,00% | Registered |
| Totalling | 5 | 0 | 0,00% | 5 | 100,00% | |
| Age of the candidates | |||||
| Specification | Average age | Average age of women | Average age of men | Oldest | Youngest |
| Constituency no. 1 | 54 | - | 54 | 80 | 22 |
| Specification |
| The statistics of election committe |
| Lists submitted | ||
| Specification | Number of | |
| lists | councils | |
| Lists submitted for province council | 1 | 1 |
| Lists submitted for county councils | 0 | 0 |
| Lists submitted for councils of cities holding county rights | 0 | 0 |
| Lists registered for communal councils | 0 | 0 |
| Totalling | 1 | 1 |
| Submitted candidates | |||||
| Specification | Number of candidates | Women | Women (%) | Men | Men (%) |
| Number of candidates submitted for the province council | 5 | 0 | 0,00% | 5 | 100,00% |
| Number of candidates submitted for county councils | 0 | 0 | - | 0 | - |
| Number of candidates submitted for councils of cities holding county rights | 0 | 0 | - | 0 | - |
| Number of candidates registered for communal councils | 0 | 0 | - | 0 | - |
| Number of candidates submitted for reeve, mayor and presidential elections | 0 | 0 | - | 0 | - |
| Totalling | 5 | 0 | 0,00% | 5 | 100,00% |
| Average age of submitted candidates | |||
| Specification | Average age | Average age of women | Average age of men |
| Average age of candidates submitted for the province council | 54 | - | 54 |
| Average age of candidates submitted for county councils | - | - | - |
| Average age of candidates for councils of cities holding county rights | - | - | - |
| Average age of candidates submitted for communal councils | - | - | - |
| Average age of candidates for reeve, mayor, president | - | - | - |
| Totalling | 54 | - | 54 |
| Submitted candidates for councils grouped by age | |||||
| Age | Number of candidates | Women | Women (%) | Men | Men (%) |
| 18-29 | 1 | 0 | 0,00% | 1 | 100,00% |
| 30-39 | 0 | 0 | - | 0 | - |
| 40-59 | 1 | 0 | 0,00% | 1 | 100,00% |
| 60+ | 3 | 0 | 0,00% | 3 | 100,00% |
| Totalling | 5 | 0 | 0,00% | 5 | 100,00% |
| Submitted candidates for reeve, mayor, president grouped by age | |||||
| Age | Number of candidates | Women | Women (%) | Men | Men (%) |
| 25-29 | 0 | 0 | - | 0 | - |
| 30-39 | 0 | 0 | - | 0 | - |
| 40-59 | 0 | 0 | - | 0 | - |
| 60+ | 0 | 0 | - | 0 | - |
| Totalling | 0 | 0 | - | 0 | - |
| The youngest and oldest submitted candidate for councils | ||
| Age | Institution | |
| Youngest | 22 | Sejmik Województwa Zachodniopomorskiego |
| Oldest | 80 | Sejmik Województwa Zachodniopomorskiego |
