

Rzeczpospolita Polska
| The statistics of election committe |
| Lists submitted | ||
| Specification | Number of | |
| lists | councils | |
| Lists submitted for provinces councils | 0 | 0 |
| Lists submitted for county councils | 0 | 0 |
| Lists submitted for councils of cities holding county rights | 6 | 1 |
| Lists submitted for districts councils of the cap. city of Warsaw | 0 | 0 |
| Lists registered for communal councils | 0 | 0 |
| Totalling | 6 | 1 |
| Submitted candidates | |||||
| Specification | Number of candidates | Women | Women (%) | Men | Men (%) |
| Number of candidates submitted for the province council | 0 | 0 | - | 0 | - |
| Number of candidates submitted for county councils | 0 | 0 | - | 0 | - |
| Number of candidates submitted for councils of cities holding county rights | 62 | 26 | 41,94% | 36 | 58,06% |
| Number of candidates submitted for districts councils of the cap. city of Warsaw | 0 | 0 | - | 0 | - |
| Number of candidates registered for communal councils | 0 | 0 | - | 0 | - |
| Number of candidates submitted for reeve, mayor and presidential elections | 1 | 1 | 100,00% | 0 | 0,00% |
| Totalling | 63 | 27 | 42,86% | 36 | 57,14% |
| Average age of submitted candidates | |||
| Specification | Average age | Average age of women | Average age of men |
| Average age of candidates submitted for the province council | - | - | - |
| Average age of candidates submitted for county councils | - | - | - |
| Average age of candidates for councils of cities holding county rights | 35 | 35 | 36 |
| Average age of candidates submitted for communal councils | - | - | - |
| Average age of candidates for reeve, mayor, president | 64 | 64 | - |
| Totalling | 35 | 36 | 36 |
| Submitted candidates for councils grouped by age | |||||
| Age | Number of candidates | Women | Women (%) | Men | Men (%) |
| 18-29 | 24 | 10 | 41,67% | 14 | 58,33% |
| 30-39 | 16 | 9 | 56,25% | 7 | 43,75% |
| 40-59 | 18 | 5 | 27,78% | 13 | 72,22% |
| 60+ | 4 | 2 | 50,00% | 2 | 50,00% |
| Totalling | 62 | 26 | 41,94% | 36 | 58,06% |
| Submitted candidates for reeve, mayor, president grouped by age | |||||
| Age | Number of candidates | Women | Women (%) | Men | Men (%) |
| 25-29 | 0 | 0 | - | 0 | - |
| 30-39 | 0 | 0 | - | 0 | - |
| 40-59 | 0 | 0 | - | 0 | - |
| 60+ | 1 | 1 | 100,00% | 0 | 0,00% |
| Totalling | 1 | 1 | 100,00% | 0 | 0,00% |
| The youngest and oldest submitted candidate for councils | ||
| Age | Institution | |
| Youngest | 18 | Rada Miasta Lublin |
| Oldest | 66 | Rada Miasta Lublin |
| The youngest and oldest submitted candidate for reeve, mayor, president | ||
| Age | Institution | |
| Youngest | 64 | Prezydent Miasta Lublin |
| Oldest | 64 | Prezydent Miasta Lublin |
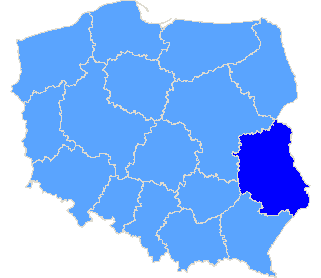
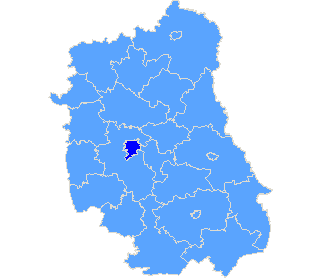
Province lubelskie
| Specification |
| m. Lublin |
| The statistics of election committe |
| Lists submitted | ||
| Specification | Number of | |
| lists | councils | |
| Lists submitted for province council | 0 | 0 |
| Lists submitted for county councils | 0 | 0 |
| Lists submitted for councils of cities holding county rights | 6 | 1 |
| Lists registered for communal councils | 0 | 0 |
| Totalling | 6 | 1 |
| Submitted candidates | |||||
| Specification | Number of candidates | Women | Women (%) | Men | Men (%) |
| Number of candidates submitted for the province council | 0 | 0 | - | 0 | - |
| Number of candidates submitted for county councils | 0 | 0 | - | 0 | - |
| Number of candidates submitted for councils of cities holding county rights | 62 | 26 | 41,94% | 36 | 58,06% |
| Number of candidates registered for communal councils | 0 | 0 | - | 0 | - |
| Number of candidates submitted for reeve, mayor and presidential elections | 1 | 1 | 100,00% | 0 | 0,00% |
| Totalling | 63 | 27 | 42,86% | 36 | 57,14% |
| Average age of submitted candidates | |||
| Specification | Average age | Average age of women | Average age of men |
| Average age of candidates submitted for the province council | - | - | - |
| Average age of candidates submitted for county councils | - | - | - |
| Average age of candidates for councils of cities holding county rights | 35 | 35 | 36 |
| Average age of candidates submitted for communal councils | - | - | - |
| Average age of candidates for reeve, mayor, president | 64 | 64 | - |
| Totalling | 35 | 36 | 36 |
| Submitted candidates for councils grouped by age | |||||
| Age | Number of candidates | Women | Women (%) | Men | Men (%) |
| 18-29 | 24 | 10 | 41,67% | 14 | 58,33% |
| 30-39 | 16 | 9 | 56,25% | 7 | 43,75% |
| 40-59 | 18 | 5 | 27,78% | 13 | 72,22% |
| 60+ | 4 | 2 | 50,00% | 2 | 50,00% |
| Totalling | 62 | 26 | 41,94% | 36 | 58,06% |
| Submitted candidates for reeve, mayor, president grouped by age | |||||
| Age | Number of candidates | Women | Women (%) | Men | Men (%) |
| 25-29 | 0 | 0 | - | 0 | - |
| 30-39 | 0 | 0 | - | 0 | - |
| 40-59 | 0 | 0 | - | 0 | - |
| 60+ | 1 | 1 | 100,00% | 0 | 0,00% |
| Totalling | 1 | 1 | 100,00% | 0 | 0,00% |
| The youngest and oldest submitted candidate for councils | ||
| Age | Institution | |
| Youngest | 18 | Rada Miasta Lublin |
| Oldest | 66 | Rada Miasta Lublin |
| The youngest and oldest submitted candidate for reeve, mayor, president | ||
| Age | Institution | |
| Youngest | 64 | Prezydent Miasta Lublin |
| Oldest | 64 | Prezydent Miasta Lublin |
