

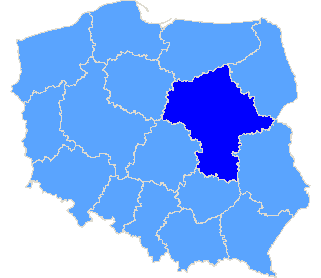
Rzeczpospolita Polska
| The statistics of election committe |
| Lists submitted | ||
| Specification | Number of | |
| lists | councils | |
| Lists submitted for provinces councils | 0 | 0 |
| Lists submitted for county councils | 0 | 0 |
| Lists submitted for councils of cities holding county rights | 7 | 1 |
| Lists submitted for districts councils of the cap. city of Warsaw | 0 | 0 |
| Lists registered for communal councils | 5 | 3 |
| Totalling | 12 | 4 |
| Submitted candidates | |||||
| Specification | Number of candidates | Women | Women (%) | Men | Men (%) |
| Number of candidates submitted for the province council | 0 | 0 | - | 0 | - |
| Number of candidates submitted for county councils | 0 | 0 | - | 0 | - |
| Number of candidates submitted for councils of cities holding county rights | 40 | 18 | 45,00% | 22 | 55,00% |
| Number of candidates submitted for districts councils of the cap. city of Warsaw | 0 | 0 | - | 0 | - |
| Number of candidates registered for communal councils | 5 | 3 | 60,00% | 2 | 40,00% |
| Number of candidates submitted for reeve, mayor and presidential elections | 0 | 0 | - | 0 | - |
| Totalling | 45 | 21 | 46,67% | 24 | 53,33% |
| Average age of submitted candidates | |||
| Specification | Average age | Average age of women | Average age of men |
| Average age of candidates submitted for the province council | - | - | - |
| Average age of candidates submitted for county councils | - | - | - |
| Average age of candidates for councils of cities holding county rights | 57 | 58 | 57 |
| Average age of candidates submitted for communal councils | 57 | 60 | 54 |
| Average age of candidates for reeve, mayor, president | - | - | - |
| Totalling | 57 | 58 | 56 |
| Submitted candidates for councils grouped by age | |||||
| Age | Number of candidates | Women | Women (%) | Men | Men (%) |
| 18-29 | 1 | 1 | 100,00% | 0 | 0,00% |
| 30-39 | 4 | 2 | 50,00% | 2 | 50,00% |
| 40-59 | 18 | 5 | 27,78% | 13 | 72,22% |
| 60+ | 22 | 13 | 59,09% | 9 | 40,91% |
| Totalling | 45 | 21 | 46,67% | 24 | 53,33% |
| Submitted candidates for reeve, mayor, president grouped by age | |||||
| Age | Number of candidates | Women | Women (%) | Men | Men (%) |
| 25-29 | 0 | 0 | - | 0 | - |
| 30-39 | 0 | 0 | - | 0 | - |
| 40-59 | 0 | 0 | - | 0 | - |
| 60+ | 0 | 0 | - | 0 | - |
| Totalling | 0 | 0 | - | 0 | - |
| The youngest and oldest submitted candidate for councils | ||
| Age | Institution | |
| Youngest | 22 | Rada m.st. Warszawy |
| Oldest | 83 | Rada m.st. Warszawy |
Province mazowieckie
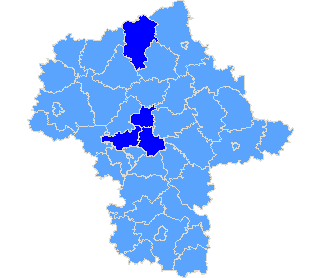
| Specification |
| m. Warszawa |
| pow. legionowski |
| pow. przasnyski |
| pow. warszawski zachodni |
| The statistics of election committe |
| Lists submitted | ||
| Specification | Number of | |
| lists | councils | |
| Lists submitted for province council | 0 | 0 |
| Lists submitted for county councils | 0 | 0 |
| Lists submitted for councils of cities holding county rights | 7 | 1 |
| Lists submitted for districts councils of the cap. city of Warsaw | 0 | 0 |
| Lists registered for communal councils | 5 | 3 |
| Totalling | 12 | 4 |
| Submitted candidates | |||||
| Specification | Number of candidates | Women | Women (%) | Men | Men (%) |
| Number of candidates submitted for the province council | 0 | 0 | - | 0 | - |
| Number of candidates submitted for county councils | 0 | 0 | - | 0 | - |
| Number of candidates submitted for councils of cities holding county rights | 40 | 18 | 45,00% | 22 | 55,00% |
| Number of candidates submitted for districts councils of the cap. city of Warsaw | 0 | 0 | - | 0 | - |
| Number of candidates registered for communal councils | 5 | 3 | 60,00% | 2 | 40,00% |
| Number of candidates submitted for reeve, mayor and presidential elections | 0 | 0 | - | 0 | - |
| Totalling | 45 | 21 | 46,67% | 24 | 53,33% |
| Average age of submitted candidates | |||
| Specification | Average age | Average age of women | Average age of men |
| Average age of candidates submitted for the province council | - | - | - |
| Average age of candidates submitted for county councils | - | - | - |
| Average age of candidates for councils of cities holding county rights | 57 | 58 | 57 |
| Average age of candidates for districts councils of the cap. city of Warsaw | - | - | - |
| Average age of candidates submitted for communal councils | 57 | 60 | 54 |
| Average age of candidates for reeve, mayor, president | - | - | - |
| Totalling | 57 | 58 | 56 |
| Submitted candidates for councils grouped by age | |||||
| Age | Number of candidates | Women | Women (%) | Men | Men (%) |
| 18-29 | 1 | 1 | 100,00% | 0 | 0,00% |
| 30-39 | 4 | 2 | 50,00% | 2 | 50,00% |
| 40-59 | 18 | 5 | 27,78% | 13 | 72,22% |
| 60+ | 22 | 13 | 59,09% | 9 | 40,91% |
| Totalling | 45 | 21 | 46,67% | 24 | 53,33% |
| Submitted candidates for reeve, mayor, president grouped by age | |||||
| Age | Number of candidates | Women | Women (%) | Men | Men (%) |
| 25-29 | 0 | 0 | - | 0 | - |
| 30-39 | 0 | 0 | - | 0 | - |
| 40-59 | 0 | 0 | - | 0 | - |
| 60+ | 0 | 0 | - | 0 | - |
| Totalling | 0 | 0 | - | 0 | - |
| The youngest and oldest submitted candidate for councils | ||
| Age | Institution | |
| Youngest | 22 | Rada m.st. Warszawy |
| Oldest | 83 | Rada m.st. Warszawy |
