

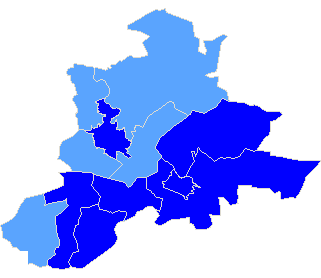
Powiat jarosławski
| Rada Powiatu Jarosławskiego |
| Submitted candidates | ||||||
| Specification | Number of candidates | Women | Women (%) | Men | Men (%) | Status |
| Constituency no. 1 | 7 | 1 | 14,29% | 6 | 85,71% | Registered |
| Totalling | 7 | 1 | 14,29% | 6 | 85,71% | |
| Age of the candidates | |||||
| Specification | Average age | Average age of women | Average age of men | Oldest | Youngest |
| Constituency no. 1 | 53 | 58 | 52 | 72 | 32 |
| The statistics of election committe |
| Lists submitted | ||
| Specification | Number of | |
| lists | councils | |
| Lists submitted for county councils | 1 | 1 |
| Lists registered for communal councils | 16 | 7 |
| Totalling | 17 | 8 |
| Submitted candidates | |||||
| Specification | Number of candidates | Women | Women (%) | Men | Men (%) |
| Number of candidates submitted for county councils | 7 | 1 | 14,29% | 6 | 85,71% |
| Number of candidates registered for communal councils | 27 | 6 | 22,22% | 21 | 77,78% |
| Number of candidates submitted for reeve, mayor and presidential elections | 1 | 0 | 0,00% | 1 | 100,00% |
| Totalling | 35 | 7 | 20,00% | 28 | 80,00% |
| Average age of submitted candidates | |||
| Specification | Average age | Average age of women | Average age of men |
| Average age of candidates submitted for county councils | 53 | 58 | 52 |
| Average age of candidates submitted for communal councils | 49 | 40 | 51 |
| Average age of candidates for reeve, mayor, president | 33 | - | 33 |
| Totalling | 49 | 42 | 50 |
| Submitted candidates for councils grouped by age | |||||
| Age | Number of candidates | Women | Women (%) | Men | Men (%) |
| 18-29 | 4 | 2 | 50,00% | 2 | 50,00% |
| 30-39 | 6 | 1 | 16,67% | 5 | 83,33% |
| 40-59 | 13 | 3 | 23,08% | 10 | 76,92% |
| 60+ | 11 | 1 | 9,09% | 10 | 90,91% |
| Totalling | 34 | 7 | 20,59% | 27 | 79,41% |
| Submitted candidates for reeve, mayor, president grouped by age | |||||
| Age | Number of candidates | Women | Women (%) | Men | Men (%) |
| 25-29 | 0 | 0 | - | 0 | - |
| 30-39 | 1 | 0 | 0,00% | 1 | 100,00% |
| 40-59 | 0 | 0 | - | 0 | - |
| 60+ | 0 | 0 | - | 0 | - |
| Totalling | 1 | 0 | 0,00% | 1 | 100,00% |
| The youngest and oldest submitted candidate for councils | ||
| Age | Institution | |
| Youngest | 20 | Rada Gminy Rokietnica |
| Oldest | 75 | Rada Miasta Jarosławia |
| The youngest and oldest submitted candidate for reeve, mayor, president | ||
| Age | Institution | |
| Youngest | 33 | Wójt Gminy Rokietnica |
| Oldest | 33 | Wójt Gminy Rokietnica |
| Rada Miasta Jarosławia |
| Submitted candidates | ||||||
| Specification | Number of candidates | Women | Women (%) | Men | Men (%) | Status |
| Constituency no. 1 | 5 | 2 | 40,00% | 3 | 60,00% | Registered |
| Totalling | 5 | 2 | 40,00% | 3 | 60,00% | |
| Age of the candidates | |||||
| Specification | Average age | Average age of women | Average age of men | Oldest | Youngest |
| Constituency no. 1 | 58 | 40 | 71 | 75 | 21 |
| The statistics of election committe |
| Lists submitted | ||
| Specification | Number of | |
| lists | councils | |
| Lists registered for communal councils | 1 | 1 |
| Totalling | 1 | 1 |
| Submitted candidates | |||||
| Specification | Number of candidates | Women | Women (%) | Men | Men (%) |
| Number of candidates registered for communal councils | 5 | 2 | 40,00% | 3 | 60,00% |
| Number of candidates submitted for reeve, mayor and presidential elections | 0 | 0 | - | 0 | - |
| Totalling | 5 | 2 | 40,00% | 3 | 60,00% |
| Average age of submitted candidates | |||
| Specification | Average age | Average age of women | Average age of men |
| Average age of candidates submitted for communal councils | 58 | 40 | 71 |
| Average age of candidates for reeve, mayor, president | - | - | - |
| Totalling | 58 | 40 | 71 |
| Submitted candidates for councils grouped by age | |||||
| Age | Number of candidates | Women | Women (%) | Men | Men (%) |
| 18-29 | 1 | 1 | 100,00% | 0 | 0,00% |
| 30-39 | 0 | 0 | - | 0 | - |
| 40-59 | 1 | 1 | 100,00% | 0 | 0,00% |
| 60+ | 3 | 0 | 0,00% | 3 | 100,00% |
| Totalling | 5 | 2 | 40,00% | 3 | 60,00% |
| Submitted candidates for reeve, mayor, president grouped by age | |||||
| Age | Number of candidates | Women | Women (%) | Men | Men (%) |
| 25-29 | 0 | 0 | - | 0 | - |
| 30-39 | 0 | 0 | - | 0 | - |
| 40-59 | 0 | 0 | - | 0 | - |
| 60+ | 0 | 0 | - | 0 | - |
| Totalling | 0 | 0 | - | 0 | - |
| The youngest and oldest submitted candidate for councils | ||
| Age | Institution | |
| Youngest | 21 | Rada Miasta Jarosławia |
| Oldest | 75 | Rada Miasta Jarosławia |
| Rada Miejska w Radymnie |
| Submitted candidates | ||||||
| Specification | Number of candidates | Women | Women (%) | Men | Men (%) | Status |
| Constituency no. 4 | 1 | 0 | 0,00% | 1 | 100,00% | Registered |
| Totalling | 1 | 0 | 0,00% | 1 | 100,00% | |
| Age of the candidates | |||||
| Specification | Average age | Average age of women | Average age of men | Oldest | Youngest |
| Constituency no. 4 | 64 | - | 64 | 64 | 64 |
| The statistics of election committe |
| Lists submitted | ||
| Specification | Number of | |
| lists | councils | |
| Lists registered for communal councils | 1 | 1 |
| Totalling | 1 | 1 |
| Submitted candidates | |||||
| Specification | Number of candidates | Women | Women (%) | Men | Men (%) |
| Number of candidates registered for communal councils | 1 | 0 | 0,00% | 1 | 100,00% |
| Number of candidates submitted for reeve, mayor and presidential elections | 0 | 0 | - | 0 | - |
| Totalling | 1 | 0 | 0,00% | 1 | 100,00% |
| Average age of submitted candidates | |||
| Specification | Average age | Average age of women | Average age of men |
| Average age of candidates submitted for communal councils | 64 | - | 64 |
| Average age of candidates for reeve, mayor, president | - | - | - |
| Totalling | 64 | - | 64 |
| Submitted candidates for councils grouped by age | |||||
| Age | Number of candidates | Women | Women (%) | Men | Men (%) |
| 18-29 | 0 | 0 | - | 0 | - |
| 30-39 | 0 | 0 | - | 0 | - |
| 40-59 | 0 | 0 | - | 0 | - |
| 60+ | 1 | 0 | 0,00% | 1 | 100,00% |
| Totalling | 1 | 0 | 0,00% | 1 | 100,00% |
| Submitted candidates for reeve, mayor, president grouped by age | |||||
| Age | Number of candidates | Women | Women (%) | Men | Men (%) |
| 25-29 | 0 | 0 | - | 0 | - |
| 30-39 | 0 | 0 | - | 0 | - |
| 40-59 | 0 | 0 | - | 0 | - |
| 60+ | 0 | 0 | - | 0 | - |
| Totalling | 0 | 0 | - | 0 | - |
| The youngest and oldest submitted candidate for councils | ||
| Age | Institution | |
| Youngest | 64 | Rada Miejska w Radymnie |
| Oldest | 64 | Rada Miejska w Radymnie |
| Rada Gminy Chłopice |
| Submitted candidates | ||||||
| Specification | Number of candidates | Women | Women (%) | Men | Men (%) | Status |
| Constituency no. 3 | 2 | 0 | 0,00% | 2 | 100,00% | Registered |
| Constituency no. 4 | 1 | 1 | 100,00% | 0 | 0,00% | Registered |
| Constituency no. 5 | 1 | 1 | 100,00% | 0 | 0,00% | Registered |
| Constituency no. 6 | 3 | 0 | 0,00% | 3 | 100,00% | Registered |
| Constituency no. 7 | 1 | 0 | 0,00% | 1 | 100,00% | Registered |
| Totalling | 8 | 2 | 25,00% | 6 | 75,00% | |
| Age of the candidates | |||||
| Specification | Average age | Average age of women | Average age of men | Oldest | Youngest |
| Constituency no. 3 | 48 | - | 48 | 52 | 43 |
| Constituency no. 4 | 44 | 44 | - | 44 | 44 |
| Constituency no. 5 | 66 | 66 | - | 66 | 66 |
| Constituency no. 6 | 47 | - | 47 | 66 | 36 |
| Constituency no. 7 | 35 | - | 35 | 35 | 35 |
| The statistics of election committe |
| Lists submitted | ||
| Specification | Number of | |
| lists | councils | |
| Lists registered for communal councils | 5 | 1 |
| Totalling | 5 | 1 |
| Submitted candidates | |||||
| Specification | Number of candidates | Women | Women (%) | Men | Men (%) |
| Number of candidates registered for communal councils | 8 | 2 | 25,00% | 6 | 75,00% |
| Number of candidates submitted for reeve, mayor and presidential elections | 0 | 0 | - | 0 | - |
| Totalling | 8 | 2 | 25,00% | 6 | 75,00% |
| Average age of submitted candidates | |||
| Specification | Average age | Average age of women | Average age of men |
| Average age of candidates submitted for communal councils | 48 | 55 | 45 |
| Average age of candidates for reeve, mayor, president | - | - | - |
| Totalling | 48 | 55 | 45 |
| Submitted candidates for councils grouped by age | |||||
| Age | Number of candidates | Women | Women (%) | Men | Men (%) |
| 18-29 | 0 | 0 | - | 0 | - |
| 30-39 | 2 | 0 | 0,00% | 2 | 100,00% |
| 40-59 | 4 | 1 | 25,00% | 3 | 75,00% |
| 60+ | 2 | 1 | 50,00% | 1 | 50,00% |
| Totalling | 8 | 2 | 25,00% | 6 | 75,00% |
| Submitted candidates for reeve, mayor, president grouped by age | |||||
| Age | Number of candidates | Women | Women (%) | Men | Men (%) |
| 25-29 | 0 | 0 | - | 0 | - |
| 30-39 | 0 | 0 | - | 0 | - |
| 40-59 | 0 | 0 | - | 0 | - |
| 60+ | 0 | 0 | - | 0 | - |
| Totalling | 0 | 0 | - | 0 | - |
| The youngest and oldest submitted candidate for councils | ||
| Age | Institution | |
| Youngest | 35 | Rada Gminy Chłopice |
| Oldest | 66 | Rada Gminy Chłopice |
| Rada Gminy Laszki |
| Submitted candidates | ||||||
| Specification | Number of candidates | Women | Women (%) | Men | Men (%) | Status |
| Constituency no. 2 | 1 | 0 | 0,00% | 1 | 100,00% | Registered |
| Constituency no. 10 | 1 | 0 | 0,00% | 1 | 100,00% | Registered |
| Totalling | 2 | 0 | 0,00% | 2 | 100,00% | |
| Age of the candidates | |||||
| Specification | Average age | Average age of women | Average age of men | Oldest | Youngest |
| Constituency no. 2 | 60 | - | 60 | 60 | 60 |
| Constituency no. 10 | 54 | - | 54 | 54 | 54 |
| The statistics of election committe |
| Lists submitted | ||
| Specification | Number of | |
| lists | councils | |
| Lists registered for communal councils | 2 | 1 |
| Totalling | 2 | 1 |
| Submitted candidates | |||||
| Specification | Number of candidates | Women | Women (%) | Men | Men (%) |
| Number of candidates registered for communal councils | 2 | 0 | 0,00% | 2 | 100,00% |
| Number of candidates submitted for reeve, mayor and presidential elections | 0 | 0 | - | 0 | - |
| Totalling | 2 | 0 | 0,00% | 2 | 100,00% |
| Average age of submitted candidates | |||
| Specification | Average age | Average age of women | Average age of men |
| Average age of candidates submitted for communal councils | 57 | - | 57 |
| Average age of candidates for reeve, mayor, president | - | - | - |
| Totalling | 57 | - | 57 |
| Submitted candidates for councils grouped by age | |||||
| Age | Number of candidates | Women | Women (%) | Men | Men (%) |
| 18-29 | 0 | 0 | - | 0 | - |
| 30-39 | 0 | 0 | - | 0 | - |
| 40-59 | 1 | 0 | 0,00% | 1 | 100,00% |
| 60+ | 1 | 0 | 0,00% | 1 | 100,00% |
| Totalling | 2 | 0 | 0,00% | 2 | 100,00% |
| Submitted candidates for reeve, mayor, president grouped by age | |||||
| Age | Number of candidates | Women | Women (%) | Men | Men (%) |
| 25-29 | 0 | 0 | - | 0 | - |
| 30-39 | 0 | 0 | - | 0 | - |
| 40-59 | 0 | 0 | - | 0 | - |
| 60+ | 0 | 0 | - | 0 | - |
| Totalling | 0 | 0 | - | 0 | - |
| The youngest and oldest submitted candidate for councils | ||
| Age | Institution | |
| Youngest | 54 | Rada Gminy Laszki |
| Oldest | 60 | Rada Gminy Laszki |
| Rada Gminy Radymno |
| Submitted candidates | ||||||
| Specification | Number of candidates | Women | Women (%) | Men | Men (%) | Status |
| Constituency no. 3 | 1 | 0 | 0,00% | 1 | 100,00% | Registered |
| Totalling | 1 | 0 | 0,00% | 1 | 100,00% | |
| Age of the candidates | |||||
| Specification | Average age | Average age of women | Average age of men | Oldest | Youngest |
| Constituency no. 3 | 53 | - | 53 | 53 | 53 |
| The statistics of election committe |
| Lists submitted | ||
| Specification | Number of | |
| lists | councils | |
| Lists registered for communal councils | 1 | 1 |
| Totalling | 1 | 1 |
| Submitted candidates | |||||
| Specification | Number of candidates | Women | Women (%) | Men | Men (%) |
| Number of candidates registered for communal councils | 1 | 0 | 0,00% | 1 | 100,00% |
| Number of candidates submitted for reeve, mayor and presidential elections | 0 | 0 | - | 0 | - |
| Totalling | 1 | 0 | 0,00% | 1 | 100,00% |
| Average age of submitted candidates | |||
| Specification | Average age | Average age of women | Average age of men |
| Average age of candidates submitted for communal councils | 53 | - | 53 |
| Average age of candidates for reeve, mayor, president | - | - | - |
| Totalling | 53 | - | 53 |
| Submitted candidates for councils grouped by age | |||||
| Age | Number of candidates | Women | Women (%) | Men | Men (%) |
| 18-29 | 0 | 0 | - | 0 | - |
| 30-39 | 0 | 0 | - | 0 | - |
| 40-59 | 1 | 0 | 0,00% | 1 | 100,00% |
| 60+ | 0 | 0 | - | 0 | - |
| Totalling | 1 | 0 | 0,00% | 1 | 100,00% |
| Submitted candidates for reeve, mayor, president grouped by age | |||||
| Age | Number of candidates | Women | Women (%) | Men | Men (%) |
| 25-29 | 0 | 0 | - | 0 | - |
| 30-39 | 0 | 0 | - | 0 | - |
| 40-59 | 0 | 0 | - | 0 | - |
| 60+ | 0 | 0 | - | 0 | - |
| Totalling | 0 | 0 | - | 0 | - |
| The youngest and oldest submitted candidate for councils | ||
| Age | Institution | |
| Youngest | 53 | Rada Gminy Radymno |
| Oldest | 53 | Rada Gminy Radymno |
| Wójt Gminy Rokietnica |
| Number of | Family name and given names | Age | Education | Address, party membership and endorsements |
| 3 | GRZESZCZAK ADAM BOGDAN | 33 | WYŻSZE | CZELATYCE, submitted by KOMITET WYBORCZY SOJUSZ LEWICY DEMOKRATYCZNEJ, endorsed by Sojusz Lewicy Demokratycznej, not a member of any political party |
| Rada Gminy Rokietnica |
| Submitted candidates | ||||||
| Specification | Number of candidates | Women | Women (%) | Men | Men (%) | Status |
| Constituency no. 1 | 2 | 1 | 50,00% | 1 | 50,00% | Registered |
| Constituency no. 3 | 2 | 0 | 0,00% | 2 | 100,00% | Registered |
| Constituency no. 4 | 2 | 0 | 0,00% | 2 | 100,00% | Registered |
| Constituency no. 5 | 2 | 0 | 0,00% | 2 | 100,00% | Registered |
| Totalling | 8 | 1 | 12,50% | 7 | 87,50% | |
| Age of the candidates | |||||
| Specification | Average age | Average age of women | Average age of men | Oldest | Youngest |
| Constituency no. 1 | 28 | 20 | 36 | 36 | 20 |
| Constituency no. 3 | 55 | - | 55 | 56 | 53 |
| Constituency no. 4 | 24 | - | 24 | 26 | 22 |
| Constituency no. 5 | 58 | - | 58 | 61 | 55 |
| The statistics of election committe |
| Lists submitted | ||
| Specification | Number of | |
| lists | councils | |
| Lists registered for communal councils | 4 | 1 |
| Totalling | 4 | 1 |
| Submitted candidates | |||||
| Specification | Number of candidates | Women | Women (%) | Men | Men (%) |
| Number of candidates registered for communal councils | 8 | 1 | 12,50% | 7 | 87,50% |
| Number of candidates submitted for reeve, mayor and presidential elections | 1 | 0 | 0,00% | 1 | 100,00% |
| Totalling | 9 | 1 | 11,11% | 8 | 88,89% |
| Average age of submitted candidates | |||
| Specification | Average age | Average age of women | Average age of men |
| Average age of candidates submitted for communal councils | 41 | 20 | 44 |
| Average age of candidates for reeve, mayor, president | 33 | - | 33 |
| Totalling | 40 | 20 | 42 |
| Submitted candidates for councils grouped by age | |||||
| Age | Number of candidates | Women | Women (%) | Men | Men (%) |
| 18-29 | 3 | 1 | 33,33% | 2 | 66,67% |
| 30-39 | 1 | 0 | 0,00% | 1 | 100,00% |
| 40-59 | 3 | 0 | 0,00% | 3 | 100,00% |
| 60+ | 1 | 0 | 0,00% | 1 | 100,00% |
| Totalling | 8 | 1 | 12,50% | 7 | 87,50% |
| Submitted candidates for reeve, mayor, president grouped by age | |||||
| Age | Number of candidates | Women | Women (%) | Men | Men (%) |
| 25-29 | 0 | 0 | - | 0 | - |
| 30-39 | 1 | 0 | 0,00% | 1 | 100,00% |
| 40-59 | 0 | 0 | - | 0 | - |
| 60+ | 0 | 0 | - | 0 | - |
| Totalling | 1 | 0 | 0,00% | 1 | 100,00% |
| The youngest and oldest submitted candidate for councils | ||
| Age | Institution | |
| Youngest | 20 | Rada Gminy Rokietnica |
| Oldest | 61 | Rada Gminy Rokietnica |
| The youngest and oldest submitted candidate for reeve, mayor, president | ||
| Age | Institution | |
| Youngest | 33 | Wójt Gminy Rokietnica |
| Oldest | 33 | Wójt Gminy Rokietnica |
| Rada Gminy Roźwienica |
| Submitted candidates | ||||||
| Specification | Number of candidates | Women | Women (%) | Men | Men (%) | Status |
| Constituency no. 2 | 1 | 0 | 0,00% | 1 | 100,00% | Registered |
| Constituency no. 3 | 1 | 1 | 100,00% | 0 | 0,00% | Registered |
| Totalling | 2 | 1 | 50,00% | 1 | 50,00% | |
| Age of the candidates | |||||
| Specification | Average age | Average age of women | Average age of men | Oldest | Youngest |
| Constituency no. 2 | 57 | - | 57 | 57 | 57 |
| Constituency no. 3 | 33 | 33 | - | 33 | 33 |
| The statistics of election committe |
| Lists submitted | ||
| Specification | Number of | |
| lists | councils | |
| Lists registered for communal councils | 2 | 1 |
| Totalling | 2 | 1 |
| Submitted candidates | |||||
| Specification | Number of candidates | Women | Women (%) | Men | Men (%) |
| Number of candidates registered for communal councils | 2 | 1 | 50,00% | 1 | 50,00% |
| Number of candidates submitted for reeve, mayor and presidential elections | 0 | 0 | - | 0 | - |
| Totalling | 2 | 1 | 50,00% | 1 | 50,00% |
| Average age of submitted candidates | |||
| Specification | Average age | Average age of women | Average age of men |
| Average age of candidates submitted for communal councils | 45 | 33 | 57 |
| Average age of candidates for reeve, mayor, president | - | - | - |
| Totalling | 45 | 33 | 57 |
| Submitted candidates for councils grouped by age | |||||
| Age | Number of candidates | Women | Women (%) | Men | Men (%) |
| 18-29 | 0 | 0 | - | 0 | - |
| 30-39 | 1 | 1 | 100,00% | 0 | 0,00% |
| 40-59 | 1 | 0 | 0,00% | 1 | 100,00% |
| 60+ | 0 | 0 | - | 0 | - |
| Totalling | 2 | 1 | 50,00% | 1 | 50,00% |
| Submitted candidates for reeve, mayor, president grouped by age | |||||
| Age | Number of candidates | Women | Women (%) | Men | Men (%) |
| 25-29 | 0 | 0 | - | 0 | - |
| 30-39 | 0 | 0 | - | 0 | - |
| 40-59 | 0 | 0 | - | 0 | - |
| 60+ | 0 | 0 | - | 0 | - |
| Totalling | 0 | 0 | - | 0 | - |
| The youngest and oldest submitted candidate for councils | ||
| Age | Institution | |
| Youngest | 33 | Rada Gminy Roźwienica |
| Oldest | 57 | Rada Gminy Roźwienica |
