

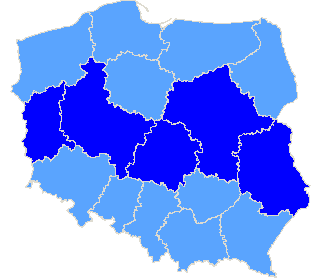
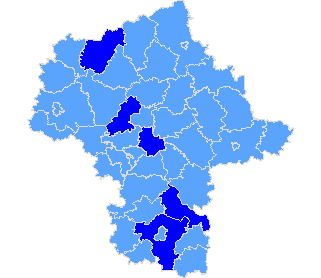
Rzeczpospolita Polska
| The statistics of election committe |
| Lists submitted | ||
| Specification | Number of | |
| lists | councils | |
| Lists submitted for provinces councils | 5 | 2 |
| Lists submitted for county councils | 5 | 2 |
| Lists submitted for councils of cities holding county rights | 9 | 1 |
| Lists submitted for districts councils of the cap. city of Warsaw | 0 | 0 |
| Lists registered for communal councils | 68 | 16 |
| Totalling | 87 | 21 |
| Submitted candidates | |||||
| Specification | Number of candidates | Women | Women (%) | Men | Men (%) |
| Number of candidates submitted for the province council | 35 | 5 | 14,29% | 30 | 85,71% |
| Number of candidates submitted for county councils | 42 | 12 | 28,57% | 30 | 71,43% |
| Number of candidates submitted for councils of cities holding county rights | 98 | 47 | 47,96% | 51 | 52,04% |
| Number of candidates submitted for districts councils of the cap. city of Warsaw | 0 | 0 | - | 0 | - |
| Number of candidates registered for communal councils | 87 | 26 | 29,89% | 61 | 70,11% |
| Number of candidates submitted for reeve, mayor and presidential elections | 7 | 0 | 0,00% | 7 | 100,00% |
| Totalling | 269 | 90 | 33,46% | 179 | 66,54% |
| Average age of submitted candidates | |||
| Specification | Average age | Average age of women | Average age of men |
| Average age of candidates submitted for the province council | 52 | 42 | 54 |
| Average age of candidates submitted for county councils | 49 | 42 | 53 |
| Average age of candidates for councils of cities holding county rights | 46 | 42 | 49 |
| Average age of candidates submitted for communal councils | 45 | 41 | 46 |
| Average age of candidates for reeve, mayor, president | 57 | - | 57 |
| Totalling | 47 | 41 | 49 |
| Submitted candidates for councils grouped by age | |||||
| Age | Number of candidates | Women | Women (%) | Men | Men (%) |
| 18-29 | 38 | 18 | 47,37% | 20 | 52,63% |
| 30-39 | 47 | 22 | 46,81% | 25 | 53,19% |
| 40-59 | 112 | 42 | 37,50% | 70 | 62,50% |
| 60+ | 65 | 8 | 12,31% | 57 | 87,69% |
| Totalling | 262 | 90 | 34,35% | 172 | 65,65% |
| Submitted candidates for reeve, mayor, president grouped by age | |||||
| Age | Number of candidates | Women | Women (%) | Men | Men (%) |
| 25-29 | 0 | 0 | - | 0 | - |
| 30-39 | 0 | 0 | - | 0 | - |
| 40-59 | 5 | 0 | 0,00% | 5 | 100,00% |
| 60+ | 2 | 0 | 0,00% | 2 | 100,00% |
| Totalling | 7 | 0 | 0,00% | 7 | 100,00% |
| The youngest and oldest submitted candidate for councils | ||
| Age | Institution | |
| Youngest | 18 | Rada Powiatu Nowosolskiego |
| Oldest | 83 | Rada m.st. Warszawy |
| The youngest and oldest submitted candidate for reeve, mayor, president | ||
| Age | Institution | |
| Youngest | 47 | Prezydent m.st. Warszawy |
| Oldest | 68 | Wójt Gminy Czosnów |
Province lubelskie
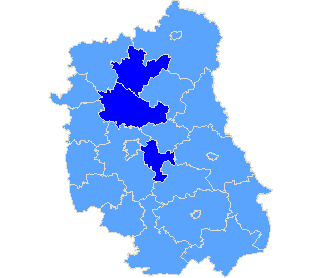
| Specification |
| pow. lubartowski |
| pow. radzyński |
| pow. świdnicki |
| The statistics of election committe |
| Lists submitted | ||
| Specification | Number of | |
| lists | councils | |
| Lists submitted for province council | 0 | 0 |
| Lists submitted for county councils | 0 | 0 |
| Lists submitted for councils of cities holding county rights | 0 | 0 |
| Lists registered for communal councils | 17 | 5 |
| Totalling | 17 | 5 |
| Submitted candidates | |||||
| Specification | Number of candidates | Women | Women (%) | Men | Men (%) |
| Number of candidates submitted for the province council | 0 | 0 | - | 0 | - |
| Number of candidates submitted for county councils | 0 | 0 | - | 0 | - |
| Number of candidates submitted for councils of cities holding county rights | 0 | 0 | - | 0 | - |
| Number of candidates registered for communal councils | 25 | 8 | 32,00% | 17 | 68,00% |
| Number of candidates submitted for reeve, mayor and presidential elections | 2 | 0 | 0,00% | 2 | 100,00% |
| Totalling | 27 | 8 | 29,63% | 19 | 70,37% |
| Average age of submitted candidates | |||
| Specification | Average age | Average age of women | Average age of men |
| Average age of candidates submitted for the province council | - | - | - |
| Average age of candidates submitted for county councils | - | - | - |
| Average age of candidates for councils of cities holding county rights | - | - | - |
| Average age of candidates submitted for communal councils | 45 | 43 | 46 |
| Average age of candidates for reeve, mayor, president | 57 | - | 57 |
| Totalling | 45 | 43 | 47 |
| Submitted candidates for councils grouped by age | |||||
| Age | Number of candidates | Women | Women (%) | Men | Men (%) |
| 18-29 | 5 | 1 | 20,00% | 4 | 80,00% |
| 30-39 | 4 | 3 | 75,00% | 1 | 25,00% |
| 40-59 | 13 | 4 | 30,77% | 9 | 69,23% |
| 60+ | 3 | 0 | 0,00% | 3 | 100,00% |
| Totalling | 25 | 8 | 32,00% | 17 | 68,00% |
| Submitted candidates for reeve, mayor, president grouped by age | |||||
| Age | Number of candidates | Women | Women (%) | Men | Men (%) |
| 25-29 | 0 | 0 | - | 0 | - |
| 30-39 | 0 | 0 | - | 0 | - |
| 40-59 | 2 | 0 | 0,00% | 2 | 100,00% |
| 60+ | 0 | 0 | - | 0 | - |
| Totalling | 2 | 0 | 0,00% | 2 | 100,00% |
| The youngest and oldest submitted candidate for councils | ||
| Age | Institution | |
| Youngest | 20 | Sejmik Województwa Lubelskiego |
| Oldest | 70 | Rada Miejska w Piaskach |
| The youngest and oldest submitted candidate for reeve, mayor, president | ||
| Age | Institution | |
| Youngest | 55 | Wójt Gminy Rybczewice |
| Oldest | 59 | Burmistrz Piask |
Province lubuskie
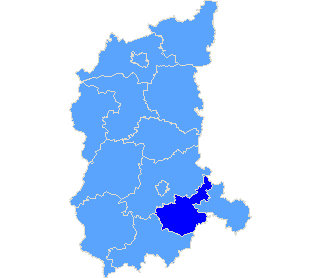
| Specification |
| pow. nowosolski |
| The statistics of election committe |
| Lists submitted | ||
| Specification | Number of | |
| lists | councils | |
| Lists submitted for province council | 0 | 0 |
| Lists submitted for county councils | 4 | 1 |
| Lists submitted for councils of cities holding county rights | 0 | 0 |
| Lists registered for communal councils | 12 | 3 |
| Totalling | 16 | 4 |
| Submitted candidates | |||||
| Specification | Number of candidates | Women | Women (%) | Men | Men (%) |
| Number of candidates submitted for the province council | 0 | 0 | - | 0 | - |
| Number of candidates submitted for county councils | 39 | 12 | 30,77% | 27 | 69,23% |
| Number of candidates submitted for councils of cities holding county rights | 0 | 0 | - | 0 | - |
| Number of candidates registered for communal councils | 19 | 4 | 21,05% | 15 | 78,95% |
| Number of candidates submitted for reeve, mayor and presidential elections | 1 | 0 | 0,00% | 1 | 100,00% |
| Totalling | 59 | 16 | 27,12% | 43 | 72,88% |
| Average age of submitted candidates | |||
| Specification | Average age | Average age of women | Average age of men |
| Average age of candidates submitted for the province council | - | - | - |
| Average age of candidates submitted for county councils | 50 | 42 | 54 |
| Average age of candidates for councils of cities holding county rights | - | - | - |
| Average age of candidates submitted for communal councils | 47 | 35 | 51 |
| Average age of candidates for reeve, mayor, president | 65 | - | 65 |
| Totalling | 49 | 40 | 53 |
| Submitted candidates for councils grouped by age | |||||
| Age | Number of candidates | Women | Women (%) | Men | Men (%) |
| 18-29 | 11 | 6 | 54,55% | 5 | 45,45% |
| 30-39 | 3 | 2 | 66,67% | 1 | 33,33% |
| 40-59 | 24 | 6 | 25,00% | 18 | 75,00% |
| 60+ | 20 | 2 | 10,00% | 18 | 90,00% |
| Totalling | 58 | 16 | 27,59% | 42 | 72,41% |
| Submitted candidates for reeve, mayor, president grouped by age | |||||
| Age | Number of candidates | Women | Women (%) | Men | Men (%) |
| 25-29 | 0 | 0 | - | 0 | - |
| 30-39 | 0 | 0 | - | 0 | - |
| 40-59 | 0 | 0 | - | 0 | - |
| 60+ | 1 | 0 | 0,00% | 1 | 100,00% |
| Totalling | 1 | 0 | 0,00% | 1 | 100,00% |
| The youngest and oldest submitted candidate for councils | ||
| Age | Institution | |
| Youngest | 18 | Rada Powiatu Nowosolskiego |
| Oldest | 71 | Rada Gminy Kolsko |
| The youngest and oldest submitted candidate for reeve, mayor, president | ||
| Age | Institution | |
| Youngest | 65 | Wójt Gminy Kolsko |
| Oldest | 65 | Wójt Gminy Kolsko |
Province łódzkie
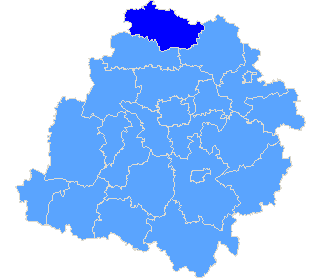
| Specification |
| pow. kutnowski |
| The statistics of election committe |
| Lists submitted | ||
| Specification | Number of | |
| lists | councils | |
| Lists submitted for province council | 0 | 0 |
| Lists submitted for county councils | 0 | 0 |
| Lists submitted for councils of cities holding county rights | 0 | 0 |
| Lists registered for communal councils | 9 | 1 |
| Totalling | 9 | 1 |
| Submitted candidates | |||||
| Specification | Number of candidates | Women | Women (%) | Men | Men (%) |
| Number of candidates submitted for the province council | 0 | 0 | - | 0 | - |
| Number of candidates submitted for county councils | 0 | 0 | - | 0 | - |
| Number of candidates submitted for councils of cities holding county rights | 0 | 0 | - | 0 | - |
| Number of candidates registered for communal councils | 12 | 5 | 41,67% | 7 | 58,33% |
| Number of candidates submitted for reeve, mayor and presidential elections | 1 | 0 | 0,00% | 1 | 100,00% |
| Totalling | 13 | 5 | 38,46% | 8 | 61,54% |
| Average age of submitted candidates | |||
| Specification | Average age | Average age of women | Average age of men |
| Average age of candidates submitted for the province council | - | - | - |
| Average age of candidates submitted for county councils | - | - | - |
| Average age of candidates for councils of cities holding county rights | - | - | - |
| Average age of candidates submitted for communal councils | 53 | 55 | 51 |
| Average age of candidates for reeve, mayor, president | 55 | - | 55 |
| Totalling | 53 | 55 | 51 |
| Submitted candidates for councils grouped by age | |||||
| Age | Number of candidates | Women | Women (%) | Men | Men (%) |
| 18-29 | 1 | 0 | 0,00% | 1 | 100,00% |
| 30-39 | 1 | 0 | 0,00% | 1 | 100,00% |
| 40-59 | 6 | 3 | 50,00% | 3 | 50,00% |
| 60+ | 4 | 2 | 50,00% | 2 | 50,00% |
| Totalling | 12 | 5 | 41,67% | 7 | 58,33% |
| Submitted candidates for reeve, mayor, president grouped by age | |||||
| Age | Number of candidates | Women | Women (%) | Men | Men (%) |
| 25-29 | 0 | 0 | - | 0 | - |
| 30-39 | 0 | 0 | - | 0 | - |
| 40-59 | 1 | 0 | 0,00% | 1 | 100,00% |
| 60+ | 0 | 0 | - | 0 | - |
| Totalling | 1 | 0 | 0,00% | 1 | 100,00% |
| The youngest and oldest submitted candidate for councils | ||
| Age | Institution | |
| Youngest | 26 | Rada Miejska w Żychlinie |
| Oldest | 69 | Rada Miejska w Żychlinie |
| The youngest and oldest submitted candidate for reeve, mayor, president | ||
| Age | Institution | |
| Youngest | 55 | Burmistrz Gminy Żychlin |
| Oldest | 55 | Burmistrz Gminy Żychlin |
Province mazowieckie
| Sejmik Województwa Mazowieckiego |
| Submitted candidates | ||||||
| Specification | Number of candidates | Women | Women (%) | Men | Men (%) | Status |
| Constituency no. 4 | 6 | 2 | 33,33% | 4 | 66,67% | Registered |
| Constituency no. 5 | 5 | 0 | 0,00% | 5 | 100,00% | Registered |
| Constituency no. 7 | 11 | 1 | 9,09% | 10 | 90,91% | Registered |
| Totalling | 22 | 3 | 13,64% | 19 | 86,36% | |
| Age of the candidates | |||||
| Specification | Average age | Average age of women | Average age of men | Oldest | Youngest |
| Constituency no. 4 | 38 | 33 | 41 | 52 | 25 |
| Constituency no. 5 | 52 | - | 52 | 65 | 32 |
| Constituency no. 7 | 50 | 41 | 51 | 69 | 23 |
| Specification |
| m. Warszawa |
| pow. kozienicki |
| pow. mławski |
| pow. nowodworski |
| pow. radomski |
| The statistics of election committe |
| Lists submitted | ||
| Specification | Number of | |
| lists | councils | |
| Lists submitted for province council | 3 | 1 |
| Lists submitted for county councils | 1 | 1 |
| Lists submitted for councils of cities holding county rights | 9 | 1 |
| Lists submitted for districts councils of the cap. city of Warsaw | 0 | 0 |
| Lists registered for communal councils | 27 | 5 |
| Totalling | 40 | 8 |
| Submitted candidates | |||||
| Specification | Number of candidates | Women | Women (%) | Men | Men (%) |
| Number of candidates submitted for the province council | 22 | 3 | 13,64% | 19 | 86,36% |
| Number of candidates submitted for county councils | 3 | 0 | 0,00% | 3 | 100,00% |
| Number of candidates submitted for councils of cities holding county rights | 98 | 47 | 47,96% | 51 | 52,04% |
| Number of candidates submitted for districts councils of the cap. city of Warsaw | 0 | 0 | - | 0 | - |
| Number of candidates registered for communal councils | 27 | 7 | 25,93% | 20 | 74,07% |
| Number of candidates submitted for reeve, mayor and presidential elections | 3 | 0 | 0,00% | 3 | 100,00% |
| Totalling | 153 | 57 | 37,25% | 96 | 62,75% |
| Average age of submitted candidates | |||
| Specification | Average age | Average age of women | Average age of men |
| Average age of candidates submitted for the province council | 47 | 35 | 49 |
| Average age of candidates submitted for county councils | 44 | - | 44 |
| Average age of candidates for councils of cities holding county rights | 46 | 42 | 49 |
| Average age of candidates for districts councils of the cap. city of Warsaw | - | - | - |
| Average age of candidates submitted for communal councils | 42 | 36 | 45 |
| Average age of candidates for reeve, mayor, president | 55 | - | 55 |
| Totalling | 45 | 40 | 48 |
| Submitted candidates for councils grouped by age | |||||
| Age | Number of candidates | Women | Women (%) | Men | Men (%) |
| 18-29 | 20 | 11 | 55,00% | 9 | 45,00% |
| 30-39 | 36 | 15 | 41,67% | 21 | 58,33% |
| 40-59 | 66 | 27 | 40,91% | 39 | 59,09% |
| 60+ | 28 | 4 | 14,29% | 24 | 85,71% |
| Totalling | 150 | 57 | 38,00% | 93 | 62,00% |
| Submitted candidates for reeve, mayor, president grouped by age | |||||
| Age | Number of candidates | Women | Women (%) | Men | Men (%) |
| 25-29 | 0 | 0 | - | 0 | - |
| 30-39 | 0 | 0 | - | 0 | - |
| 40-59 | 2 | 0 | 0,00% | 2 | 100,00% |
| 60+ | 1 | 0 | 0,00% | 1 | 100,00% |
| Totalling | 3 | 0 | 0,00% | 3 | 100,00% |
| The youngest and oldest submitted candidate for councils | ||
| Age | Institution | |
| Youngest | 19 | Rada m.st. Warszawy |
| Oldest | 83 | Rada m.st. Warszawy |
| The youngest and oldest submitted candidate for reeve, mayor, president | ||
| Age | Institution | |
| Youngest | 47 | Prezydent m.st. Warszawy |
| Oldest | 68 | Wójt Gminy Czosnów |
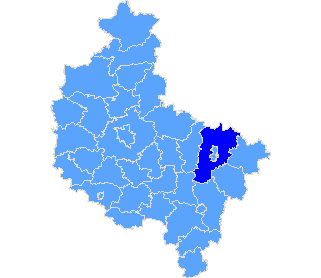
Province wielkopolskie
| Sejmik Województwa Wielkopolskiego |
| Submitted candidates | ||||||
| Specification | Number of candidates | Women | Women (%) | Men | Men (%) | Status |
| Constituency no. 1 | 6 | 2 | 33,33% | 4 | 66,67% | Registered |
| Constituency no. 4 | 7 | 0 | 0,00% | 7 | 100,00% | Registered |
| Totalling | 13 | 2 | 15,38% | 11 | 84,62% | |
| Age of the candidates | |||||
| Specification | Average age | Average age of women | Average age of men | Oldest | Youngest |
| Constituency no. 1 | 61 | 53 | 65 | 68 | 52 |
| Constituency no. 4 | 65 | - | 65 | 72 | 54 |
| Specification |
| pow. koniński |
| The statistics of election committe |
| Lists submitted | ||
| Specification | Number of | |
| lists | councils | |
| Lists submitted for province council | 2 | 1 |
| Lists submitted for county councils | 0 | 0 |
| Lists submitted for councils of cities holding county rights | 0 | 0 |
| Lists registered for communal councils | 3 | 2 |
| Totalling | 5 | 3 |
| Submitted candidates | |||||
| Specification | Number of candidates | Women | Women (%) | Men | Men (%) |
| Number of candidates submitted for the province council | 13 | 2 | 15,38% | 11 | 84,62% |
| Number of candidates submitted for county councils | 0 | 0 | - | 0 | - |
| Number of candidates submitted for councils of cities holding county rights | 0 | 0 | - | 0 | - |
| Number of candidates registered for communal councils | 4 | 2 | 50,00% | 2 | 50,00% |
| Number of candidates submitted for reeve, mayor and presidential elections | 0 | 0 | - | 0 | - |
| Totalling | 17 | 4 | 23,53% | 13 | 76,47% |
| Average age of submitted candidates | |||
| Specification | Average age | Average age of women | Average age of men |
| Average age of candidates submitted for the province council | 63 | 53 | 65 |
| Average age of candidates submitted for county councils | - | - | - |
| Average age of candidates for councils of cities holding county rights | - | - | - |
| Average age of candidates submitted for communal councils | 32 | 39 | 26 |
| Average age of candidates for reeve, mayor, president | - | - | - |
| Totalling | 55 | 46 | 59 |
| Submitted candidates for councils grouped by age | |||||
| Age | Number of candidates | Women | Women (%) | Men | Men (%) |
| 18-29 | 1 | 0 | 0,00% | 1 | 100,00% |
| 30-39 | 3 | 2 | 66,67% | 1 | 33,33% |
| 40-59 | 3 | 2 | 66,67% | 1 | 33,33% |
| 60+ | 10 | 0 | 0,00% | 10 | 100,00% |
| Totalling | 17 | 4 | 23,53% | 13 | 76,47% |
| Submitted candidates for reeve, mayor, president grouped by age | |||||
| Age | Number of candidates | Women | Women (%) | Men | Men (%) |
| 25-29 | 0 | 0 | - | 0 | - |
| 30-39 | 0 | 0 | - | 0 | - |
| 40-59 | 0 | 0 | - | 0 | - |
| 60+ | 0 | 0 | - | 0 | - |
| Totalling | 0 | 0 | - | 0 | - |
| The youngest and oldest submitted candidate for councils | ||
| Age | Institution | |
| Youngest | 22 | Rada Miejska w Rychwale |
| Oldest | 72 | Sejmik Województwa Wielkopolskiego |
