

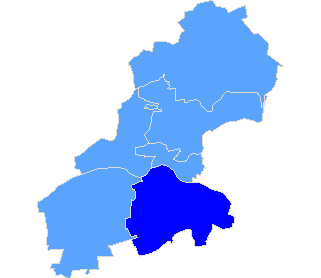
Powiat nowodworski
| Rada Powiatu Nowodworskiego |
| Submitted candidates | ||||||
| Specification | Number of candidates | Women | Women (%) | Men | Men (%) | Status |
| Constituency no. 4 | 3 | 0 | 0,00% | 3 | 100,00% | Registered |
| Totalling | 3 | 0 | 0,00% | 3 | 100,00% | |
| Age of the candidates | |||||
| Specification | Average age | Average age of women | Average age of men | Oldest | Youngest |
| Constituency no. 4 | 44 | - | 44 | 52 | 30 |
| The statistics of election committe |
| Lists submitted | ||
| Specification | Number of | |
| lists | councils | |
| Lists submitted for county councils | 1 | 1 |
| Lists registered for communal councils | 10 | 1 |
| Totalling | 11 | 2 |
| Submitted candidates | |||||
| Specification | Number of candidates | Women | Women (%) | Men | Men (%) |
| Number of candidates submitted for county councils | 3 | 0 | 0,00% | 3 | 100,00% |
| Number of candidates registered for communal councils | 10 | 1 | 10,00% | 9 | 90,00% |
| Number of candidates submitted for reeve, mayor and presidential elections | 1 | 0 | 0,00% | 1 | 100,00% |
| Totalling | 14 | 1 | 7,14% | 13 | 92,86% |
| Average age of submitted candidates | |||
| Specification | Average age | Average age of women | Average age of men |
| Average age of candidates submitted for county councils | 44 | - | 44 |
| Average age of candidates submitted for communal councils | 45 | 44 | 45 |
| Average age of candidates for reeve, mayor, president | 68 | - | 68 |
| Totalling | 46 | 44 | 46 |
| Submitted candidates for councils grouped by age | |||||
| Age | Number of candidates | Women | Women (%) | Men | Men (%) |
| 18-29 | 2 | 0 | 0,00% | 2 | 100,00% |
| 30-39 | 2 | 0 | 0,00% | 2 | 100,00% |
| 40-59 | 8 | 1 | 12,50% | 7 | 87,50% |
| 60+ | 1 | 0 | 0,00% | 1 | 100,00% |
| Totalling | 13 | 1 | 7,69% | 12 | 92,31% |
| Submitted candidates for reeve, mayor, president grouped by age | |||||
| Age | Number of candidates | Women | Women (%) | Men | Men (%) |
| 25-29 | 0 | 0 | - | 0 | - |
| 30-39 | 0 | 0 | - | 0 | - |
| 40-59 | 0 | 0 | - | 0 | - |
| 60+ | 1 | 0 | 0,00% | 1 | 100,00% |
| Totalling | 1 | 0 | 0,00% | 1 | 100,00% |
| The youngest and oldest submitted candidate for councils | ||
| Age | Institution | |
| Youngest | 26 | Rada Gminy Czosnów |
| Oldest | 65 | Rada Gminy Czosnów |
| The youngest and oldest submitted candidate for reeve, mayor, president | ||
| Age | Institution | |
| Youngest | 68 | Wójt Gminy Czosnów |
| Oldest | 68 | Wójt Gminy Czosnów |
| Wójt Gminy Czosnów |
| Number of | Family name and given names | Age | Education | Address, party membership and endorsements |
| 3 | Witaszek Zbigniew | 68 | wyższe | Czosnów, submitted by KOMITET WYBORCZY POLSKA PATRIOTYCZNA, member of Polski Patriotycznej |
| Rada Gminy Czosnów |
| Submitted candidates | ||||||
| Specification | Number of candidates | Women | Women (%) | Men | Men (%) | Status |
| Constituency no. 1 | 1 | 0 | 0,00% | 1 | 100,00% | Registered |
| Constituency no. 2 | 1 | 0 | 0,00% | 1 | 100,00% | Registered |
| Constituency no. 3 | 1 | 0 | 0,00% | 1 | 100,00% | Registered |
| Constituency no. 5 | 1 | 0 | 0,00% | 1 | 100,00% | Registered |
| Constituency no. 8 | 1 | 0 | 0,00% | 1 | 100,00% | Registered |
| Constituency no. 9 | 1 | 0 | 0,00% | 1 | 100,00% | Registered |
| Constituency no. 10 | 1 | 0 | 0,00% | 1 | 100,00% | Registered |
| Constituency no. 12 | 1 | 0 | 0,00% | 1 | 100,00% | Registered |
| Constituency no. 13 | 1 | 0 | 0,00% | 1 | 100,00% | Registered |
| Constituency no. 15 | 1 | 1 | 100,00% | 0 | 0,00% | Registered |
| Totalling | 10 | 1 | 10,00% | 9 | 90,00% | |
| Age of the candidates | |||||
| Specification | Average age | Average age of women | Average age of men | Oldest | Youngest |
| Constituency no. 1 | 65 | - | 65 | 65 | 65 |
| Constituency no. 2 | 58 | - | 58 | 58 | 58 |
| Constituency no. 3 | 46 | - | 46 | 46 | 46 |
| Constituency no. 5 | 50 | - | 50 | 50 | 50 |
| Constituency no. 8 | 32 | - | 32 | 32 | 32 |
| Constituency no. 9 | 51 | - | 51 | 51 | 51 |
| Constituency no. 10 | 27 | - | 27 | 27 | 27 |
| Constituency no. 12 | 47 | - | 47 | 47 | 47 |
| Constituency no. 13 | 26 | - | 26 | 26 | 26 |
| Constituency no. 15 | 44 | 44 | - | 44 | 44 |
| The statistics of election committe |
| Lists submitted | ||
| Specification | Number of | |
| lists | councils | |
| Lists registered for communal councils | 10 | 1 |
| Totalling | 10 | 1 |
| Submitted candidates | |||||
| Specification | Number of candidates | Women | Women (%) | Men | Men (%) |
| Number of candidates registered for communal councils | 10 | 1 | 10,00% | 9 | 90,00% |
| Number of candidates submitted for reeve, mayor and presidential elections | 1 | 0 | 0,00% | 1 | 100,00% |
| Totalling | 11 | 1 | 9,09% | 10 | 90,91% |
| Average age of submitted candidates | |||
| Specification | Average age | Average age of women | Average age of men |
| Average age of candidates submitted for communal councils | 45 | 44 | 45 |
| Average age of candidates for reeve, mayor, president | 68 | - | 68 |
| Totalling | 47 | 44 | 47 |
| Submitted candidates for councils grouped by age | |||||
| Age | Number of candidates | Women | Women (%) | Men | Men (%) |
| 18-29 | 2 | 0 | 0,00% | 2 | 100,00% |
| 30-39 | 1 | 0 | 0,00% | 1 | 100,00% |
| 40-59 | 6 | 1 | 16,67% | 5 | 83,33% |
| 60+ | 1 | 0 | 0,00% | 1 | 100,00% |
| Totalling | 10 | 1 | 10,00% | 9 | 90,00% |
| Submitted candidates for reeve, mayor, president grouped by age | |||||
| Age | Number of candidates | Women | Women (%) | Men | Men (%) |
| 25-29 | 0 | 0 | - | 0 | - |
| 30-39 | 0 | 0 | - | 0 | - |
| 40-59 | 0 | 0 | - | 0 | - |
| 60+ | 1 | 0 | 0,00% | 1 | 100,00% |
| Totalling | 1 | 0 | 0,00% | 1 | 100,00% |
| The youngest and oldest submitted candidate for councils | ||
| Age | Institution | |
| Youngest | 26 | Rada Gminy Czosnów |
| Oldest | 65 | Rada Gminy Czosnów |
| The youngest and oldest submitted candidate for reeve, mayor, president | ||
| Age | Institution | |
| Youngest | 68 | Wójt Gminy Czosnów |
| Oldest | 68 | Wójt Gminy Czosnów |
