

Rzeczpospolita Polska
| The statistics of election committe |
| Lists submitted | ||
| Specification | Number of | |
| lists | councils | |
| Lists submitted for provinces councils | 87 | 16 |
| Lists submitted for county councils | 1 242 | 299 |
| Lists submitted for councils of cities holding county rights | 293 | 64 |
| Lists submitted for districts councils of the cap. city of Warsaw | 70 | 18 |
| Lists registered for communal councils | 6 870 | 1 301 |
| Totalling | 8 562 | 1 698 |
| Submitted candidates | |||||
| Specification | Number of candidates | Women | Women (%) | Men | Men (%) |
| Number of candidates submitted for the province council | 1 097 | 268 | 24,43% | 829 | 75,57% |
| Number of candidates submitted for county councils | 10 027 | 2 800 | 27,92% | 7 227 | 72,08% |
| Number of candidates submitted for councils of cities holding county rights | 3 216 | 919 | 28,58% | 2 297 | 71,42% |
| Number of candidates submitted for districts councils of the cap. city of Warsaw | 707 | 238 | 33,66% | 469 | 66,34% |
| Number of candidates registered for communal councils | 16 008 | 5 241 | 32,74% | 10 767 | 67,26% |
| Number of candidates submitted for reeve, mayor and presidential elections | 763 | 105 | 13,76% | 658 | 86,24% |
| Totalling | 31 818 | 9 571 | 30,08% | 22 247 | 69,92% |
| Average age of submitted candidates | |||
| Specification | Average age | Average age of women | Average age of men |
| Average age of candidates submitted for the province council | 48 | 46 | 48 |
| Average age of candidates submitted for county councils | 46 | 45 | 46 |
| Average age of candidates for councils of cities holding county rights | 45 | 46 | 45 |
| Average age of candidates submitted for communal councils | 43 | 43 | 44 |
| Average age of candidates for reeve, mayor, president | 45 | 45 | 45 |
| Totalling | 44 | 44 | 44 |
| Submitted candidates for councils grouped by age | |||||
| Age | Number of candidates | Women | Women (%) | Men | Men (%) |
| 18-29 | 4 134 | 1 262 | 30,53% | 2 872 | 69,47% |
| 30-39 | 5 838 | 1 977 | 33,86% | 3 861 | 66,14% |
| 40-59 | 16 679 | 5 043 | 30,24% | 11 636 | 69,76% |
| 60+ | 4 404 | 1 184 | 26,88% | 3 220 | 73,12% |
| Totalling | 31 055 | 9 466 | 30,48% | 21 589 | 69,52% |
| Submitted candidates for reeve, mayor, president grouped by age | |||||
| Age | Number of candidates | Women | Women (%) | Men | Men (%) |
| 25-29 | 31 | 5 | 16,13% | 26 | 83,87% |
| 30-39 | 175 | 22 | 12,57% | 153 | 87,43% |
| 40-59 | 511 | 76 | 14,87% | 435 | 85,13% |
| 60+ | 46 | 2 | 4,35% | 44 | 95,65% |
| Totalling | 763 | 105 | 13,76% | 658 | 86,24% |
| The youngest and oldest submitted candidate for councils | ||
| Age | Institution | |
| Youngest | 18 | Rada Miejska w Świebodzinie |
| Oldest | 88 | Rada Powiatu Obornickiego |
| The youngest and oldest submitted candidate for reeve, mayor, president | ||
| Age | Institution | |
| Youngest | 25 | Wójt Gminy Raków |
| Oldest | 71 | Burmistrz Miasta Żywca |
Province dolnośląskie
| Sejmik Województwa Dolnośląskiego |
| Submitted candidates | ||||||
| Specification | Number of candidates | Women | Women (%) | Men | Men (%) | Status |
| Constituency no. 1 | 15 | 2 | 13,33% | 13 | 86,67% | Registered |
| Constituency no. 2 | 14 | 4 | 28,57% | 10 | 71,43% | Registered |
| Constituency no. 3 | 18 | 6 | 33,33% | 12 | 66,67% | Registered |
| Constituency no. 4 | 12 | 0 | 0,00% | 12 | 100,00% | Registered |
| Constituency no. 5 | 12 | 1 | 8,33% | 11 | 91,67% | Registered |
| Totalling | 71 | 13 | 18,31% | 58 | 81,69% | |
| Age of the candidates | |||||
| Specification | Average age | Average age of women | Average age of men | Oldest | Youngest |
| Constituency no. 1 | 59 | 68 | 58 | 79 | 34 |
| Constituency no. 2 | 43 | 36 | 45 | 65 | 23 |
| Constituency no. 3 | 49 | 52 | 47 | 75 | 21 |
| Constituency no. 4 | 53 | - | 53 | 66 | 37 |
| Constituency no. 5 | 50 | 57 | 49 | 62 | 30 |
| The statistics of election committe |
| Lists submitted | ||
| Specification | Number of | |
| lists | councils | |
| Lists submitted for province council | 5 | 1 |
| Lists submitted for county councils | 86 | 21 |
| Lists submitted for councils of cities holding county rights | 16 | 3 |
| Lists registered for communal councils | 343 | 73 |
| Totalling | 450 | 98 |
| Submitted candidates | |||||
| Specification | Number of candidates | Women | Women (%) | Men | Men (%) |
| Number of candidates submitted for the province council | 71 | 13 | 18,31% | 58 | 81,69% |
| Number of candidates submitted for county councils | 712 | 232 | 32,58% | 480 | 67,42% |
| Number of candidates submitted for councils of cities holding county rights | 166 | 45 | 27,11% | 121 | 72,89% |
| Number of candidates registered for communal councils | 1 122 | 387 | 34,49% | 735 | 65,51% |
| Number of candidates submitted for reeve, mayor and presidential elections | 47 | 7 | 14,89% | 40 | 85,11% |
| Totalling | 2 118 | 684 | 32,29% | 1 434 | 67,71% |
| Average age of submitted candidates | |||
| Specification | Average age | Average age of women | Average age of men |
| Average age of candidates submitted for the province council | 51 | 50 | 51 |
| Average age of candidates submitted for county councils | 46 | 44 | 47 |
| Average age of candidates for councils of cities holding county rights | 44 | 46 | 43 |
| Average age of candidates submitted for communal councils | 44 | 44 | 44 |
| Average age of candidates for reeve, mayor, president | 44 | 47 | 44 |
| Totalling | 44 | 44 | 45 |
| Submitted candidates for councils grouped by age | |||||
| Age | Number of candidates | Women | Women (%) | Men | Men (%) |
| 18-29 | 328 | 107 | 32,62% | 221 | 67,38% |
| 30-39 | 357 | 130 | 36,41% | 227 | 63,59% |
| 40-59 | 1 082 | 355 | 32,81% | 727 | 67,19% |
| 60+ | 304 | 85 | 27,96% | 219 | 72,04% |
| Totalling | 2 071 | 677 | 32,69% | 1 394 | 67,31% |
| Submitted candidates for reeve, mayor, president grouped by age | |||||
| Age | Number of candidates | Women | Women (%) | Men | Men (%) |
| 25-29 | 0 | 0 | - | 0 | - |
| 30-39 | 17 | 2 | 11,76% | 15 | 88,24% |
| 40-59 | 29 | 5 | 17,24% | 24 | 82,76% |
| 60+ | 1 | 0 | 0,00% | 1 | 100,00% |
| Totalling | 47 | 7 | 14,89% | 40 | 85,11% |
| The youngest and oldest submitted candidate for councils | ||
| Age | Institution | |
| Youngest | 18 | Rada Powiatu Dzierżoniowskiego |
| Oldest | 83 | Rada Miejska w Kłodzku |
| The youngest and oldest submitted candidate for reeve, mayor, president | ||
| Age | Institution | |
| Youngest | 30 | Burmistrz Miasta Oleśnicy |
| Oldest | 63 | Burmistrz Miasta Boguszowa - Gorc |
Province kujawsko-pomorskie

| Sejmik Województwa Kujawsko-Pomorskiego |
| Submitted candidates | ||||||
| Specification | Number of candidates | Women | Women (%) | Men | Men (%) | Status |
| Constituency no. 1 | 11 | 2 | 18,18% | 9 | 81,82% | Registered |
| Constituency no. 2 | 11 | 3 | 27,27% | 8 | 72,73% | Registered |
| Constituency no. 3 | 10 | 2 | 20,00% | 8 | 80,00% | Registered |
| Constituency no. 4 | 10 | 3 | 30,00% | 7 | 70,00% | Registered |
| Constituency no. 5 | 9 | 3 | 33,33% | 6 | 66,67% | Registered |
| Constituency no. 6 | 12 | 3 | 25,00% | 9 | 75,00% | Registered |
| Totalling | 63 | 16 | 25,40% | 47 | 74,60% | |
| Age of the candidates | |||||
| Specification | Average age | Average age of women | Average age of men | Oldest | Youngest |
| Constituency no. 1 | 45 | 33 | 47 | 63 | 19 |
| Constituency no. 2 | 46 | 49 | 45 | 77 | 22 |
| Constituency no. 3 | 43 | 52 | 41 | 63 | 25 |
| Constituency no. 4 | 43 | 38 | 45 | 58 | 25 |
| Constituency no. 5 | 44 | 43 | 45 | 61 | 20 |
| Constituency no. 6 | 44 | 33 | 47 | 62 | 25 |
| The statistics of election committe |
| Lists submitted | ||
| Specification | Number of | |
| lists | councils | |
| Lists submitted for province council | 6 | 1 |
| Lists submitted for county councils | 76 | 19 |
| Lists submitted for councils of cities holding county rights | 19 | 4 |
| Lists registered for communal councils | 241 | 57 |
| Totalling | 342 | 81 |
| Submitted candidates | |||||
| Specification | Number of candidates | Women | Women (%) | Men | Men (%) |
| Number of candidates submitted for the province council | 63 | 16 | 25,40% | 47 | 74,60% |
| Number of candidates submitted for county councils | 536 | 144 | 26,87% | 392 | 73,13% |
| Number of candidates submitted for councils of cities holding county rights | 201 | 55 | 27,36% | 146 | 72,64% |
| Number of candidates registered for communal councils | 584 | 184 | 31,51% | 400 | 68,49% |
| Number of candidates submitted for reeve, mayor and presidential elections | 31 | 4 | 12,90% | 27 | 87,10% |
| Totalling | 1 415 | 403 | 28,48% | 1 012 | 71,52% |
| Average age of submitted candidates | |||
| Specification | Average age | Average age of women | Average age of men |
| Average age of candidates submitted for the province council | 44 | 41 | 45 |
| Average age of candidates submitted for county councils | 45 | 44 | 46 |
| Average age of candidates for councils of cities holding county rights | 46 | 47 | 45 |
| Average age of candidates submitted for communal councils | 43 | 43 | 43 |
| Average age of candidates for reeve, mayor, president | 45 | 48 | 45 |
| Totalling | 44 | 43 | 44 |
| Submitted candidates for councils grouped by age | |||||
| Age | Number of candidates | Women | Women (%) | Men | Men (%) |
| 18-29 | 216 | 57 | 26,39% | 159 | 73,61% |
| 30-39 | 284 | 92 | 32,39% | 192 | 67,61% |
| 40-59 | 692 | 197 | 28,47% | 495 | 71,53% |
| 60+ | 192 | 53 | 27,60% | 139 | 72,40% |
| Totalling | 1 384 | 399 | 28,83% | 985 | 71,17% |
| Submitted candidates for reeve, mayor, president grouped by age | |||||
| Age | Number of candidates | Women | Women (%) | Men | Men (%) |
| 25-29 | 1 | 0 | 0,00% | 1 | 100,00% |
| 30-39 | 9 | 1 | 11,11% | 8 | 88,89% |
| 40-59 | 16 | 2 | 12,50% | 14 | 87,50% |
| 60+ | 5 | 1 | 20,00% | 4 | 80,00% |
| Totalling | 31 | 4 | 12,90% | 27 | 87,10% |
| The youngest and oldest submitted candidate for councils | ||
| Age | Institution | |
| Youngest | 18 | Rada Miejska w Piotrkowie Kujawskim |
| Oldest | 82 | Rada Miejska w Lubrańcu |
| The youngest and oldest submitted candidate for reeve, mayor, president | ||
| Age | Institution | |
| Youngest | 26 | Burmistrz Miasta Kowalewo Pomorskie |
| Oldest | 67 | Wójt Gminy Raciążek |
Province lubelskie
| Sejmik Województwa Lubelskiego |
| Submitted candidates | ||||||
| Specification | Number of candidates | Women | Women (%) | Men | Men (%) | Status |
| Constituency no. 1 | 10 | 4 | 40,00% | 6 | 60,00% | Registered |
| Constituency no. 2 | 18 | 3 | 16,67% | 15 | 83,33% | Registered |
| Constituency no. 3 | 12 | 3 | 25,00% | 9 | 75,00% | Registered |
| Constituency no. 4 | 12 | 2 | 16,67% | 10 | 83,33% | Registered |
| Constituency no. 5 | 13 | 2 | 15,38% | 11 | 84,62% | Registered |
| Totalling | 65 | 14 | 21,54% | 51 | 78,46% | |
| Age of the candidates | |||||
| Specification | Average age | Average age of women | Average age of men | Oldest | Youngest |
| Constituency no. 1 | 54 | 51 | 56 | 71 | 30 |
| Constituency no. 2 | 46 | 33 | 49 | 64 | 24 |
| Constituency no. 3 | 45 | 40 | 47 | 55 | 22 |
| Constituency no. 4 | 51 | 53 | 51 | 61 | 32 |
| Constituency no. 5 | 48 | 37 | 50 | 68 | 30 |
| The statistics of election committe |
| Lists submitted | ||
| Specification | Number of | |
| lists | councils | |
| Lists submitted for province council | 5 | 1 |
| Lists submitted for county councils | 88 | 20 |
| Lists submitted for councils of cities holding county rights | 18 | 4 |
| Lists registered for communal councils | 848 | 136 |
| Totalling | 959 | 161 |
| Submitted candidates | |||||
| Specification | Number of candidates | Women | Women (%) | Men | Men (%) |
| Number of candidates submitted for the province council | 65 | 14 | 21,54% | 51 | 78,46% |
| Number of candidates submitted for county councils | 793 | 177 | 22,32% | 616 | 77,68% |
| Number of candidates submitted for councils of cities holding county rights | 200 | 69 | 34,50% | 131 | 65,50% |
| Number of candidates registered for communal councils | 1 546 | 503 | 32,54% | 1 043 | 67,46% |
| Number of candidates submitted for reeve, mayor and presidential elections | 88 | 9 | 10,23% | 79 | 89,77% |
| Totalling | 2 692 | 772 | 28,68% | 1 920 | 71,32% |
| Average age of submitted candidates | |||
| Specification | Average age | Average age of women | Average age of men |
| Average age of candidates submitted for the province council | 48 | 43 | 50 |
| Average age of candidates submitted for county councils | 47 | 46 | 48 |
| Average age of candidates for councils of cities holding county rights | 46 | 49 | 45 |
| Average age of candidates submitted for communal councils | 43 | 42 | 44 |
| Average age of candidates for reeve, mayor, president | 46 | 49 | 46 |
| Totalling | 44 | 43 | 45 |
| Submitted candidates for councils grouped by age | |||||
| Age | Number of candidates | Women | Women (%) | Men | Men (%) |
| 18-29 | 249 | 72 | 28,92% | 177 | 71,08% |
| 30-39 | 542 | 198 | 36,53% | 344 | 63,47% |
| 40-59 | 1 538 | 431 | 28,02% | 1 107 | 71,98% |
| 60+ | 275 | 62 | 22,55% | 213 | 77,45% |
| Totalling | 2 604 | 763 | 29,30% | 1 841 | 70,70% |
| Submitted candidates for reeve, mayor, president grouped by age | |||||
| Age | Number of candidates | Women | Women (%) | Men | Men (%) |
| 25-29 | 2 | 0 | 0,00% | 2 | 100,00% |
| 30-39 | 15 | 1 | 6,67% | 14 | 93,33% |
| 40-59 | 67 | 8 | 11,94% | 59 | 88,06% |
| 60+ | 4 | 0 | 0,00% | 4 | 100,00% |
| Totalling | 88 | 9 | 10,23% | 79 | 89,77% |
| The youngest and oldest submitted candidate for councils | ||
| Age | Institution | |
| Youngest | 18 | Rada Miasta Puławy |
| Oldest | 85 | Rada Powiatu we Włodawie |
| The youngest and oldest submitted candidate for reeve, mayor, president | ||
| Age | Institution | |
| Youngest | 26 | Wójt Gminy Rudnik |
| Oldest | 65 | Wójt Gminy Biała Podlaska |
Province lubuskie
| Sejmik Województwa Lubuskiego |
| Submitted candidates | ||||||
| Specification | Number of candidates | Women | Women (%) | Men | Men (%) | Status |
| Constituency no. 1 | 14 | 6 | 42,86% | 8 | 57,14% | Registered |
| Constituency no. 2 | 12 | 2 | 16,67% | 10 | 83,33% | Registered |
| Constituency no. 3 | 10 | 2 | 20,00% | 8 | 80,00% | Registered |
| Constituency no. 4 | 12 | 1 | 8,33% | 11 | 91,67% | Registered |
| Constituency no. 5 | 12 | 3 | 25,00% | 9 | 75,00% | Registered |
| Totalling | 60 | 14 | 23,33% | 46 | 76,67% | |
| Age of the candidates | |||||
| Specification | Average age | Average age of women | Average age of men | Oldest | Youngest |
| Constituency no. 1 | 51 | 46 | 54 | 71 | 22 |
| Constituency no. 2 | 46 | 44 | 46 | 58 | 25 |
| Constituency no. 3 | 51 | 50 | 51 | 66 | 26 |
| Constituency no. 4 | 53 | 59 | 53 | 79 | 37 |
| Constituency no. 5 | 47 | 52 | 46 | 60 | 33 |
| The statistics of election committe |
| Lists submitted | ||
| Specification | Number of | |
| lists | councils | |
| Lists submitted for province council | 5 | 1 |
| Lists submitted for county councils | 40 | 12 |
| Lists submitted for councils of cities holding county rights | 10 | 2 |
| Lists registered for communal councils | 105 | 31 |
| Totalling | 160 | 46 |
| Submitted candidates | |||||
| Specification | Number of candidates | Women | Women (%) | Men | Men (%) |
| Number of candidates submitted for the province council | 60 | 14 | 23,33% | 46 | 76,67% |
| Number of candidates submitted for county councils | 345 | 101 | 29,28% | 244 | 70,72% |
| Number of candidates submitted for councils of cities holding county rights | 100 | 28 | 28,00% | 72 | 72,00% |
| Number of candidates registered for communal councils | 371 | 145 | 39,08% | 226 | 60,92% |
| Number of candidates submitted for reeve, mayor and presidential elections | 16 | 5 | 31,25% | 11 | 68,75% |
| Totalling | 892 | 293 | 32,85% | 599 | 67,15% |
| Average age of submitted candidates | |||
| Specification | Average age | Average age of women | Average age of men |
| Average age of candidates submitted for the province council | 50 | 48 | 50 |
| Average age of candidates submitted for county councils | 49 | 49 | 49 |
| Average age of candidates for councils of cities holding county rights | 47 | 49 | 47 |
| Average age of candidates submitted for communal councils | 44 | 42 | 45 |
| Average age of candidates for reeve, mayor, president | 47 | 52 | 44 |
| Totalling | 46 | 45 | 47 |
| Submitted candidates for councils grouped by age | |||||
| Age | Number of candidates | Women | Women (%) | Men | Men (%) |
| 18-29 | 114 | 45 | 39,47% | 69 | 60,53% |
| 30-39 | 137 | 48 | 35,04% | 89 | 64,96% |
| 40-59 | 462 | 153 | 33,12% | 309 | 66,88% |
| 60+ | 163 | 42 | 25,77% | 121 | 74,23% |
| Totalling | 876 | 288 | 32,88% | 588 | 67,12% |
| Submitted candidates for reeve, mayor, president grouped by age | |||||
| Age | Number of candidates | Women | Women (%) | Men | Men (%) |
| 25-29 | 0 | 0 | - | 0 | - |
| 30-39 | 4 | 0 | 0,00% | 4 | 100,00% |
| 40-59 | 12 | 5 | 41,67% | 7 | 58,33% |
| 60+ | 0 | 0 | - | 0 | - |
| Totalling | 16 | 5 | 31,25% | 11 | 68,75% |
| The youngest and oldest submitted candidate for councils | ||
| Age | Institution | |
| Youngest | 18 | Rada Miejska w Szprotawie |
| Oldest | 79 | Sejmik Województwa Lubuskiego |
| The youngest and oldest submitted candidate for reeve, mayor, president | ||
| Age | Institution | |
| Youngest | 30 | Burmistrz Krosna Odrzańskiego |
| Oldest | 55 | Prezydent Miasta Gorzowa Wielkopolskiego |
Province łódzkie
| Sejmik Województwa Łódzkiego |
| Submitted candidates | ||||||
| Specification | Number of candidates | Women | Women (%) | Men | Men (%) | Status |
| Constituency no. 1 | 10 | 3 | 30,00% | 7 | 70,00% | Registered |
| Constituency no. 2 | 10 | 3 | 30,00% | 7 | 70,00% | Registered |
| Constituency no. 3 | 12 | 6 | 50,00% | 6 | 50,00% | Registered |
| Constituency no. 4 | 16 | 6 | 37,50% | 10 | 62,50% | Registered |
| Constituency no. 5 | 14 | 2 | 14,29% | 12 | 85,71% | Registered |
| Constituency no. 6 | 10 | 6 | 60,00% | 4 | 40,00% | Registered |
| Totalling | 72 | 26 | 36,11% | 46 | 63,89% | |
| Age of the candidates | |||||
| Specification | Average age | Average age of women | Average age of men | Oldest | Youngest |
| Constituency no. 1 | 46 | 50 | 44 | 68 | 24 |
| Constituency no. 2 | 50 | 50 | 50 | 73 | 20 |
| Constituency no. 3 | 41 | 45 | 38 | 61 | 20 |
| Constituency no. 4 | 46 | 47 | 45 | 75 | 26 |
| Constituency no. 5 | 42 | 47 | 42 | 62 | 26 |
| Constituency no. 6 | 45 | 37 | 55 | 65 | 25 |
| The statistics of election committe |
| Lists submitted | ||
| Specification | Number of | |
| lists | councils | |
| Lists submitted for province council | 6 | 1 |
| Lists submitted for county councils | 92 | 21 |
| Lists submitted for councils of cities holding county rights | 16 | 3 |
| Lists registered for communal councils | 705 | 122 |
| Totalling | 819 | 147 |
| Submitted candidates | |||||
| Specification | Number of candidates | Women | Women (%) | Men | Men (%) |
| Number of candidates submitted for the province council | 72 | 26 | 36,11% | 46 | 63,89% |
| Number of candidates submitted for county councils | 806 | 222 | 27,54% | 584 | 72,46% |
| Number of candidates submitted for councils of cities holding county rights | 173 | 54 | 31,21% | 119 | 68,79% |
| Number of candidates registered for communal councils | 1 481 | 522 | 35,25% | 959 | 64,75% |
| Number of candidates submitted for reeve, mayor and presidential elections | 80 | 14 | 17,50% | 66 | 82,50% |
| Totalling | 2 612 | 838 | 32,08% | 1 774 | 67,92% |
| Average age of submitted candidates | |||
| Specification | Average age | Average age of women | Average age of men |
| Average age of candidates submitted for the province council | 45 | 45 | 45 |
| Average age of candidates submitted for county councils | 45 | 44 | 45 |
| Average age of candidates for councils of cities holding county rights | 43 | 44 | 43 |
| Average age of candidates submitted for communal councils | 42 | 41 | 43 |
| Average age of candidates for reeve, mayor, president | 44 | 40 | 44 |
| Totalling | 43 | 42 | 43 |
| Submitted candidates for councils grouped by age | |||||
| Age | Number of candidates | Women | Women (%) | Men | Men (%) |
| 18-29 | 420 | 134 | 31,90% | 286 | 68,10% |
| 30-39 | 563 | 211 | 37,48% | 352 | 62,52% |
| 40-59 | 1 249 | 393 | 31,47% | 856 | 68,53% |
| 60+ | 300 | 86 | 28,67% | 214 | 71,33% |
| Totalling | 2 532 | 824 | 32,54% | 1 708 | 67,46% |
| Submitted candidates for reeve, mayor, president grouped by age | |||||
| Age | Number of candidates | Women | Women (%) | Men | Men (%) |
| 25-29 | 7 | 2 | 28,57% | 5 | 71,43% |
| 30-39 | 20 | 4 | 20,00% | 16 | 80,00% |
| 40-59 | 48 | 8 | 16,67% | 40 | 83,33% |
| 60+ | 5 | 0 | 0,00% | 5 | 100,00% |
| Totalling | 80 | 14 | 17,50% | 66 | 82,50% |
| The youngest and oldest submitted candidate for councils | ||
| Age | Institution | |
| Youngest | 18 | Rada Miejska w Ozorkowie |
| Oldest | 83 | Rada Powiatu Radomszczańskiego |
| The youngest and oldest submitted candidate for reeve, mayor, president | ||
| Age | Institution | |
| Youngest | 26 | Wójt Gminy Klonowa |
| Oldest | 68 | Wójt Gminy Skomlin |
Province małopolskie
| Sejmik Województwa Małopolskiego |
| Submitted candidates | ||||||
| Specification | Number of candidates | Women | Women (%) | Men | Men (%) | Status |
| Constituency no. 1 | 10 | 3 | 30,00% | 7 | 70,00% | Registered |
| Constituency no. 2 | 11 | 2 | 18,18% | 9 | 81,82% | Registered |
| Constituency no. 3 | 16 | 5 | 31,25% | 11 | 68,75% | Registered |
| Constituency no. 4 | 14 | 2 | 14,29% | 12 | 85,71% | Registered |
| Constituency no. 5 | 14 | 5 | 35,71% | 9 | 64,29% | Registered |
| Constituency no. 6 | 12 | 4 | 33,33% | 8 | 66,67% | Registered |
| Totalling | 77 | 21 | 27,27% | 56 | 72,73% | |
| Age of the candidates | |||||
| Specification | Average age | Average age of women | Average age of men | Oldest | Youngest |
| Constituency no. 1 | 50 | 40 | 55 | 67 | 26 |
| Constituency no. 2 | 49 | 44 | 50 | 59 | 31 |
| Constituency no. 3 | 48 | 44 | 50 | 72 | 25 |
| Constituency no. 4 | 49 | 61 | 47 | 78 | 23 |
| Constituency no. 5 | 50 | 52 | 49 | 69 | 27 |
| Constituency no. 6 | 46 | 42 | 48 | 62 | 25 |
| The statistics of election committe |
| Lists submitted | ||
| Specification | Number of | |
| lists | councils | |
| Lists submitted for province council | 6 | 1 |
| Lists submitted for county councils | 93 | 19 |
| Lists submitted for councils of cities holding county rights | 15 | 3 |
| Lists registered for communal councils | 504 | 106 |
| Totalling | 618 | 129 |
| Submitted candidates | |||||
| Specification | Number of candidates | Women | Women (%) | Men | Men (%) |
| Number of candidates submitted for the province council | 77 | 21 | 27,27% | 56 | 72,73% |
| Number of candidates submitted for county councils | 803 | 221 | 27,52% | 582 | 72,48% |
| Number of candidates submitted for councils of cities holding county rights | 179 | 41 | 22,91% | 138 | 77,09% |
| Number of candidates registered for communal councils | 1 388 | 453 | 32,64% | 935 | 67,36% |
| Number of candidates submitted for reeve, mayor and presidential elections | 62 | 9 | 14,52% | 53 | 85,48% |
| Totalling | 2 509 | 745 | 29,69% | 1 764 | 70,31% |
| Average age of submitted candidates | |||
| Specification | Average age | Average age of women | Average age of men |
| Average age of candidates submitted for the province council | 49 | 47 | 49 |
| Average age of candidates submitted for county councils | 47 | 47 | 47 |
| Average age of candidates for councils of cities holding county rights | 47 | 50 | 46 |
| Average age of candidates submitted for communal councils | 44 | 43 | 44 |
| Average age of candidates for reeve, mayor, president | 45 | 44 | 45 |
| Totalling | 45 | 44 | 45 |
| Submitted candidates for councils grouped by age | |||||
| Age | Number of candidates | Women | Women (%) | Men | Men (%) |
| 18-29 | 298 | 85 | 28,52% | 213 | 71,48% |
| 30-39 | 436 | 150 | 34,40% | 286 | 65,60% |
| 40-59 | 1 386 | 411 | 29,65% | 975 | 70,35% |
| 60+ | 327 | 90 | 27,52% | 237 | 72,48% |
| Totalling | 2 447 | 736 | 30,08% | 1 711 | 69,92% |
| Submitted candidates for reeve, mayor, president grouped by age | |||||
| Age | Number of candidates | Women | Women (%) | Men | Men (%) |
| 25-29 | 5 | 0 | 0,00% | 5 | 100,00% |
| 30-39 | 14 | 3 | 21,43% | 11 | 78,57% |
| 40-59 | 41 | 6 | 14,63% | 35 | 85,37% |
| 60+ | 2 | 0 | 0,00% | 2 | 100,00% |
| Totalling | 62 | 9 | 14,52% | 53 | 85,48% |
| The youngest and oldest submitted candidate for councils | ||
| Age | Institution | |
| Youngest | 18 | Rada Miejska w Chrzanowie |
| Oldest | 84 | Rada Miasta Trzebini |
| The youngest and oldest submitted candidate for reeve, mayor, president | ||
| Age | Institution | |
| Youngest | 25 | Burmistrz Chełmka |
| Oldest | 66 | Wójt Gminy Kamionka Wielka |
Province mazowieckie
| Sejmik Województwa Mazowieckiego |
| Submitted candidates | ||||||
| Specification | Number of candidates | Women | Women (%) | Men | Men (%) | Status |
| Constituency no. 1 | 10 | 5 | 50,00% | 5 | 50,00% | Registered |
| Constituency no. 2 | 11 | 8 | 72,73% | 3 | 27,27% | Registered |
| Constituency no. 3 | 10 | 2 | 20,00% | 8 | 80,00% | Registered |
| Constituency no. 4 | 18 | 4 | 22,22% | 14 | 77,78% | Registered |
| Constituency no. 5 | 14 | 2 | 14,29% | 12 | 85,71% | Registered |
| Constituency no. 6 | 18 | 1 | 5,56% | 17 | 94,44% | Registered |
| Constituency no. 7 | 19 | 8 | 42,11% | 11 | 57,89% | Registered |
| Totalling | 100 | 30 | 30,00% | 70 | 70,00% | |
| Age of the candidates | |||||
| Specification | Average age | Average age of women | Average age of men | Oldest | Youngest |
| Constituency no. 1 | 52 | 57 | 48 | 72 | 35 |
| Constituency no. 2 | 48 | 47 | 50 | 68 | 24 |
| Constituency no. 3 | 48 | 42 | 50 | 68 | 20 |
| Constituency no. 4 | 48 | 50 | 47 | 62 | 30 |
| Constituency no. 5 | 47 | 49 | 47 | 76 | 19 |
| Constituency no. 6 | 44 | 46 | 44 | 57 | 31 |
| Constituency no. 7 | 38 | 33 | 41 | 63 | 23 |
| The statistics of election committe |
| Lists submitted | ||
| Specification | Number of | |
| lists | councils | |
| Lists submitted for province council | 7 | 1 |
| Lists submitted for county councils | 152 | 36 |
| Lists submitted for councils of cities holding county rights | 25 | 5 |
| Lists submitted for districts councils of the cap. city of Warsaw | 70 | 18 |
| Lists registered for communal councils | 1 228 | 200 |
| Totalling | 1 482 | 260 |
| Submitted candidates | |||||
| Specification | Number of candidates | Women | Women (%) | Men | Men (%) |
| Number of candidates submitted for the province council | 100 | 30 | 30,00% | 70 | 70,00% |
| Number of candidates submitted for county councils | 1 276 | 351 | 27,51% | 925 | 72,49% |
| Number of candidates submitted for councils of cities holding county rights | 274 | 76 | 27,74% | 198 | 72,26% |
| Number of candidates submitted for districts councils of the cap. city of Warsaw | 707 | 238 | 33,66% | 469 | 66,34% |
| Number of candidates registered for communal councils | 2 391 | 806 | 33,71% | 1 585 | 66,29% |
| Number of candidates submitted for reeve, mayor and presidential elections | 120 | 19 | 15,83% | 101 | 84,17% |
| Totalling | 4 868 | 1 520 | 31,22% | 3 348 | 68,78% |
| Average age of submitted candidates | |||
| Specification | Average age | Average age of women | Average age of men |
| Average age of candidates submitted for the province council | 46 | 45 | 46 |
| Average age of candidates submitted for county councils | 47 | 47 | 46 |
| Average age of candidates for councils of cities holding county rights | 45 | 47 | 45 |
| Average age of candidates for districts councils of the cap. city of Warsaw | 46 | 48 | 45 |
| Average age of candidates submitted for communal councils | 43 | 43 | 44 |
| Average age of candidates for reeve, mayor, president | 45 | 44 | 45 |
| Totalling | 44 | 44 | 44 |
| Submitted candidates for councils grouped by age | |||||
| Age | Number of candidates | Women | Women (%) | Men | Men (%) |
| 18-29 | 672 | 189 | 28,13% | 483 | 71,88% |
| 30-39 | 927 | 302 | 32,58% | 625 | 67,42% |
| 40-59 | 2 493 | 793 | 31,81% | 1 700 | 68,19% |
| 60+ | 656 | 217 | 33,08% | 439 | 66,92% |
| Totalling | 4 748 | 1 501 | 31,61% | 3 247 | 68,39% |
| Submitted candidates for reeve, mayor, president grouped by age | |||||
| Age | Number of candidates | Women | Women (%) | Men | Men (%) |
| 25-29 | 7 | 1 | 14,29% | 6 | 85,71% |
| 30-39 | 30 | 6 | 20,00% | 24 | 80,00% |
| 40-59 | 77 | 12 | 15,58% | 65 | 84,42% |
| 60+ | 6 | 0 | 0,00% | 6 | 100,00% |
| Totalling | 120 | 19 | 15,83% | 101 | 84,17% |
| The youngest and oldest submitted candidate for councils | ||
| Age | Institution | |
| Youngest | 18 | Rada Dzielnicy Targówek m. st. Warszawy |
| Oldest | 87 | Rada Dzielnicy Bielany m.st. Warszawy |
| The youngest and oldest submitted candidate for reeve, mayor, president | ||
| Age | Institution | |
| Youngest | 25 | Wójt Gminy Dzierzążnia |
| Oldest | 64 | Wójt Gminy Przytyk |
Province opolskie
| Sejmik Województwa Opolskiego |
| Submitted candidates | ||||||
| Specification | Number of candidates | Women | Women (%) | Men | Men (%) | Status |
| Constituency no. 1 | 14 | 4 | 28,57% | 10 | 71,43% | Registered |
| Constituency no. 2 | 12 | 1 | 8,33% | 11 | 91,67% | Registered |
| Constituency no. 3 | 10 | 3 | 30,00% | 7 | 70,00% | Registered |
| Constituency no. 4 | 10 | 2 | 20,00% | 8 | 80,00% | Registered |
| Constituency no. 5 | 14 | 0 | 0,00% | 14 | 100,00% | Registered |
| Totalling | 60 | 10 | 16,67% | 50 | 83,33% | |
| Age of the candidates | |||||
| Specification | Average age | Average age of women | Average age of men | Oldest | Youngest |
| Constituency no. 1 | 52 | 59 | 49 | 72 | 27 |
| Constituency no. 2 | 42 | 53 | 41 | 67 | 19 |
| Constituency no. 3 | 51 | 41 | 55 | 71 | 29 |
| Constituency no. 4 | 52 | 44 | 54 | 71 | 29 |
| Constituency no. 5 | 50 | - | 50 | 69 | 25 |
| Specification |
| m. Opole |
| pow. brzeski |
| pow. głubczycki |
| pow. kędzierzyńsko-kozielski |
| pow. kluczborski |
| pow. krapkowicki |
| pow. namysłowski |
| pow. nyski |
| pow. oleski |
| pow. opolski |
| pow. prudnicki |
| pow. strzelecki |
| The statistics of election committe |
| Lists submitted | ||
| Specification | Number of | |
| lists | councils | |
| Lists submitted for province council | 5 | 1 |
| Lists submitted for county councils | 40 | 10 |
| Lists submitted for councils of cities holding county rights | 5 | 1 |
| Lists registered for communal councils | 141 | 33 |
| Totalling | 191 | 45 |
| Submitted candidates | |||||
| Specification | Number of candidates | Women | Women (%) | Men | Men (%) |
| Number of candidates submitted for the province council | 60 | 10 | 16,67% | 50 | 83,33% |
| Number of candidates submitted for county councils | 311 | 73 | 23,47% | 238 | 76,53% |
| Number of candidates submitted for councils of cities holding county rights | 50 | 17 | 34,00% | 33 | 66,00% |
| Number of candidates registered for communal councils | 440 | 141 | 32,05% | 299 | 67,95% |
| Number of candidates submitted for reeve, mayor and presidential elections | 20 | 4 | 20,00% | 16 | 80,00% |
| Totalling | 881 | 245 | 27,81% | 636 | 72,19% |
| Average age of submitted candidates | |||
| Specification | Average age | Average age of women | Average age of men |
| Average age of candidates submitted for the province council | 49 | 50 | 49 |
| Average age of candidates submitted for county councils | 47 | 43 | 48 |
| Average age of candidates for councils of cities holding county rights | 43 | 43 | 42 |
| Average age of candidates submitted for communal councils | 44 | 42 | 45 |
| Average age of candidates for reeve, mayor, president | 46 | 46 | 45 |
| Totalling | 45 | 42 | 46 |
| Submitted candidates for councils grouped by age | |||||
| Age | Number of candidates | Women | Women (%) | Men | Men (%) |
| 18-29 | 135 | 49 | 36,30% | 86 | 63,70% |
| 30-39 | 140 | 47 | 33,57% | 93 | 66,43% |
| 40-59 | 441 | 112 | 25,40% | 329 | 74,60% |
| 60+ | 145 | 33 | 22,76% | 112 | 77,24% |
| Totalling | 861 | 241 | 27,99% | 620 | 72,01% |
| Submitted candidates for reeve, mayor, president grouped by age | |||||
| Age | Number of candidates | Women | Women (%) | Men | Men (%) |
| 25-29 | 0 | 0 | - | 0 | - |
| 30-39 | 3 | 0 | 0,00% | 3 | 100,00% |
| 40-59 | 17 | 4 | 23,53% | 13 | 76,47% |
| 60+ | 0 | 0 | - | 0 | - |
| Totalling | 20 | 4 | 20,00% | 16 | 80,00% |
| The youngest and oldest submitted candidate for councils | ||
| Age | Institution | |
| Youngest | 18 | Rada Miejska w Prudniku |
| Oldest | 87 | Rada Powiatu w Prudniku |
| The youngest and oldest submitted candidate for reeve, mayor, president | ||
| Age | Institution | |
| Youngest | 31 | Burmistrz Kietrza |
| Oldest | 57 | Burmistrz Głubczyc |
Province podkarpackie
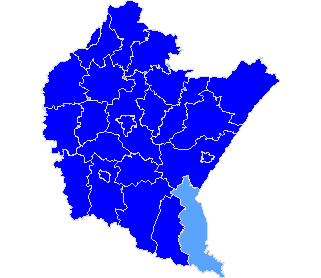
| Sejmik Województwa Podkarpackiego |
| Submitted candidates | ||||||
| Specification | Number of candidates | Women | Women (%) | Men | Men (%) | Status |
| Constituency no. 1 | 14 | 3 | 21,43% | 11 | 78,57% | Registered |
| Constituency no. 2 | 12 | 3 | 25,00% | 9 | 75,00% | Registered |
| Constituency no. 3 | 12 | 5 | 41,67% | 7 | 58,33% | Registered |
| Constituency no. 4 | 12 | 1 | 8,33% | 11 | 91,67% | Registered |
| Constituency no. 5 | 16 | 3 | 18,75% | 13 | 81,25% | Registered |
| Totalling | 66 | 15 | 22,73% | 51 | 77,27% | |
| Age of the candidates | |||||
| Specification | Average age | Average age of women | Average age of men | Oldest | Youngest |
| Constituency no. 1 | 53 | 47 | 55 | 67 | 34 |
| Constituency no. 2 | 50 | 41 | 53 | 68 | 34 |
| Constituency no. 3 | 54 | 53 | 54 | 68 | 41 |
| Constituency no. 4 | 55 | 56 | 55 | 64 | 45 |
| Constituency no. 5 | 53 | 46 | 55 | 69 | 39 |
| The statistics of election committe |
| Lists submitted | ||
| Specification | Number of | |
| lists | councils | |
| Lists submitted for province council | 5 | 1 |
| Lists submitted for county councils | 89 | 20 |
| Lists submitted for councils of cities holding county rights | 15 | 4 |
| Lists registered for communal councils | 661 | 112 |
| Totalling | 770 | 137 |
| Submitted candidates | |||||
| Specification | Number of candidates | Women | Women (%) | Men | Men (%) |
| Number of candidates submitted for the province council | 66 | 15 | 22,73% | 51 | 77,27% |
| Number of candidates submitted for county councils | 785 | 191 | 24,33% | 594 | 75,67% |
| Number of candidates submitted for councils of cities holding county rights | 180 | 45 | 25,00% | 135 | 75,00% |
| Number of candidates registered for communal councils | 1 530 | 386 | 25,23% | 1 144 | 74,77% |
| Number of candidates submitted for reeve, mayor and presidential elections | 73 | 9 | 12,33% | 64 | 87,67% |
| Totalling | 2 634 | 646 | 24,53% | 1 988 | 75,47% |
| Average age of submitted candidates | |||
| Specification | Average age | Average age of women | Average age of men |
| Average age of candidates submitted for the province council | 53 | 48 | 54 |
| Average age of candidates submitted for county councils | 48 | 46 | 48 |
| Average age of candidates for councils of cities holding county rights | 47 | 46 | 47 |
| Average age of candidates submitted for communal councils | 45 | 44 | 45 |
| Average age of candidates for reeve, mayor, president | 47 | 45 | 47 |
| Totalling | 46 | 44 | 46 |
| Submitted candidates for councils grouped by age | |||||
| Age | Number of candidates | Women | Women (%) | Men | Men (%) |
| 18-29 | 232 | 59 | 25,43% | 173 | 74,57% |
| 30-39 | 431 | 120 | 27,84% | 311 | 72,16% |
| 40-59 | 1 569 | 398 | 25,37% | 1 171 | 74,63% |
| 60+ | 329 | 60 | 18,24% | 269 | 81,76% |
| Totalling | 2 561 | 637 | 24,87% | 1 924 | 75,13% |
| Submitted candidates for reeve, mayor, president grouped by age | |||||
| Age | Number of candidates | Women | Women (%) | Men | Men (%) |
| 25-29 | 3 | 1 | 33,33% | 2 | 66,67% |
| 30-39 | 10 | 0 | 0,00% | 10 | 100,00% |
| 40-59 | 56 | 8 | 14,29% | 48 | 85,71% |
| 60+ | 4 | 0 | 0,00% | 4 | 100,00% |
| Totalling | 73 | 9 | 12,33% | 64 | 87,67% |
| The youngest and oldest submitted candidate for councils | ||
| Age | Institution | |
| Youngest | 18 | Rada Miejska w Nisku |
| Oldest | 84 | Rada Miejska w Dukli |
| The youngest and oldest submitted candidate for reeve, mayor, president | ||
| Age | Institution | |
| Youngest | 27 | Burmistrz Przecławia |
| Oldest | 70 | Burmistrz Brzostku |
Province podlaskie
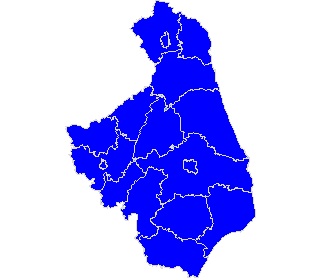
| Sejmik Województwa Podlaskiego |
| Submitted candidates | ||||||
| Specification | Number of candidates | Women | Women (%) | Men | Men (%) | Status |
| Constituency no. 1 | 14 | 3 | 21,43% | 11 | 78,57% | Registered |
| Constituency no. 2 | 10 | 1 | 10,00% | 9 | 90,00% | Registered |
| Constituency no. 3 | 10 | 1 | 10,00% | 9 | 90,00% | Registered |
| Constituency no. 4 | 10 | 1 | 10,00% | 9 | 90,00% | Registered |
| Constituency no. 5 | 15 | 2 | 13,33% | 13 | 86,67% | Registered |
| Totalling | 59 | 8 | 13,56% | 51 | 86,44% | |
| Age of the candidates | |||||
| Specification | Average age | Average age of women | Average age of men | Oldest | Youngest |
| Constituency no. 1 | 53 | 55 | 52 | 67 | 34 |
| Constituency no. 2 | 47 | 55 | 46 | 55 | 40 |
| Constituency no. 3 | 49 | 21 | 52 | 62 | 21 |
| Constituency no. 4 | 44 | 64 | 42 | 64 | 21 |
| Constituency no. 5 | 43 | 44 | 43 | 65 | 19 |
| The statistics of election committe |
| Lists submitted | ||
| Specification | Number of | |
| lists | councils | |
| Lists submitted for province council | 5 | 1 |
| Lists submitted for county councils | 56 | 14 |
| Lists submitted for councils of cities holding county rights | 13 | 3 |
| Lists registered for communal councils | 408 | 60 |
| Totalling | 482 | 78 |
| Submitted candidates | |||||
| Specification | Number of candidates | Women | Women (%) | Men | Men (%) |
| Number of candidates submitted for the province council | 59 | 8 | 13,56% | 51 | 86,44% |
| Number of candidates submitted for county councils | 442 | 126 | 28,51% | 316 | 71,49% |
| Number of candidates submitted for councils of cities holding county rights | 148 | 53 | 35,81% | 95 | 64,19% |
| Number of candidates registered for communal councils | 710 | 190 | 26,76% | 520 | 73,24% |
| Number of candidates submitted for reeve, mayor and presidential elections | 35 | 5 | 14,29% | 30 | 85,71% |
| Totalling | 1 394 | 382 | 27,40% | 1 012 | 72,60% |
| Average age of submitted candidates | |||
| Specification | Average age | Average age of women | Average age of men |
| Average age of candidates submitted for the province council | 47 | 49 | 47 |
| Average age of candidates submitted for county councils | 46 | 44 | 47 |
| Average age of candidates for councils of cities holding county rights | 46 | 48 | 46 |
| Average age of candidates submitted for communal councils | 45 | 44 | 45 |
| Average age of candidates for reeve, mayor, president | 45 | 48 | 45 |
| Totalling | 45 | 44 | 45 |
| Submitted candidates for councils grouped by age | |||||
| Age | Number of candidates | Women | Women (%) | Men | Men (%) |
| 18-29 | 133 | 36 | 27,07% | 97 | 72,93% |
| 30-39 | 239 | 72 | 30,13% | 167 | 69,87% |
| 40-59 | 825 | 231 | 28,00% | 594 | 72,00% |
| 60+ | 162 | 38 | 23,46% | 124 | 76,54% |
| Totalling | 1 359 | 377 | 27,74% | 982 | 72,26% |
| Submitted candidates for reeve, mayor, president grouped by age | |||||
| Age | Number of candidates | Women | Women (%) | Men | Men (%) |
| 25-29 | 3 | 1 | 33,33% | 2 | 66,67% |
| 30-39 | 5 | 0 | 0,00% | 5 | 100,00% |
| 40-59 | 24 | 4 | 16,67% | 20 | 83,33% |
| 60+ | 3 | 0 | 0,00% | 3 | 100,00% |
| Totalling | 35 | 5 | 14,29% | 30 | 85,71% |
| The youngest and oldest submitted candidate for councils | ||
| Age | Institution | |
| Youngest | 19 | Sejmik Województwa Podlaskiego |
| Oldest | 78 | Rada Powiatu w Mońkach |
| The youngest and oldest submitted candidate for reeve, mayor, president | ||
| Age | Institution | |
| Youngest | 26 | Wójt Gminy Radziłów |
| Oldest | 61 | Wójt Gminy Łomża |
Province pomorskie
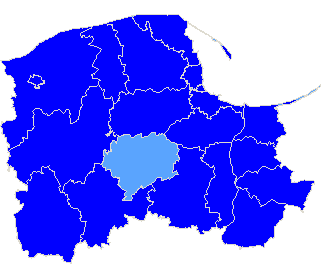
| Sejmik Województwa Pomorskiego |
| Submitted candidates | ||||||
| Specification | Number of candidates | Women | Women (%) | Men | Men (%) | Status |
| Constituency no. 1 | 14 | 3 | 21,43% | 11 | 78,57% | Registered |
| Constituency no. 2 | 15 | 2 | 13,33% | 13 | 86,67% | Registered |
| Constituency no. 3 | 12 | 5 | 41,67% | 7 | 58,33% | Registered |
| Constituency no. 4 | 11 | 3 | 27,27% | 8 | 72,73% | Registered |
| Constituency no. 5 | 9 | 1 | 11,11% | 8 | 88,89% | Registered |
| Totalling | 61 | 14 | 22,95% | 47 | 77,05% | |
| Age of the candidates | |||||
| Specification | Average age | Average age of women | Average age of men | Oldest | Youngest |
| Constituency no. 1 | 46 | 40 | 47 | 61 | 27 |
| Constituency no. 2 | 50 | 46 | 50 | 70 | 22 |
| Constituency no. 3 | 48 | 58 | 42 | 81 | 27 |
| Constituency no. 4 | 54 | 55 | 54 | 77 | 33 |
| Constituency no. 5 | 54 | 33 | 56 | 67 | 33 |
| The statistics of election committe |
| Lists submitted | ||
| Specification | Number of | |
| lists | councils | |
| Lists submitted for province council | 5 | 1 |
| Lists submitted for county councils | 56 | 15 |
| Lists submitted for councils of cities holding county rights | 19 | 4 |
| Lists registered for communal councils | 181 | 42 |
| Totalling | 261 | 62 |
| Submitted candidates | |||||
| Specification | Number of candidates | Women | Women (%) | Men | Men (%) |
| Number of candidates submitted for the province council | 61 | 14 | 22,95% | 47 | 77,05% |
| Number of candidates submitted for county councils | 423 | 119 | 28,13% | 304 | 71,87% |
| Number of candidates submitted for councils of cities holding county rights | 203 | 59 | 29,06% | 144 | 70,94% |
| Number of candidates registered for communal councils | 570 | 185 | 32,46% | 385 | 67,54% |
| Number of candidates submitted for reeve, mayor and presidential elections | 23 | 2 | 8,70% | 21 | 91,30% |
| Totalling | 1 280 | 379 | 29,61% | 901 | 70,39% |
| Average age of submitted candidates | |||
| Specification | Average age | Average age of women | Average age of men |
| Average age of candidates submitted for the province council | 50 | 50 | 50 |
| Average age of candidates submitted for county councils | 46 | 45 | 46 |
| Average age of candidates for councils of cities holding county rights | 48 | 50 | 48 |
| Average age of candidates submitted for communal councils | 46 | 45 | 46 |
| Average age of candidates for reeve, mayor, president | 46 | 50 | 46 |
| Totalling | 46 | 45 | 46 |
| Submitted candidates for councils grouped by age | |||||
| Age | Number of candidates | Women | Women (%) | Men | Men (%) |
| 18-29 | 149 | 39 | 26,17% | 110 | 73,83% |
| 30-39 | 221 | 71 | 32,13% | 150 | 67,87% |
| 40-59 | 673 | 214 | 31,80% | 459 | 68,20% |
| 60+ | 214 | 53 | 24,77% | 161 | 75,23% |
| Totalling | 1 257 | 377 | 29,99% | 880 | 70,01% |
| Submitted candidates for reeve, mayor, president grouped by age | |||||
| Age | Number of candidates | Women | Women (%) | Men | Men (%) |
| 25-29 | 1 | 0 | 0,00% | 1 | 100,00% |
| 30-39 | 5 | 0 | 0,00% | 5 | 100,00% |
| 40-59 | 15 | 2 | 13,33% | 13 | 86,67% |
| 60+ | 2 | 0 | 0,00% | 2 | 100,00% |
| Totalling | 23 | 2 | 8,70% | 21 | 91,30% |
| The youngest and oldest submitted candidate for councils | ||
| Age | Institution | |
| Youngest | 18 | Rada Powiatu Słupskiego |
| Oldest | 81 | Sejmik Województwa Pomorskiego |
| The youngest and oldest submitted candidate for reeve, mayor, president | ||
| Age | Institution | |
| Youngest | 27 | Wójt Gminy Skórcz |
| Oldest | 61 | Wójt Gminy Wejherowo |
Province śląskie
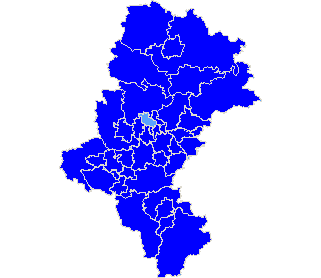
| Sejmik Województwa Śląskiego |
| Submitted candidates | ||||||
| Specification | Number of candidates | Women | Women (%) | Men | Men (%) | Status |
| Constituency no. 1 | 14 | 3 | 21,43% | 11 | 78,57% | Registered |
| Constituency no. 2 | 14 | 5 | 35,71% | 9 | 64,29% | Registered |
| Constituency no. 3 | 16 | 4 | 25,00% | 12 | 75,00% | Registered |
| Constituency no. 4 | 12 | 2 | 16,67% | 10 | 83,33% | Registered |
| Constituency no. 5 | 12 | 1 | 8,33% | 11 | 91,67% | Registered |
| Constituency no. 6 | 12 | 4 | 33,33% | 8 | 66,67% | Registered |
| Constituency no. 7 | 14 | 4 | 28,57% | 10 | 71,43% | Registered |
| Totalling | 94 | 23 | 24,47% | 71 | 75,53% | |
| Age of the candidates | |||||
| Specification | Average age | Average age of women | Average age of men | Oldest | Youngest |
| Constituency no. 1 | 46 | 43 | 46 | 65 | 25 |
| Constituency no. 2 | 48 | 53 | 45 | 69 | 21 |
| Constituency no. 3 | 44 | 49 | 43 | 69 | 21 |
| Constituency no. 4 | 43 | 49 | 42 | 58 | 19 |
| Constituency no. 5 | 53 | 64 | 52 | 71 | 39 |
| Constituency no. 6 | 49 | 46 | 51 | 67 | 28 |
| Constituency no. 7 | 49 | 42 | 52 | 68 | 25 |
| The statistics of election committe |
| Lists submitted | ||
| Specification | Number of | |
| lists | councils | |
| Lists submitted for province council | 7 | 1 |
| Lists submitted for county councils | 84 | 17 |
| Lists submitted for councils of cities holding county rights | 76 | 18 |
| Lists registered for communal councils | 285 | 71 |
| Totalling | 452 | 107 |
| Submitted candidates | |||||
| Specification | Number of candidates | Women | Women (%) | Men | Men (%) |
| Number of candidates submitted for the province council | 94 | 23 | 24,47% | 71 | 75,53% |
| Number of candidates submitted for county councils | 629 | 179 | 28,46% | 450 | 71,54% |
| Number of candidates submitted for councils of cities holding county rights | 841 | 242 | 28,78% | 599 | 71,22% |
| Number of candidates registered for communal councils | 945 | 335 | 35,45% | 610 | 64,55% |
| Number of candidates submitted for reeve, mayor and presidential elections | 48 | 5 | 10,42% | 43 | 89,58% |
| Totalling | 2 557 | 784 | 30,66% | 1 773 | 69,34% |
| Average age of submitted candidates | |||
| Specification | Average age | Average age of women | Average age of men |
| Average age of candidates submitted for the province council | 47 | 48 | 47 |
| Average age of candidates submitted for county councils | 45 | 44 | 46 |
| Average age of candidates for councils of cities holding county rights | 45 | 45 | 44 |
| Average age of candidates submitted for communal councils | 45 | 44 | 45 |
| Average age of candidates for reeve, mayor, president | 49 | 45 | 49 |
| Totalling | 45 | 44 | 45 |
| Submitted candidates for councils grouped by age | |||||
| Age | Number of candidates | Women | Women (%) | Men | Men (%) |
| 18-29 | 397 | 134 | 33,75% | 263 | 66,25% |
| 30-39 | 464 | 137 | 29,53% | 327 | 70,47% |
| 40-59 | 1 240 | 392 | 31,61% | 848 | 68,39% |
| 60+ | 408 | 116 | 28,43% | 292 | 71,57% |
| Totalling | 2 509 | 779 | 31,05% | 1 730 | 68,95% |
| Submitted candidates for reeve, mayor, president grouped by age | |||||
| Age | Number of candidates | Women | Women (%) | Men | Men (%) |
| 25-29 | 0 | 0 | - | 0 | - |
| 30-39 | 9 | 2 | 22,22% | 7 | 77,78% |
| 40-59 | 32 | 2 | 6,25% | 30 | 93,75% |
| 60+ | 7 | 1 | 14,29% | 6 | 85,71% |
| Totalling | 48 | 5 | 10,42% | 43 | 89,58% |
| The youngest and oldest submitted candidate for councils | ||
| Age | Institution | |
| Youngest | 18 | Rada Miasta Katowice |
| Oldest | 82 | Rada Miejska w Czeladzi |
| The youngest and oldest submitted candidate for reeve, mayor, president | ||
| Age | Institution | |
| Youngest | 31 | Prezydent Miasta Sosnowca |
| Oldest | 71 | Burmistrz Miasta Żywca |
Province świętokrzyskie
| Sejmik Województwa Świętokrzyskiego |
| Submitted candidates | ||||||
| Specification | Number of candidates | Women | Women (%) | Men | Men (%) | Status |
| Constituency no. 1 | 16 | 4 | 25,00% | 12 | 75,00% | Registered |
| Constituency no. 2 | 12 | 3 | 25,00% | 9 | 75,00% | Registered |
| Constituency no. 3 | 18 | 2 | 11,11% | 16 | 88,89% | Registered |
| Constituency no. 4 | 14 | 6 | 42,86% | 8 | 57,14% | Registered |
| Totalling | 60 | 15 | 25,00% | 45 | 75,00% | |
| Age of the candidates | |||||
| Specification | Average age | Average age of women | Average age of men | Oldest | Youngest |
| Constituency no. 1 | 49 | 44 | 51 | 62 | 33 |
| Constituency no. 2 | 46 | 46 | 45 | 62 | 22 |
| Constituency no. 3 | 46 | 34 | 48 | 79 | 26 |
| Constituency no. 4 | 49 | 50 | 48 | 67 | 27 |
| The statistics of election committe |
| Lists submitted | ||
| Specification | Number of | |
| lists | councils | |
| Lists submitted for province council | 4 | 1 |
| Lists submitted for county councils | 54 | 13 |
| Lists submitted for councils of cities holding county rights | 5 | 1 |
| Lists registered for communal councils | 475 | 78 |
| Totalling | 538 | 93 |
| Submitted candidates | |||||
| Specification | Number of candidates | Women | Women (%) | Men | Men (%) |
| Number of candidates submitted for the province council | 60 | 15 | 25,00% | 45 | 75,00% |
| Number of candidates submitted for county councils | 469 | 140 | 29,85% | 329 | 70,15% |
| Number of candidates submitted for councils of cities holding county rights | 50 | 5 | 10,00% | 45 | 90,00% |
| Number of candidates registered for communal councils | 901 | 293 | 32,52% | 608 | 67,48% |
| Number of candidates submitted for reeve, mayor and presidential elections | 38 | 4 | 10,53% | 34 | 89,47% |
| Totalling | 1 518 | 457 | 30,11% | 1 061 | 69,89% |
| Average age of submitted candidates | |||
| Specification | Average age | Average age of women | Average age of men |
| Average age of candidates submitted for the province council | 48 | 45 | 48 |
| Average age of candidates submitted for county councils | 46 | 46 | 46 |
| Average age of candidates for councils of cities holding county rights | 46 | 55 | 45 |
| Average age of candidates submitted for communal councils | 44 | 43 | 44 |
| Average age of candidates for reeve, mayor, president | 45 | 46 | 45 |
| Totalling | 44 | 44 | 44 |
| Submitted candidates for councils grouped by age | |||||
| Age | Number of candidates | Women | Women (%) | Men | Men (%) |
| 18-29 | 171 | 44 | 25,73% | 127 | 74,27% |
| 30-39 | 294 | 109 | 37,07% | 185 | 62,93% |
| 40-59 | 826 | 253 | 30,63% | 573 | 69,37% |
| 60+ | 189 | 47 | 24,87% | 142 | 75,13% |
| Totalling | 1 480 | 453 | 30,61% | 1 027 | 69,39% |
| Submitted candidates for reeve, mayor, president grouped by age | |||||
| Age | Number of candidates | Women | Women (%) | Men | Men (%) |
| 25-29 | 1 | 0 | 0,00% | 1 | 100,00% |
| 30-39 | 12 | 1 | 8,33% | 11 | 91,67% |
| 40-59 | 23 | 3 | 13,04% | 20 | 86,96% |
| 60+ | 2 | 0 | 0,00% | 2 | 100,00% |
| Totalling | 38 | 4 | 10,53% | 34 | 89,47% |
| The youngest and oldest submitted candidate for councils | ||
| Age | Institution | |
| Youngest | 18 | Rada Powiatu w Kielcach |
| Oldest | 79 | Sejmik Województwa Świętokrzyskiego |
| The youngest and oldest submitted candidate for reeve, mayor, president | ||
| Age | Institution | |
| Youngest | 25 | Wójt Gminy Raków |
| Oldest | 63 | Wójt Gminy Obrazów |
Province warmińsko-mazurskie
| Sejmik Województwa Warmińsko-Mazurskiego |
| Submitted candidates | ||||||
| Specification | Number of candidates | Women | Women (%) | Men | Men (%) | Status |
| Constituency no. 1 | 12 | 3 | 25,00% | 9 | 75,00% | Registered |
| Constituency no. 2 | 12 | 3 | 25,00% | 9 | 75,00% | Registered |
| Constituency no. 3 | 14 | 2 | 14,29% | 12 | 85,71% | Registered |
| Constituency no. 4 | 10 | 3 | 30,00% | 7 | 70,00% | Registered |
| Constituency no. 5 | 8 | 2 | 25,00% | 6 | 75,00% | Registered |
| Totalling | 56 | 13 | 23,21% | 43 | 76,79% | |
| Age of the candidates | |||||
| Specification | Average age | Average age of women | Average age of men | Oldest | Youngest |
| Constituency no. 1 | 45 | 60 | 39 | 76 | 27 |
| Constituency no. 2 | 54 | 45 | 57 | 75 | 29 |
| Constituency no. 3 | 46 | 32 | 49 | 71 | 23 |
| Constituency no. 4 | 47 | 51 | 45 | 59 | 28 |
| Constituency no. 5 | 45 | 49 | 44 | 70 | 24 |
| The statistics of election committe |
| Lists submitted | ||
| Specification | Number of | |
| lists | councils | |
| Lists submitted for province council | 5 | 1 |
| Lists submitted for county councils | 67 | 18 |
| Lists submitted for councils of cities holding county rights | 9 | 2 |
| Lists registered for communal councils | 248 | 53 |
| Totalling | 329 | 74 |
| Submitted candidates | |||||
| Specification | Number of candidates | Women | Women (%) | Men | Men (%) |
| Number of candidates submitted for the province council | 56 | 13 | 23,21% | 43 | 76,79% |
| Number of candidates submitted for county councils | 491 | 143 | 29,12% | 348 | 70,88% |
| Number of candidates submitted for councils of cities holding county rights | 95 | 26 | 27,37% | 69 | 72,63% |
| Number of candidates registered for communal councils | 704 | 247 | 35,09% | 457 | 64,91% |
| Number of candidates submitted for reeve, mayor and presidential elections | 28 | 4 | 14,29% | 24 | 85,71% |
| Totalling | 1 374 | 433 | 31,51% | 941 | 68,49% |
| Average age of submitted candidates | |||
| Specification | Average age | Average age of women | Average age of men |
| Average age of candidates submitted for the province council | 47 | 48 | 47 |
| Average age of candidates submitted for county councils | 46 | 45 | 46 |
| Average age of candidates for councils of cities holding county rights | 49 | 50 | 48 |
| Average age of candidates submitted for communal councils | 45 | 44 | 45 |
| Average age of candidates for reeve, mayor, president | 45 | 45 | 45 |
| Totalling | 45 | 44 | 45 |
| Submitted candidates for councils grouped by age | |||||
| Age | Number of candidates | Women | Women (%) | Men | Men (%) |
| 18-29 | 173 | 55 | 31,79% | 118 | 68,21% |
| 30-39 | 255 | 97 | 38,04% | 158 | 61,96% |
| 40-59 | 727 | 218 | 29,99% | 509 | 70,01% |
| 60+ | 191 | 59 | 30,89% | 132 | 69,11% |
| Totalling | 1 346 | 429 | 31,87% | 917 | 68,13% |
| Submitted candidates for reeve, mayor, president grouped by age | |||||
| Age | Number of candidates | Women | Women (%) | Men | Men (%) |
| 25-29 | 0 | 0 | - | 0 | - |
| 30-39 | 10 | 1 | 10,00% | 9 | 90,00% |
| 40-59 | 17 | 3 | 17,65% | 14 | 82,35% |
| 60+ | 1 | 0 | 0,00% | 1 | 100,00% |
| Totalling | 28 | 4 | 14,29% | 24 | 85,71% |
| The youngest and oldest submitted candidate for councils | ||
| Age | Institution | |
| Youngest | 18 | Rada Powiatu w Nowym Mieście Lubawskim |
| Oldest | 84 | Rada Miasta Olsztyn |
| The youngest and oldest submitted candidate for reeve, mayor, president | ||
| Age | Institution | |
| Youngest | 31 | Wójt Gminy Prostki |
| Oldest | 61 | Burmistrz Miasta Nidzica |
Province wielkopolskie
| Sejmik Województwa Wielkopolskiego |
| Submitted candidates | ||||||
| Specification | Number of candidates | Women | Women (%) | Men | Men (%) | Status |
| Constituency no. 1 | 12 | 4 | 33,33% | 8 | 66,67% | Registered |
| Constituency no. 2 | 14 | 3 | 21,43% | 11 | 78,57% | Registered |
| Constituency no. 3 | 14 | 4 | 28,57% | 10 | 71,43% | Registered |
| Constituency no. 4 | 9 | 1 | 11,11% | 8 | 88,89% | Registered |
| Constituency no. 5 | 14 | 4 | 28,57% | 10 | 71,43% | Registered |
| Constituency no. 6 | 12 | 3 | 25,00% | 9 | 75,00% | Registered |
| Totalling | 75 | 19 | 25,33% | 56 | 74,67% | |
| Age of the candidates | |||||
| Specification | Average age | Average age of women | Average age of men | Oldest | Youngest |
| Constituency no. 1 | 51 | 50 | 51 | 66 | 28 |
| Constituency no. 2 | 44 | 38 | 46 | 74 | 20 |
| Constituency no. 3 | 47 | 52 | 44 | 65 | 26 |
| Constituency no. 4 | 45 | 42 | 45 | 57 | 25 |
| Constituency no. 5 | 38 | 32 | 41 | 56 | 23 |
| Constituency no. 6 | 54 | 52 | 54 | 69 | 38 |
| The statistics of election committe |
| Lists submitted | ||
| Specification | Number of | |
| lists | councils | |
| Lists submitted for province council | 6 | 1 |
| Lists submitted for county councils | 110 | 27 |
| Lists submitted for councils of cities holding county rights | 19 | 4 |
| Lists registered for communal councils | 361 | 91 |
| Totalling | 496 | 123 |
| Submitted candidates | |||||
| Specification | Number of candidates | Women | Women (%) | Men | Men (%) |
| Number of candidates submitted for the province council | 75 | 19 | 25,33% | 56 | 74,67% |
| Number of candidates submitted for county councils | 806 | 262 | 32,51% | 544 | 67,49% |
| Number of candidates submitted for councils of cities holding county rights | 202 | 56 | 27,72% | 146 | 72,28% |
| Number of candidates registered for communal councils | 917 | 310 | 33,81% | 607 | 66,19% |
| Number of candidates submitted for reeve, mayor and presidential elections | 37 | 3 | 8,11% | 34 | 91,89% |
| Totalling | 2 037 | 650 | 31,91% | 1 387 | 68,09% |
| Average age of submitted candidates | |||
| Specification | Average age | Average age of women | Average age of men |
| Average age of candidates submitted for the province council | 46 | 45 | 47 |
| Average age of candidates submitted for county councils | 45 | 43 | 47 |
| Average age of candidates for councils of cities holding county rights | 45 | 46 | 44 |
| Average age of candidates submitted for communal councils | 45 | 44 | 46 |
| Average age of candidates for reeve, mayor, president | 46 | 44 | 47 |
| Totalling | 45 | 43 | 46 |
| Submitted candidates for councils grouped by age | |||||
| Age | Number of candidates | Women | Women (%) | Men | Men (%) |
| 18-29 | 307 | 110 | 35,83% | 197 | 64,17% |
| 30-39 | 368 | 132 | 35,87% | 236 | 64,13% |
| 40-59 | 977 | 316 | 32,34% | 661 | 67,66% |
| 60+ | 348 | 89 | 25,57% | 259 | 74,43% |
| Totalling | 2 000 | 647 | 32,35% | 1 353 | 67,65% |
| Submitted candidates for reeve, mayor, president grouped by age | |||||
| Age | Number of candidates | Women | Women (%) | Men | Men (%) |
| 25-29 | 1 | 0 | 0,00% | 1 | 100,00% |
| 30-39 | 8 | 1 | 12,50% | 7 | 87,50% |
| 40-59 | 26 | 2 | 7,69% | 24 | 92,31% |
| 60+ | 2 | 0 | 0,00% | 2 | 100,00% |
| Totalling | 37 | 3 | 8,11% | 34 | 91,89% |
| The youngest and oldest submitted candidate for councils | ||
| Age | Institution | |
| Youngest | 18 | Rada Miejska w Obornikach |
| Oldest | 88 | Rada Powiatu Obornickiego |
| The youngest and oldest submitted candidate for reeve, mayor, president | ||
| Age | Institution | |
| Youngest | 28 | Burmistrz Miasta Środa Wielkopolska |
| Oldest | 62 | Burmistrz Rogoźna |
Province zachodniopomorskie
| Sejmik Województwa Zachodniopomorskiego |
| Submitted candidates | ||||||
| Specification | Number of candidates | Women | Women (%) | Men | Men (%) | Status |
| Constituency no. 1 | 15 | 8 | 53,33% | 7 | 46,67% | Registered |
| Constituency no. 2 | 10 | 2 | 20,00% | 8 | 80,00% | Registered |
| Constituency no. 3 | 12 | 3 | 25,00% | 9 | 75,00% | Registered |
| Constituency no. 4 | 10 | 3 | 30,00% | 7 | 70,00% | Registered |
| Constituency no. 5 | 11 | 1 | 9,09% | 10 | 90,91% | Registered |
| Totalling | 58 | 17 | 29,31% | 41 | 70,69% | |
| Age of the candidates | |||||
| Specification | Average age | Average age of women | Average age of men | Oldest | Youngest |
| Constituency no. 1 | 53 | 57 | 48 | 69 | 25 |
| Constituency no. 2 | 55 | 46 | 57 | 68 | 43 |
| Constituency no. 3 | 46 | 44 | 46 | 57 | 26 |
| Constituency no. 4 | 42 | 44 | 40 | 58 | 30 |
| Constituency no. 5 | 53 | 56 | 53 | 73 | 24 |
| The statistics of election committe |
| Lists submitted | ||
| Specification | Number of | |
| lists | councils | |
| Lists submitted for province council | 5 | 1 |
| Lists submitted for county councils | 59 | 17 |
| Lists submitted for councils of cities holding county rights | 13 | 3 |
| Lists registered for communal councils | 136 | 36 |
| Totalling | 213 | 57 |
| Submitted candidates | |||||
| Specification | Number of candidates | Women | Women (%) | Men | Men (%) |
| Number of candidates submitted for the province council | 58 | 17 | 29,31% | 41 | 70,69% |
| Number of candidates submitted for county councils | 400 | 119 | 29,75% | 281 | 70,25% |
| Number of candidates submitted for councils of cities holding county rights | 154 | 48 | 31,17% | 106 | 68,83% |
| Number of candidates registered for communal councils | 408 | 154 | 37,75% | 254 | 62,25% |
| Number of candidates submitted for reeve, mayor and presidential elections | 17 | 2 | 11,76% | 15 | 88,24% |
| Totalling | 1 037 | 340 | 32,79% | 697 | 67,21% |
| Average age of submitted candidates | |||
| Specification | Average age | Average age of women | Average age of men |
| Average age of candidates submitted for the province council | 50 | 51 | 49 |
| Average age of candidates submitted for county councils | 47 | 45 | 48 |
| Average age of candidates for councils of cities holding county rights | 50 | 50 | 50 |
| Average age of candidates submitted for communal councils | 45 | 45 | 46 |
| Average age of candidates for reeve, mayor, president | 50 | 50 | 50 |
| Totalling | 46 | 46 | 47 |
| Submitted candidates for councils grouped by age | |||||
| Age | Number of candidates | Women | Women (%) | Men | Men (%) |
| 18-29 | 140 | 47 | 33,57% | 93 | 66,43% |
| 30-39 | 180 | 61 | 33,89% | 119 | 66,11% |
| 40-59 | 499 | 176 | 35,27% | 323 | 64,73% |
| 60+ | 201 | 54 | 26,87% | 147 | 73,13% |
| Totalling | 1 020 | 338 | 33,14% | 682 | 66,86% |
| Submitted candidates for reeve, mayor, president grouped by age | |||||
| Age | Number of candidates | Women | Women (%) | Men | Men (%) |
| 25-29 | 0 | 0 | - | 0 | - |
| 30-39 | 4 | 0 | 0,00% | 4 | 100,00% |
| 40-59 | 11 | 2 | 18,18% | 9 | 81,82% |
| 60+ | 2 | 0 | 0,00% | 2 | 100,00% |
| Totalling | 17 | 2 | 11,76% | 15 | 88,24% |
| The youngest and oldest submitted candidate for councils | ||
| Age | Institution | |
| Youngest | 18 | Rada Gminy Stargard Szczeciński |
| Oldest | 85 | Rada Miejska w Nowogardzie |
| The youngest and oldest submitted candidate for reeve, mayor, president | ||
| Age | Institution | |
| Youngest | 34 | Prezydent Miasta Kołobrzeg |
| Oldest | 68 | Burmistrz Gminy Dziwnów |
