

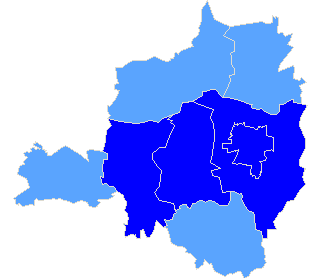
Powiat bełchatowski
| Rada Powiatu w Bełchatowie |
| Submitted candidates | ||||||
| Specification | Number of candidates | Women | Women (%) | Men | Men (%) | Status |
| Constituency no. 1 | 12 | 4 | 33,33% | 8 | 66,67% | Registered |
| Constituency no. 2 | 14 | 5 | 35,71% | 9 | 64,29% | Registered |
| Constituency no. 3 | 6 | 2 | 33,33% | 4 | 66,67% | Registered |
| Constituency no. 4 | 6 | 2 | 33,33% | 4 | 66,67% | Registered |
| Constituency no. 5 | 8 | 2 | 25,00% | 6 | 75,00% | Registered |
| Totalling | 46 | 15 | 32,61% | 31 | 67,39% | |
| Age of the candidates | |||||
| Specification | Average age | Average age of women | Average age of men | Oldest | Youngest |
| Constituency no. 1 | 40 | 45 | 37 | 63 | 24 |
| Constituency no. 2 | 41 | 41 | 41 | 64 | 24 |
| Constituency no. 3 | 54 | 41 | 61 | 65 | 26 |
| Constituency no. 4 | 40 | 35 | 43 | 58 | 26 |
| Constituency no. 5 | 56 | 54 | 57 | 68 | 38 |
| The statistics of election committe |
| Lists submitted | ||
| Specification | Number of | |
| lists | councils | |
| Lists submitted for county councils | 5 | 1 |
| Lists registered for communal councils | 26 | 4 |
| Totalling | 31 | 5 |
| Submitted candidates | |||||
| Specification | Number of candidates | Women | Women (%) | Men | Men (%) |
| Number of candidates submitted for county councils | 46 | 15 | 32,61% | 31 | 67,39% |
| Number of candidates registered for communal councils | 73 | 18 | 24,66% | 55 | 75,34% |
| Number of candidates submitted for reeve, mayor and presidential elections | 4 | 0 | 0,00% | 4 | 100,00% |
| Totalling | 123 | 33 | 26,83% | 90 | 73,17% |
| Average age of submitted candidates | |||
| Specification | Average age | Average age of women | Average age of men |
| Average age of candidates submitted for county councils | 45 | 43 | 46 |
| Average age of candidates submitted for communal councils | 44 | 40 | 46 |
| Average age of candidates for reeve, mayor, president | 43 | - | 43 |
| Totalling | 44 | 41 | 45 |
| Submitted candidates for councils grouped by age | |||||
| Age | Number of candidates | Women | Women (%) | Men | Men (%) |
| 18-29 | 15 | 5 | 33,33% | 10 | 66,67% |
| 30-39 | 31 | 9 | 29,03% | 22 | 70,97% |
| 40-59 | 59 | 18 | 30,51% | 41 | 69,49% |
| 60+ | 14 | 1 | 7,14% | 13 | 92,86% |
| Totalling | 119 | 33 | 27,73% | 86 | 72,27% |
| Submitted candidates for reeve, mayor, president grouped by age | |||||
| Age | Number of candidates | Women | Women (%) | Men | Men (%) |
| 25-29 | 0 | 0 | - | 0 | - |
| 30-39 | 3 | 0 | 0,00% | 3 | 100,00% |
| 40-59 | 1 | 0 | 0,00% | 1 | 100,00% |
| 60+ | 0 | 0 | - | 0 | - |
| Totalling | 4 | 0 | 0,00% | 4 | 100,00% |
| The youngest and oldest submitted candidate for councils | ||
| Age | Institution | |
| Youngest | 23 | Rada Miejska w Bełchatowie |
| Oldest | 68 | Rada Powiatu w Bełchatowie |
| The youngest and oldest submitted candidate for reeve, mayor, president | ||
| Age | Institution | |
| Youngest | 38 | Wójt Gminy Kluki |
| Oldest | 57 | Wójt Gminy Szczerców |
| Prezydent Miasta Bełchatowa |
| Number of | Family name and given names | Age | Education | Address, party membership and endorsements |
| 3 | Kubiak Dariusz Jan | 39 | średnie | Bełchatów, submitted by KOMITET WYBORCZY PRAWO I SPRAWIEDLIWOŚĆ, endorsed by Prawo i Sprawiedliwość, member of Prawa i Sprawiedliwości |
| Rada Miejska w Bełchatowie |
| Submitted candidates | ||||||
| Specification | Number of candidates | Women | Women (%) | Men | Men (%) | Status |
| Constituency no. 1 | 12 | 4 | 33,33% | 8 | 66,67% | Registered |
| Constituency no. 2 | 10 | 2 | 20,00% | 8 | 80,00% | Registered |
| Constituency no. 3 | 9 | 1 | 11,11% | 8 | 88,89% | Registered |
| Constituency no. 4 | 10 | 2 | 20,00% | 8 | 80,00% | Registered |
| Totalling | 41 | 9 | 21,95% | 32 | 78,05% | |
| Age of the candidates | |||||
| Specification | Average age | Average age of women | Average age of men | Oldest | Youngest |
| Constituency no. 1 | 41 | 32 | 46 | 61 | 23 |
| Constituency no. 2 | 50 | 34 | 54 | 62 | 33 |
| Constituency no. 3 | 50 | 61 | 48 | 61 | 28 |
| Constituency no. 4 | 39 | 40 | 38 | 58 | 24 |
| The statistics of election committe |
| Lists submitted | ||
| Specification | Number of | |
| lists | councils | |
| Lists registered for communal councils | 4 | 1 |
| Totalling | 4 | 1 |
| Submitted candidates | |||||
| Specification | Number of candidates | Women | Women (%) | Men | Men (%) |
| Number of candidates registered for communal councils | 41 | 9 | 21,95% | 32 | 78,05% |
| Number of candidates submitted for reeve, mayor and presidential elections | 1 | 0 | 0,00% | 1 | 100,00% |
| Totalling | 42 | 9 | 21,43% | 33 | 78,57% |
| Average age of submitted candidates | |||
| Specification | Average age | Average age of women | Average age of men |
| Average age of candidates submitted for communal councils | 45 | 37 | 47 |
| Average age of candidates for reeve, mayor, president | 39 | - | 39 |
| Totalling | 44 | 37 | 46 |
| Submitted candidates for councils grouped by age | |||||
| Age | Number of candidates | Women | Women (%) | Men | Men (%) |
| 18-29 | 5 | 2 | 40,00% | 3 | 60,00% |
| 30-39 | 10 | 4 | 40,00% | 6 | 60,00% |
| 40-59 | 23 | 2 | 8,70% | 21 | 91,30% |
| 60+ | 3 | 1 | 33,33% | 2 | 66,67% |
| Totalling | 41 | 9 | 21,95% | 32 | 78,05% |
| Submitted candidates for reeve, mayor, president grouped by age | |||||
| Age | Number of candidates | Women | Women (%) | Men | Men (%) |
| 25-29 | 0 | 0 | - | 0 | - |
| 30-39 | 1 | 0 | 0,00% | 1 | 100,00% |
| 40-59 | 0 | 0 | - | 0 | - |
| 60+ | 0 | 0 | - | 0 | - |
| Totalling | 1 | 0 | 0,00% | 1 | 100,00% |
| The youngest and oldest submitted candidate for councils | ||
| Age | Institution | |
| Youngest | 23 | Rada Miejska w Bełchatowie |
| Oldest | 62 | Rada Miejska w Bełchatowie |
| The youngest and oldest submitted candidate for reeve, mayor, president | ||
| Age | Institution | |
| Youngest | 39 | Prezydent Miasta Bełchatowa |
| Oldest | 39 | Prezydent Miasta Bełchatowa |
| Wójt Gminy Bełchatów |
| Number of | Family name and given names | Age | Education | Address, party membership and endorsements |
| 2 | Ładziak Kamil Jerzy | 38 | wyższe | Kałduny, submitted by KOMITET WYBORCZY PRAWO I SPRAWIEDLIWOŚĆ, member of Prawa i Sprawiedliwości |
| Rada Gminy Bełchatów |
| Submitted candidates | ||||||
| Specification | Number of candidates | Women | Women (%) | Men | Men (%) | Status |
| Constituency no. 1 | 1 | 0 | 0,00% | 1 | 100,00% | Registered |
| Constituency no. 2 | 2 | 0 | 0,00% | 2 | 100,00% | Registered |
| Constituency no. 3 | 1 | 0 | 0,00% | 1 | 100,00% | Registered |
| Constituency no. 5 | 2 | 0 | 0,00% | 2 | 100,00% | Registered |
| Constituency no. 6 | 1 | 0 | 0,00% | 1 | 100,00% | Registered |
| Constituency no. 7 | 1 | 0 | 0,00% | 1 | 100,00% | Registered |
| Constituency no. 8 | 1 | 0 | 0,00% | 1 | 100,00% | Registered |
| Constituency no. 9 | 1 | 0 | 0,00% | 1 | 100,00% | Registered |
| Constituency no. 10 | 1 | 0 | 0,00% | 1 | 100,00% | Registered |
| Constituency no. 11 | 1 | 1 | 100,00% | 0 | 0,00% | Registered |
| Constituency no. 13 | 1 | 0 | 0,00% | 1 | 100,00% | Registered |
| Totalling | 13 | 1 | 7,69% | 12 | 92,31% | |
| Age of the candidates | |||||
| Specification | Average age | Average age of women | Average age of men | Oldest | Youngest |
| Constituency no. 1 | 51 | - | 51 | 51 | 51 |
| Constituency no. 2 | 46 | - | 46 | 53 | 39 |
| Constituency no. 3 | 42 | - | 42 | 42 | 42 |
| Constituency no. 5 | 58 | - | 58 | 62 | 53 |
| Constituency no. 6 | 29 | - | 29 | 29 | 29 |
| Constituency no. 7 | 40 | - | 40 | 40 | 40 |
| Constituency no. 8 | 36 | - | 36 | 36 | 36 |
| Constituency no. 9 | 29 | - | 29 | 29 | 29 |
| Constituency no. 10 | 50 | - | 50 | 50 | 50 |
| Constituency no. 11 | 52 | 52 | - | 52 | 52 |
| Constituency no. 13 | 42 | - | 42 | 42 | 42 |
| The statistics of election committe |
| Lists submitted | ||
| Specification | Number of | |
| lists | councils | |
| Lists registered for communal councils | 11 | 1 |
| Totalling | 11 | 1 |
| Submitted candidates | |||||
| Specification | Number of candidates | Women | Women (%) | Men | Men (%) |
| Number of candidates registered for communal councils | 13 | 1 | 7,69% | 12 | 92,31% |
| Number of candidates submitted for reeve, mayor and presidential elections | 1 | 0 | 0,00% | 1 | 100,00% |
| Totalling | 14 | 1 | 7,14% | 13 | 92,86% |
| Average age of submitted candidates | |||
| Specification | Average age | Average age of women | Average age of men |
| Average age of candidates submitted for communal councils | 44 | 52 | 44 |
| Average age of candidates for reeve, mayor, president | 38 | - | 38 |
| Totalling | 43 | 52 | 43 |
| Submitted candidates for councils grouped by age | |||||
| Age | Number of candidates | Women | Women (%) | Men | Men (%) |
| 18-29 | 2 | 0 | 0,00% | 2 | 100,00% |
| 30-39 | 2 | 0 | 0,00% | 2 | 100,00% |
| 40-59 | 8 | 1 | 12,50% | 7 | 87,50% |
| 60+ | 1 | 0 | 0,00% | 1 | 100,00% |
| Totalling | 13 | 1 | 7,69% | 12 | 92,31% |
| Submitted candidates for reeve, mayor, president grouped by age | |||||
| Age | Number of candidates | Women | Women (%) | Men | Men (%) |
| 25-29 | 0 | 0 | - | 0 | - |
| 30-39 | 1 | 0 | 0,00% | 1 | 100,00% |
| 40-59 | 0 | 0 | - | 0 | - |
| 60+ | 0 | 0 | - | 0 | - |
| Totalling | 1 | 0 | 0,00% | 1 | 100,00% |
| The youngest and oldest submitted candidate for councils | ||
| Age | Institution | |
| Youngest | 29 | Rada Gminy Bełchatów |
| Oldest | 62 | Rada Gminy Bełchatów |
| The youngest and oldest submitted candidate for reeve, mayor, president | ||
| Age | Institution | |
| Youngest | 38 | Wójt Gminy Bełchatów |
| Oldest | 38 | Wójt Gminy Bełchatów |
| Wójt Gminy Kluki |
| Number of | Family name and given names | Age | Education | Address, party membership and endorsements |
| 3 | Rogoziński Wojciech Leon | 38 | wyższe | Laski, submitted by KOMITET WYBORCZY PRAWO I SPRAWIEDLIWOŚĆ, not a member of any political party |
| Rada Gminy Kluki |
| Submitted candidates | ||||||
| Specification | Number of candidates | Women | Women (%) | Men | Men (%) | Status |
| Constituency no. 1 | 4 | 1 | 25,00% | 3 | 75,00% | Registered |
| Constituency no. 2 | 1 | 0 | 0,00% | 1 | 100,00% | Registered |
| Constituency no. 4 | 1 | 1 | 100,00% | 0 | 0,00% | Registered |
| Constituency no. 6 | 1 | 1 | 100,00% | 0 | 0,00% | Registered |
| Constituency no. 7 | 2 | 0 | 0,00% | 2 | 100,00% | Registered |
| Constituency no. 8 | 1 | 0 | 0,00% | 1 | 100,00% | Registered |
| Totalling | 10 | 3 | 30,00% | 7 | 70,00% | |
| Age of the candidates | |||||
| Specification | Average age | Average age of women | Average age of men | Oldest | Youngest |
| Constituency no. 1 | 51 | 47 | 52 | 67 | 38 |
| Constituency no. 2 | 63 | - | 63 | 63 | 63 |
| Constituency no. 4 | 28 | 28 | - | 28 | 28 |
| Constituency no. 6 | 33 | 33 | - | 33 | 33 |
| Constituency no. 7 | 36 | - | 36 | 38 | 33 |
| Constituency no. 8 | 43 | - | 43 | 43 | 43 |
| The statistics of election committe |
| Lists submitted | ||
| Specification | Number of | |
| lists | councils | |
| Lists registered for communal councils | 6 | 1 |
| Totalling | 6 | 1 |
| Submitted candidates | |||||
| Specification | Number of candidates | Women | Women (%) | Men | Men (%) |
| Number of candidates registered for communal councils | 10 | 3 | 30,00% | 7 | 70,00% |
| Number of candidates submitted for reeve, mayor and presidential elections | 1 | 0 | 0,00% | 1 | 100,00% |
| Totalling | 11 | 3 | 27,27% | 8 | 72,73% |
| Average age of submitted candidates | |||
| Specification | Average age | Average age of women | Average age of men |
| Average age of candidates submitted for communal councils | 44 | 36 | 47 |
| Average age of candidates for reeve, mayor, president | 38 | - | 38 |
| Totalling | 43 | 36 | 45 |
| Submitted candidates for councils grouped by age | |||||
| Age | Number of candidates | Women | Women (%) | Men | Men (%) |
| 18-29 | 1 | 1 | 100,00% | 0 | 0,00% |
| 30-39 | 4 | 1 | 25,00% | 3 | 75,00% |
| 40-59 | 3 | 1 | 33,33% | 2 | 66,67% |
| 60+ | 2 | 0 | 0,00% | 2 | 100,00% |
| Totalling | 10 | 3 | 30,00% | 7 | 70,00% |
| Submitted candidates for reeve, mayor, president grouped by age | |||||
| Age | Number of candidates | Women | Women (%) | Men | Men (%) |
| 25-29 | 0 | 0 | - | 0 | - |
| 30-39 | 1 | 0 | 0,00% | 1 | 100,00% |
| 40-59 | 0 | 0 | - | 0 | - |
| 60+ | 0 | 0 | - | 0 | - |
| Totalling | 1 | 0 | 0,00% | 1 | 100,00% |
| The youngest and oldest submitted candidate for councils | ||
| Age | Institution | |
| Youngest | 28 | Rada Gminy Kluki |
| Oldest | 67 | Rada Gminy Kluki |
| The youngest and oldest submitted candidate for reeve, mayor, president | ||
| Age | Institution | |
| Youngest | 38 | Wójt Gminy Kluki |
| Oldest | 38 | Wójt Gminy Kluki |
| Wójt Gminy Szczerców |
| Number of | Family name and given names | Age | Education | Address, party membership and endorsements |
| 2 | Martela Kazimierz | 57 | wyższe | Szczerców, submitted by KOMITET WYBORCZY PRAWO I SPRAWIEDLIWOŚĆ, member of Prawa i Sprawiedliwości |
| Rada Gminy Szczerców |
| Submitted candidates | ||||||
| Specification | Number of candidates | Women | Women (%) | Men | Men (%) | Status |
| Constituency no. 1 | 1 | 1 | 100,00% | 0 | 0,00% | Registered |
| Constituency no. 2 | 1 | 1 | 100,00% | 0 | 0,00% | Registered |
| Constituency no. 3 | 1 | 1 | 100,00% | 0 | 0,00% | Registered |
| Constituency no. 5 | 3 | 1 | 33,33% | 2 | 66,67% | Registered |
| Constituency no. 6 | 3 | 1 | 33,33% | 2 | 66,67% | Registered |
| Totalling | 9 | 5 | 55,56% | 4 | 44,44% | |
| Age of the candidates | |||||
| Specification | Average age | Average age of women | Average age of men | Oldest | Youngest |
| Constituency no. 1 | 46 | 46 | - | 46 | 46 |
| Constituency no. 2 | 55 | 55 | - | 55 | 55 |
| Constituency no. 3 | 47 | 47 | - | 47 | 47 |
| Constituency no. 5 | 46 | 42 | 48 | 48 | 42 |
| Constituency no. 6 | 43 | 41 | 44 | 58 | 29 |
| The statistics of election committe |
| Lists submitted | ||
| Specification | Number of | |
| lists | councils | |
| Lists registered for communal councils | 5 | 1 |
| Totalling | 5 | 1 |
| Submitted candidates | |||||
| Specification | Number of candidates | Women | Women (%) | Men | Men (%) |
| Number of candidates registered for communal councils | 9 | 5 | 55,56% | 4 | 44,44% |
| Number of candidates submitted for reeve, mayor and presidential elections | 1 | 0 | 0,00% | 1 | 100,00% |
| Totalling | 10 | 5 | 50,00% | 5 | 50,00% |
| Average age of submitted candidates | |||
| Specification | Average age | Average age of women | Average age of men |
| Average age of candidates submitted for communal councils | 46 | 46 | 46 |
| Average age of candidates for reeve, mayor, president | 57 | - | 57 |
| Totalling | 47 | 46 | 48 |
| Submitted candidates for councils grouped by age | |||||
| Age | Number of candidates | Women | Women (%) | Men | Men (%) |
| 18-29 | 1 | 0 | 0,00% | 1 | 100,00% |
| 30-39 | 0 | 0 | - | 0 | - |
| 40-59 | 8 | 5 | 62,50% | 3 | 37,50% |
| 60+ | 0 | 0 | - | 0 | - |
| Totalling | 9 | 5 | 55,56% | 4 | 44,44% |
| Submitted candidates for reeve, mayor, president grouped by age | |||||
| Age | Number of candidates | Women | Women (%) | Men | Men (%) |
| 25-29 | 0 | 0 | - | 0 | - |
| 30-39 | 0 | 0 | - | 0 | - |
| 40-59 | 1 | 0 | 0,00% | 1 | 100,00% |
| 60+ | 0 | 0 | - | 0 | - |
| Totalling | 1 | 0 | 0,00% | 1 | 100,00% |
| The youngest and oldest submitted candidate for councils | ||
| Age | Institution | |
| Youngest | 29 | Rada Gminy Szczerców |
| Oldest | 58 | Rada Gminy Szczerców |
| The youngest and oldest submitted candidate for reeve, mayor, president | ||
| Age | Institution | |
| Youngest | 57 | Wójt Gminy Szczerców |
| Oldest | 57 | Wójt Gminy Szczerców |
